. 2025 Jun 3;26(11):5353.
doi: 10.3390/ijms26115353.

Vat-Mediated Mucus Penetration Enables Genotoxic Activity of pks+ Escherichia coli

Affiliations

Vat-Mediated Mucus Penetration Enables Genotoxic Activity of pks+ Escherichia coli

Héloïse Chat et al. Int J Mol Sci. .

Abstract

Colibactin toxin-producing Escherichia coli (pks+ E. coli) strains are associated with the occurrence of colorectal cancer in humans. These strains induce DNA damage when in close contact with the cells of the intestinal epithelium. Therefore, maintaining the integrity of the mucus layer that covers the intestinal epithelial mucosa is crucial for counteracting the effects of colibactin. The Vat protein is a mucin protease capable of degrading MUC2 mucus proteins that was previously described in adherent and invasive Escherichia coli strains. Our work shows that the vat gene is found in the genome of all pks+ E. coli strains isolated from patients with colon cancer. In mucus-producing HT29-16E cells, we demonstrated that the Vat protein of E. coli pks+ allows bacteria to penetrate mucus and to reach the epithelial cells. Cells infected with the E. coli pks + vat- strain show a reduction in γ-H2AX staining, a marker of DNA damage. Infection of ApcMin/+ mice with the E. coli pks + vat+ strain or the E. coli pks + vat- mutant revealed that Vat enhances the ability of pks+ E. coli strains to colonize the intestinal mucosa and, in turn, their pro-carcinogenic effects. This study reveals that Vat promotes crossing of the intestinal mucus layer, gut colonization, and the carcinogenicity of pks+ E. coli.

Keywords: Escherichia coli; colibactin; colorectal cancer; mucin; pks.


Conflict of interest statement

The authors declare no conflicts of interest.

Figures

Figure 1
Figure 1
Mucin protease prevalence in pks+ E. coli. (A) Metagenomics analysis of most frequently found mucin proteases in pks+ E. coli (n = 2041). E. coli sequences in databases were obtained from different metagenomic analysis, and vat prevalence was searched among pks+ E. coli (clbQ screening). (B) Mucin protease prevalence in E. coli isolated from CRC patients (n = 112). Genes encoding Vat, pic, and hbp/tsh mucin proteases were screened using PCR in E. coli (n = 222) isolated from tumoral colonic human biopsies (n = 112) of CRC (n = 87) or normal mucosa for control patients (n = 25). Statistical analysis was performed with the χ2 test. (C) The Vat gene was screened with PCR among pks+ E. coli (n = 58) or pks- E. coli (n = 54) strains isolated from CRC colonic human biopsies. A patient was considered positive if at least one pks+ E. coli was detected in his or her biopsy.
Figure 2
Figure 2
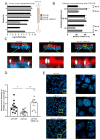
Deletion of the vat gene in pks+ E. coli impairs bacteria mucus crossing and reduces genotoxicity. (A) The assessment of mucus crossing using the column penetration assay. Quantification of indicated pks+ E. coli strains in fractions eluted from columns filled with gel-forming mucus (fractions 1 to 4 were sequentially obtained from the bottom to top of the column). Data are representative of three independent experiments. (B,C) Mucus-producing HT29-16E cells were infected for 45 min with a multiplicity of Infection of 100. For each replicate, three representative fields were analyzed, and experiments were performed three times. (C) Cells were stained with Hoechst (blue), mucus with WGA-leptin (red), and pks+ E. coli with fluorescence in situ hybridization using the Cy3-pks+ E. coli probe. Representative confocal microscopy images of infected HT29-16E cells are shown. (B) Cy3-pks+ E. coli (shown in white in (C)) were counted and the distance to Hoechst-stained cells was measured using Imaris software (v10.0.1). The total number of bacteria detected was pks + vat- +pBAD-vat (n = 1057), pks + vat+ (n = 586), and pks + vat- (n = 377). The distances between bacteria to cell were determined for each field. Bacteria were counted in each 2 µm layer and then expressed as a percentage relative to the total number of bacteria for each condition. (D,E) Mucus-producing HT29-16E cells were infected for 90 min with a multiplicity of infection of 100. For each replicate, at least three representative fields were analyzed, and experiments were performed three times. Phosphorylated γ-H2AX foci fluorescence intensity was determined based on immunofluorescence of the nuclei volume (Hoechst staining) 24 h post-infection. Data are presented as means ± SEMs. Statistical comparisons were carried out by one-way Kruskal–Wallis nonparametric tests followed by Dunn posttests after normality testing (* p < 0.05, ** p < 0.01, *** p < 0.001).
Figure 3
Figure 3
Vat favors gut colonization of pks+ E. coli and increases colonic tumors numbers in ApcMin/+. (A) ApcMin/+ mice were orally administered 109 colony-forming units (CFUs) of E. coli pks + vat+, E. coli pks + vat- mutant, or PBS. In order to facilitate implantation of E. coli, streptomycin (2.5 g/L) was administered for 3 days prior to oral inoculation with bacteria. Feces were collected each once a week, and E. coli pks + vat+ or E. coli pks + vat- CFUs per gram of feces were determined. (B) Bacterial colonization in the stools of mice from 7 to 42 days post-infection. Values are presented as medians ± errors. (C) Area under the curve (AUC) values from bacterial colonization in the stools of mice from 7 to 42 days post-infection. The data points represent actual values for each individual mouse, and the bars indicate median values. (D) The number of E. coli associated with non-tumoral colonic tissue at 44 days post-infection was determined. Colonization data are presented as medians. (E) The number of colorectal tumors per mouse was determined using a dissecting microscope. Data are presented as medians. Statistical comparisons were carried out using one-way Kruskal–Wallis nonparametric test for three groups mice or the Mann–Whitney test analysis for two groups mice followed by the Dunn posttest after normality testing (* p < 0.05, ** p < 0.01, *** p < 0.001, ns = not significant).

References

    1. Morgan E., Arnold M., Gini A., Lorenzoni V., Cabasag C.J., Laversanne M., Vignat J., Ferlay J., Murphy N., Bray F. Global Burden of Colorectal Cancer in 2020 and 2040: Incidence and Mortality Estimates from GLOBOCAN. Gut. 2023;72:338–344. doi: 10.1136/gutjnl-2022-327736. - DOI - PubMed
    1. Dougherty M.W., Jobin C. Intestinal Bacteria and Colorectal Cancer: Etiology and Treatment. Gut Microbes. 2023;15:2185028. doi: 10.1080/19490976.2023.2185028. - DOI - PMC - PubMed
    1. Kim J., Lee H.K. Potential Role of the Gut Microbiome In Colorectal Cancer Progression. Front. Immunol. 2021;12:807648. doi: 10.3389/fimmu.2021.807648. - DOI - PMC - PubMed
    1. Tjalsma H., Boleij A., Marchesi J.R., Dutilh B.E. A Bacterial Driver-Passenger Model for Colorectal Cancer: Beyond the Usual Suspects. Nat. Rev. Microbiol. 2012;10:575–582. doi: 10.1038/nrmicro2819. - DOI - PubMed
    1. Nougayrède J.-P., Homburg S., Taieb F., Boury M., Brzuszkiewicz E., Gottschalk G., Buchrieser C., Hacker J., Dobrindt U., Oswald E. Escherichia coli Induces DNA Double-Strand Breaks in Eukaryotic Cells. Science. 2006;313:848–851. doi: 10.1126/science.1127059. - DOI - PubMed

MeSH terms

LinkOut - more resources