. 2025 May 27;17(11):1487.
doi: 10.3390/polym17111487.

Tribological Evaluation of Polyether Ether Ketone (PEEK) Nanocomposite Coatings Reinforced with Ceria-Effect of Composition, Load, Speed, Counterface, and UV Exposure

Affiliations

Tribological Evaluation of Polyether Ether Ketone (PEEK) Nanocomposite Coatings Reinforced with Ceria-Effect of Composition, Load, Speed, Counterface, and UV Exposure

Amal A Seenath et al. Polymers (Basel). .

Abstract

Ceria nanofillers were incorporated into PEEK coatings at concentrations of 0.5, 1.5, and 3 wt% and applied to mild steel samples using an electrostatic spraying technique. The tribological performance of these coatings was assessed under various loads and sliding speeds. XRD, FTIR, and microhardness tests were conducted to characterize the chemical and mechanical properties of the coatings. The 1.5 wt% ceria-reinforced PEEK coating outperformed the pristine PEEK and other concentrations in terms of wear resistance. The counterface material did not affect the wear resistance of the optimized PEEK/1.5 wt% ceria nanocomposite coating, which also demonstrated superior wear resistance after UV exposure as compared to that of pristine PEEK coatings.

Keywords: PEEK; ceria; friction; nanocomposite coatings; wear.


Conflict of interest statement

The authors declare no conflicts of interest.

Figures

Figure 1
Figure 1
SEM micrographs of (a) PEEK and (b) nano ceria particles.
Figure 2
Figure 2
XRD patterns of pristine PEEK and PEEK reinforced with ceria at different loading conditions.
Figure 3
Figure 3
Hardness comparison of PEEK nanocomposite coatings with varying ceria loadings.
Figure 4
Figure 4
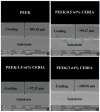
Cross-sectional SEM images of the coatings.
Figure 5
Figure 5
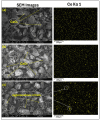
SEM images PEEK matrix reinforced with (a) 0.5 wt%, (b) 1.5 wt%, and (c) 3 wt% ceria loadings, along with EDS maps for cerium (Ce).
Figure 6
Figure 6
TGA thermograms of pristine PEEK and PEEK nanocomposite powders.
Figure 7
Figure 7
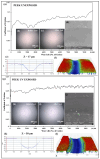
Comparison of the (a,i,q) frictional graph of pristine PEEK coatings, along with (b,j,r) wear track photographs, (c,k,s) SEM images and the corresponding (d,l,t) EDS scans, the (e,m,u) counter face ball images before and (f,n,v) after the test, the (g,o,w) 2D depth, and the (h,g,p,x) 3D profile images of the wear track at varying normal loads for 10,000 cycles at 0.1 m/s.
Figure 8
Figure 8
Pristine PEEK coating at a normal load of 70 N, including the (a) frictional graph and (b,c) SEM image, along with the (d) corresponding EDS scan, (e) 3D optical scan, and (f) 2D optical scan of the wear track.
Figure 9
Figure 9
Pristine PEEK coating at a normal load of 70 N, including the (a) frictional graph, along with the peeled-off coating with the (b) ball image before and (c) after testing with acetone cleaning.
Figure 10
Figure 10
Wear life comparison for pristine PEEK coatings under a normal load of 70 N over 10,000 cycles at varying sliding speeds.
Figure 11
Figure 11
PEEK/0.5 wt% ceria coating at a normal load of 70 N, including the (a) frictional graph and (b,c) SEM image, along with the (d) corresponding EDS scan, (e) 3D optical scan, and (f) 2D optical scan of the wear track.
Figure 12
Figure 12
PEEK/0.5 wt% ceria coating at a normal load of 70 N, including the (a) frictional graph and the peeled-off coating with the (b) ball image before and (c) after testing with acetone cleaning.
Figure 13
Figure 13
A comparative study of the wear life of PEEK/0.5 wt% ceria coatings under a normal load of 70 N over 10,000 cycles at varying sliding speeds.
Figure 14
Figure 14
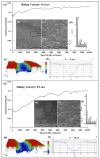
(a,g) Frictional graphs of PEEK/1.5 wt% ceria coatings, along with (b,c,h,i) SEM images with the corresponding (d,j) EDS scans, (e,k) 3D profile, and (f,l) wear track depth images of the wear track at varying sliding velocities for 10,000 cycles at 70 N.
Figure 15
Figure 15
PEEK/3 wt% ceria coating at a normal load of 70 N, including the (a) frictional graph and (b,c) SEM images, along with the (d) corresponding EDS scan (e), 3D optical scan, and (f) 2D optical scan of the wear track.
Figure 16
Figure 16
PEEK/1.5 wt% ceria coating at a normal load of 70 N, including the (a) frictional graph (b,c) and SEM images, along with the (d) corresponding EDS scan, (e) 3D optical scan, and (f) 2D optical scan of the wear track for 50,000 cycles.
Figure 17
Figure 17
PEEK/3wt% ceria coating at a normal load of 70 N, including (a) the frictional graph, along with the peeled-off coating with the (b) ball image before and (c) after testing with acetone cleaning.
Figure 18
Figure 18
Comparative wear life study of the nanocomposite coatings at a normal load of 70 N for 50,000 cycles at a sliding velocity of 0.5 m/s.
Figure 19
Figure 19
(a,g) Frictional graphs of PEEK/1.5 wt% ceria coatings, along with the (b,c,h,i) SEM images of the wear track with the corresponding (d,j) EDS scan, (e,k) 3D profile, and (f,l) the wear track depth images at varying normal loads for 10,000 cycles at 0.4 m/s.
Figure 20
Figure 20
PEEK/1.5 wt% ceria coating at a sliding velocity of 0.4 m/s, including the (a) frictional graph, along with the peeled-off coating with the (b) ball image before and (c) after testing with acetone cleaning.
Figure 21
Figure 21
Comparative wear life study of PEEK/1.5 wt% ceria coatings at a sliding velocity of 0.4 m/s for 10,000 cycles at different normal loads.
Figure 22
Figure 22
PEEK/1.5 wt% ceria coating at a normal load of 90 N, including the (a) frictional graph and (b,c) SEM images, along with the (d) corresponding EDS scan and (e) 3D optical scan of the wear track and the (f) 2D optical scan of the wear track for 50,000 cycles.
Figure 23
Figure 23
Comparison of the (a,f,k) frictional graph of PEEK/1.5 wt% ceria nanocomposite coatings, along with (b,g,l) wear track photographs and (c,h,m) SEM images with the corresponding (d,i,n) 3D and (e,j,o) 2D profile images of the wear track at a normal load of 90 N at 0.4 m/s for 10,000 cycles.
Figure 24
Figure 24
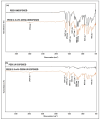
FTIR spectra of the pristine PEEK and PEEK/1.5 wt% ceria coatings (a) unexposed and (b) exposed to UV radiation.
Figure 25
Figure 25
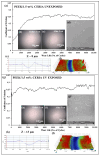
Comparison of the (a,g) frictional graph of PEEK coatings, along with the (b,h) before test ball and (c,i) after test ball images, with the (d,j) SEM images and the corresponding (e,k) 2D profile and (f,l) 3D profile wear track depth images at a normal load of 50 N at 0.1 m/s for 10,000 cycles.
Figure 26
Figure 26
Comparison of the (a,g) frictional graph of the PEEK/1.5 wt% ceria coatings, along with the (b,h) before test ball and (c,i) after test ball images, with the (d,j) SEM images and the corresponding (e,k) 2D profile and (f,l) 3D profile wear track depth images at a normal load of 50 N at 0.1 m/s for 10,000 cycles.

Similar articles

References

    1. Nunez E.E., Yeo S.M., Polychronopoulou K., Polycarpou A.A. Tribological study of high bearing blended polymer-based coatings for air-conditioning and refrigeration compressors. Surf. Coat. Technol. 2011;205:2994–3005. doi: 10.1016/j.surfcoat.2010.11.008. - DOI
    1. Palathai T., Tharajak J., Sombatsompop N. Hardness, adhesion index and microstructure of PEEK coating on Al or Fe substrate by LVOF flame spray. Mater. Sci. Eng. A. 2008;485:66–73. doi: 10.1016/j.msea.2007.07.049. - DOI
    1. Seenath A.A., Baig M.M.A., Katiyar J.K., Mohammed A.S. A Comprehensive Review on the Tribological Evaluation of Polyether Ether Ketone Pristine and Composite Coatings. Polymers. 2024;16:2994. doi: 10.3390/polym16212994. - DOI - PMC - PubMed
    1. Chi M.-H., Tsou H.-K., Chung C.-J., He J.-L. Biomimetic hydroxyapatite grown on biomedical polymer coated with titanium dioxide interlayer to assist osteocompatible performance. Thin Solid Film. 2013;549:98–102. doi: 10.1016/j.tsf.2013.06.063. - DOI
    1. Barhoumi N., Khlifi K., Attia-Essaies S. Mechanical and bioactive properties of PVD TiO2 coating modified PEEK for biomedical applications. J. Mech. Behav. Biomed. Mater. 2023;144:105935. doi: 10.1016/j.jmbbm.2023.105935. - DOI - PubMed

LinkOut - more resources