. 2025 May 30;15(11):1618.
doi: 10.3390/ani15111618.

NDUFAB1 as a Novel Regulator of NEFA-Induced Metabolic Dysfunction in Bovine Adipocytes

Affiliations

NDUFAB1 as a Novel Regulator of NEFA-Induced Metabolic Dysfunction in Bovine Adipocytes

Jing Zhou et al. Animals (Basel). .

Abstract

Elevated non-esterified fatty acid (NEFA) levels are closely associated with metabolic disorders in dairy cattle, yet their direct effects on adipocyte physiology remain poorly understood. In this study, we demonstrate that high NEFA concentrations significantly impair bovine adipocyte function by simultaneously inhibiting proliferation/differentiation (p < 0.01) and promoting pathological lipid deposition. Through integrated transcriptomic and functional analyses, we identified NDUFAB1 as a central metabolic regulator that counteracts NEFA-induced adipocyte dysfunction. Mechanistically, NDUFAB1 activation attenuates the cytotoxic effects of excessive NEFA exposure. These findings provide both fundamental insights into energy metabolism regulation and a potential therapeutic target (NDUFAB1) for preventing bovine metabolic diseases.

Keywords: NDUFAB1; NEFA; adipocyte; bovine; metabolic dysfunction.


Conflict of interest statement

The authors declare that the research was conducted in the absence of any commercial or financial relationships that could be construed as a potential conflict of interest.

Figures

Figure 1
Figure 1
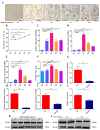
Effects of different treatment concentrations and times on adipocyte viability. Data are expressed as SEM ± mean. ** p < 0.01.
Figure 2
Figure 2
A high concentration of NEFA inhibits the adipocyte proliferation. (AC) Relative mRNA expression levels of CDK2, CDK4 and PCNA in adipocytes of NEFA-treated cows (0 mM, 0.2 mM, 0.4 mM, 0.6 mM) (n = 6). (D) EDU proliferation assay of adipocytes (0 mM, 0.2 mM, 0.4 mM, 0.6 mM) treated with NEFA. Red fluorescence represents EDU-positive cells and blue fluorescence represents DAPI-stained cells. (E) Percentage of EDU-positive cells. Rate of EDU-positive cells = EDU-positive cells/DAPI-stained cells × 100%. (n = 3). (FH) Relative protein expression levels of CDK4 and PCNA in adipocytes of NEFA-treated cows (0 mM, 0.2 mM, 0.4 mM, 0.6 mM) (n = 3). Data are expressed as SEM ± mean. * p < 0.05; ** p < 0.01, ns (no significance).
Figure 3
Figure 3
A high concentration of NEFA promotes adipocyte lipid deposition. (A,B) Oil red O staining of NEFA-treated lipid droplets and absorbance at 510 nm. (CE) Relative mRNA expression levels (0 mM, 0.2 mM, 0.4 mM, 0.6 mM) of ACACA, FASN, and SCD1 in adipocytes. (n = 6). (FG) Relative protein expression levels of SCD1 (0 mM, 0.2 mM, 0.4 mM, 0.6 mM) in adipocytes. (n = 3). (H) TG content after NEFA treatment. Data are expressed as SEM ± mean. * p < 0.05; ** p < 0.01, ns (no significance).
Figure 4
Figure 4
Construction of a differentiation model and inhibition of adipocyte differentiation by optimal concentration of NEFA. (A,B) Oil red O staining of lipid droplets at 0, 2, 4, 6 and 8 d of differentiation and absorbance at 510 nm. (CE) Relative mRNA expression levels of PPARG, CEBPA and FABP4 during adipocyte differentiation in dairy cows (n = 6). (FK) Relative protein expression levels of PPAR during adipocyte differentiation in dairy cows (n = 3). (GI) Relative mRNA expression levels of PPARG, CEBPA and FABP4 in cow adipocytes treated with 0.6 mM NEFA at d 4 of differentiation (n = 6). (JL) Relative protein expression levels of PPARG in adipocytes from cows treated with 0.6 mM NEFA at 4 d of differentiation (n = 3). Data are expressed as SEM ± mean. ** p < 0.01, ns (no significance).
Figure 5
Figure 5
Analysis of differentially expressed genes. (A) Volcano plot of differentially expressed genes between control (CON group) and 0.6 mM NEFA-treated group. (B) Correlation heatmap of differentially expressed genes between control (CON group) and 0.6 mM NEFA treatment group. (C,D) Heatmaps of differentially expressed genes between the control group (CON group) and the 0.6 mM NEFA-treated group with principal component analysis. (E,F) RT-qPCR validation of 10 differentially expressed genes. (G) Bar graph of GO enrichment of differential genes between control (CON group) and 0.6 mM NEFA-treated group. Data are expressed as SEM ± mean. ** p < 0.01.
Figure 6
Figure 6
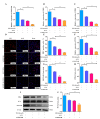
Interference with NDUFAB1 and NEFA co-treatment inhibits adipocyte proliferation. (AC,F) Relative mRNA expression levels of NDUFAB1, CDK2, CDK4 and PCNA in cow adipocytes after transfection of Si-NC with si-NDUFAB1 and co-treatment (n = 6). (D) EDU proliferation assay after transfection of Si-NC with Si-NDUFAB1 and co-treatment. Red fluorescence represents EDU-positive cells and blue fluorescence represents DAPI-stained cells. (E) Percentage of EDU-positive cells after transfection of Si-NC with Si-NDUFAB1 and after co-treatment. Rate of EDU-positive cells = EDU-positive cells/DAPI-stained cells × 100%. (n = 3). (GJ) Relative protein expression levels of NDUFAB1, CDK4, and PCNA in adipocytes from cows after transfection of Si-NC with si-NDUFAB1 and co-treatment (n = 3). Data are expressed as SEM ± mean. * p < 0.05; ** p < 0.01.
Figure 7
Figure 7
Interference with NDUFAB1 and NEFA co-treatment promotes lipid deposition. (A,B) Oil red O staining and absorbance at 510 nm of lipid droplets after transfection of Si-NC with Si-NDUFAB1 and co-treatment. (CE) Relative mRNA expression levels of ACACA, FASN and SCD1 in cow adipocytes after transfection of Si-NC with Si-NDUFAB1 and co-treatment (n = 6). (FG) Relative protein expression levels of SCD1 in adipocytes of cows transfected with Si-NC versus Si-NDUFAB1 and after co-treatment (n = 3). Data are expressed as SEM ± mean. * p < 0.05; ** p < 0.01.
Figure 8
Figure 8
Interference with NDUFAB1 and NEFA co-treatment inhibits adipocyte differentiation. (AD) Relative mRNA expression levels of NDUFAB1, PPARG, CEBPA, and FABP4 in adipocytes of cows transfected with Si-NC versus Si-NDUFAB1 and after co-treatment (n = 6). (EG) Relative protein expression levels of NDUFAB1 and PPARG in adipocytes of cows transfected with Si-NC versus Si-NDUFAB1 and after co-treatment (n = 3). Data are expressed as SEM ± mean. * p < 0.05; ** p < 0.01, ns (no significance).

References

    1. Melendez P., Serrano M.V. Update on ketosis in dairy cattle with major emphasis on subclinical ketosis and abdominal adiposity. Vet. Med. Sci. 2024;10:e1525. doi: 10.1002/vms3.1525. - DOI - PMC - PubMed
    1. Zhu Y., Liu G., Du X., Shi Z., Jin M., Sha X., Li X., Wang Z., Li X. Expression patterns of hepatic genes involved in lipid metabolism in cows with subclinical or clinical ketosis. J. Dairy Sci. 2019;102:1725–1735. doi: 10.3168/jds.2018-14965. - DOI - PubMed
    1. Vanacker N., Blouin R., Ster C., Lacasse P. Effect of different fatty acids on the proliferation and cytokine production of dairy cow peripheral blood mononuclear cells. J. Dairy Sci. 2022;105:3508–3517. doi: 10.3168/jds.2021-21296. - DOI - PubMed
    1. Fan X., Xu J., Hu Y., Wang K., Zhao Y., Cai J., Zhang X., Pan B., Xu A., Chen Y., et al. Effect of high NEFA concentration on lipid metabolism disorders in hepatocytes based on lipidomics. Front. Pharmacol. 2024;15:1372296. doi: 10.3389/fphar.2024.1372296. - DOI - PMC - PubMed
    1. Pathmaperuma A.N., Mana P., Cheung S.N., Kugathas K., Josiah A., Koina M.E., Broomfield A., Delghingaro-Augusto V., Ellwood D.A., Dahlstrom J.E., et al. Fatty acids alter glycerolipid metabolism and induce lipid droplet formation, syncytialisation and cytokine production in human trophoblasts with minimal glucose effect or interaction. Placenta. 2010;31:230–239. doi: 10.1016/j.placenta.2009.12.013. - DOI - PubMed

LinkOut - more resources