. 2025 Jul 9;15(7):jkaf079.
doi: 10.1093/g3journal/jkaf079.

Targeted single cell expression profiling identifies integrators of sleep and metabolic state

Affiliations

Targeted single cell expression profiling identifies integrators of sleep and metabolic state

Meng-Fu M Shih et al. G3 (Bethesda). .

Abstract

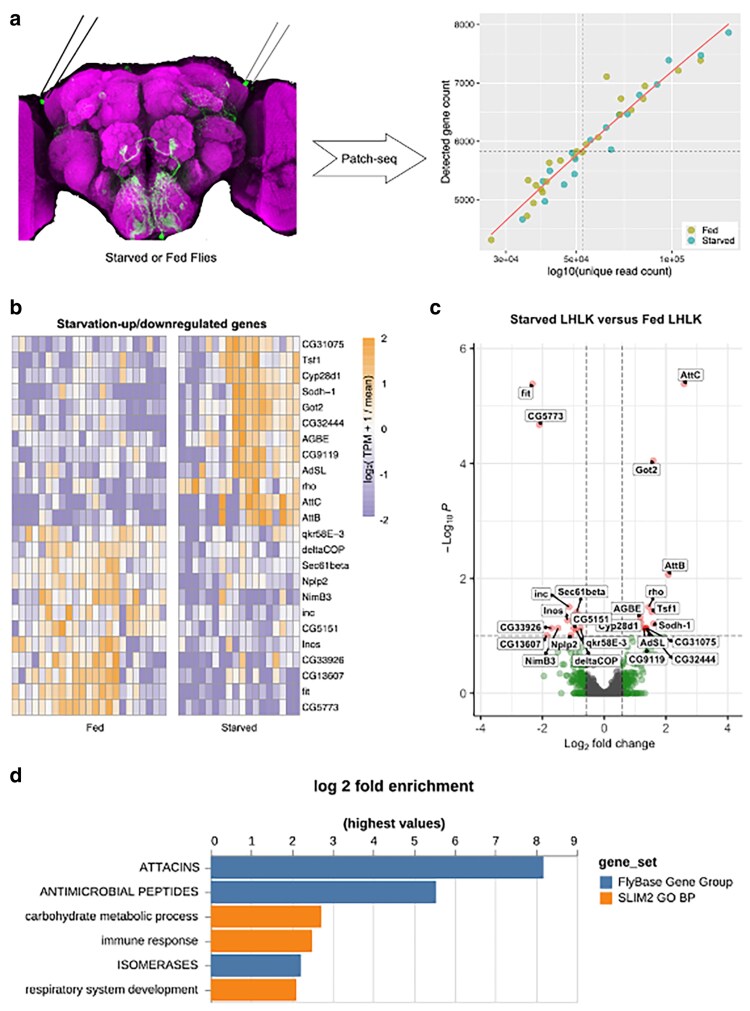
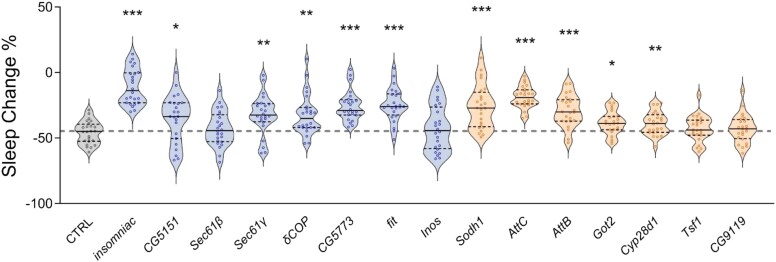
Animals modulate sleep in accordance with their internal and external environments. Metabolic cues are particularly potent regulators of sleep, allowing animals to alter their sleep timing and amount depending on food availability and foraging duration. The fruit fly, Drosophila melanogaster, suppresses sleep in response to acute food deprivation, presumably to forage for food. This process is dependent on a single pair of Lateral Horn Leucokinin (LHLK) neurons, that secrete the neuropeptide Leucokinin. These neurons signal to insulin producing cells and suppress sleep under periods of starvation. The identification of individual neurons that modulate sleep-metabolism interactions provides the opportunity to examine the cellular changes associated with sleep modulation. Here, we use single-cell sequencing of LHLK neurons to examine the transcriptional responses to starvation. We validate that a targeted single-cell sequencing approach selectively isolates RNA from individual LHLK neurons. Single-cell CEL-Seq comparisons of LHLK neurons between fed and 24-h starved flies identified 24 genes that are differentially expressed in accordance with starvation state. In total, 12 upregulated genes and 12 downregulated genes were identified. Gene-ontology analysis showed an enrichment for Attacins, a family of antimicrobial peptides, along with a number of transcripts with diverse roles in regulating cellular function. Targeted knockdown of differentially expressed genes identified multiple genes that function within LHLK neurons to regulate sleep-metabolism interactions. Functionally validated genes include an essential role for the E3 ubiquitin ligase insomniac, the sorbitol dehydrogenase Sodh1, as well as AttacinC and AttacinB in starvation-induced sleep suppression. Taken together, these findings provide a pipeline for identifying novel regulators of sleep-metabolism interactions within individual neurons.

Keywords: feeding; metabolism; single-cell profiling; sleep.


Conflict of interest statement

Conflicts of interest: The author(s) declare no conflict of interest.

Figures

Fig. 1.
Fig. 1.
Single-cell transcriptome analysis of LHLK neurons via targeted single cell sequencing. a) A fly tethered on a custom fly stage underwent microdissection to have a window of dorsal head cuticle removed (gray shadow) and then was mounted on a rig. b) Fluorescence imaging through the cuticle window allowed visualization of the GFP labeled LHLK neurons, which were then sucked into the glass electrode. c) Quantitative reserve transcription PCR (qRT-PCR) was used to measure cycle threshold (Ct) values for Lk or GFP, together with the housekeeping gene Act5c in 10 single LHLK neurons. The control gene Act5c is always detected across all the single LHLK neurons bilaterally [left (L) or right (R) hemisphere (Hemi)] from 7 flies (Fly_ID) and their technical replicates. Lk gene is reliably detected except for being undetermined (Unde) in 1 sample or 2 technical replicates. GFP is reliably detected except for in 1 GFP technical replicate where it was undetermined. d) CEL-Seq2 protocol for library construction and sequencing allows routine detection of ∼6,000 unique transcripts per LHLK neuron. e) Fidelity of CEL-seq shown for marker gene expression from 23 different LHLK neurons. High (bright colors) expression seen for GFP, Lk, and the elav neuronal marker. By contrast, we do not detect the male-specific gene roX2 (mean 2.67 TPM; median 0 TPM) or detect weak signal of the glial repo marker (mean 24.67 TPM; median 22.47 TPM).
Fig. 2.
Fig. 2.
Transcriptional analysis of LHLK neurons reveals differentially expressed genes. a) 24-h of starvation (green) vs feeding-control (yellow) was followed by Targeted single cell sequencing profiling. We generated the 2,000 most variably expressed genes in the differential expression analysis. Genes with an adjusted P value smaller than 0.1 are highlighted in red and labeled; genes with a fold change bigger than 1.5 are highlighted in green. d) GO analysis using PANGEA. 24 genes with a DE adjusted P value < 0.1 were used for analysis against the GO subset SLIM2 GO BP (orange) and the gene group collection FlyBase Gene Group (dark blue). P-value filter of 0.1 was applied. Bar plot represents the log2 fold change of each gene set.
Fig. 3.
Fig. 3.
Transcriptional reduction of Sodh1 or attacins in LHLK neurons mitigates starvation-induced sleep suppression. a) Total sleep duration reveals that sleep in LHLK-GAL4 > Sodh1RNAi flies (black dots in light apricot shadow) does not differ from control flies using LHLK-GAL4 (dark cycles in light gray shadow) or RNAi line (dark cycles in light blue shadow) crossed to the wild-type genetic background (+) respectively under fed conditions (day 1, P = 0.2758), but is increased during the starved state (day 2). Two-way repeated-measures ANOVA: F(2, 138) = 10.49, P < 0.0001 and Tukey's multiple comparison tests: P < 0.0001. All columns mean ± SEM. N = 22–25 each group. Legend key applies to a–f). b) Sleep profile of hourly sleep averages over a 48 h experiment under fed and stared conditions. Gray box represents night phase. ZT denotes Zeitgeber time, where ZT 0–12 corresponds to lights-on, and ZT 12–24 lights off. Sleep is reduced on starvation day for all genotypes, but sleep suppression by food deprivation is alleviated in mutant fruit flies expressing Sohd1-RNAi in the LHLK neurons (light apricot) compared with GAL4 and RNAi controls (light gray and light blue respectively). c) Total sleep duration reveals that sleep in LHLK-GAL4 > AttCRNAi flies does not differ from controls under fed conditions (P = 0.3448), but is increased during the starved state. Two-way repeated-measures ANOVA: F(2, 138) = 16.54, P < 0.0001 and Tukey's multiple comparison tests: P < 0.0001. d) Sleep profile reveals that sleep in LHLK-GAL4 > AttCRNAi flies (light apricot) does not differ from controls under fed conditions, but is increased during the starved state. e) Total sleep duration did not differ between LHLK-GAL4 > AttBRNAi flies and controls under fed conditions (P = 0.7788), but sleep is induced during the starved state in mutant flies compared with 2 control groups. Two-way repeated-measures ANOVA: F(2, 138) = 8.908, P = 0.0002 with repeated measures and Tukey's multiple comparison tests: P = 0.0082. f) Daily sleep profile of hourly sleep averages in LHLK-GAL4 > AttBRNAi flies compared with controls. All data are mean ± SEM; *P < 0.05; **P < 0.01; ***P < 0.001.
Fig. 4.
Fig. 4.
Behavioral role for genes downregulated in LHLK neurons. For each RNAi line, sleep was measured for 24 h on food, followed by 24 h on agar for food deprivation. a) Sleep duration is reduced on food (P = 0.0190) and increased on agar in LHLK-GAL4 > insomniacRNAi flies (light apricot shadow) compared with LHLK-GAL4 controls (light gray shadow) or RNAi controls (light blue shadow), which crossed to the wild-type genetic background (+) respectively. Two-way repeated-measures ANOVA: F(2, 138) = 40.00, P < 0.0001 and Tukey's multiple comparison tests: P = 0.0045. All columns mean ± SEM. N = 22–25 each group. Legend key applies to a–h). b) Daily total sleep only decreased under fed condition, no significant change in starved state (P = 0.7356) for CG5151 knockdown flies compared with controls. Two-way repeated-measures ANOVA: F(2, 138) = 7.016, P = 0.0013 and Tukey's multiple comparison tests: P = 0.0045. c) Sleep was significantly increased in both fed and starved states (P = 0.0082, P = 0.0206 respectively) in LHLK-GAL4 > Sec61βRNAi flies compared with the corresponding controls under the same situation. Two-way repeated-measures ANOVA: F(2, 138) = 0.6659, P = 0.5155 and Tukey's multiple comparison tests: P < 0.0001. d–g) Sleep duration is normal on food, but significantly increased on agar compared with control flies in LHLK-GAL4 > Sec61γRNAi flies (d, 2-way ANOVA, F(2, 138) = 1.627, P = 0.2003, and P = 0.0008), LHLK-GAL4>δCOPRNAi flies (e, 2-way ANOVA, F(2, 138) = 1.715, P = 0.1838, and P = 0.0013), LHLK-GAL4> CG5773RNAi flies (f, 2-way ANOVA, F(2, 138) = 17.33, P < 0.0001, and P < 0.0001), and LHLK-GAL4 > fitRNAi flies (g, 2-way ANOVA, F(2, 138) = 17.17, P < 0.0001, and P < 0.0001). Data are mean ± SEM. *P < 0.05; **P < 0.01; ***P < 0.001.
Fig. 5.
Fig. 5.
Starvation-induced sleep loss is reduced by knockdown of multiple up-regulated or down-regulated candidates from starvation. Starvation-induced sleep suppression was calculated based on the percentage change in sleep between the fed and starved state. LHLK-GAL4/+ control flies (gray) suppressed sleep by 45–50% (gray dotted line). Of the transcriptionally downregulated genes (blue), starvation induced sleep loss was reduced in LHLK-GAL4 > insomniacRNAi (P < 0.001), LHLK-GAL4 > CG5151RNAi (P = 0.0142), LHLK-GAL4 > Sec61γRNAi (P = 0.0004), LHLK-GAL4>δCOPRNAi (P = 0.0007), and LHLK-GAL4 > fitRNAi (P < 0.0001) flies. Of the transcriptionally up-regulated genes (apricot), starvation-induced sleep suppression was reduced in LHLK-GAL4> Sodh1RNAi (P < 0.0001), LHLK-GAL4 > AttCRNAi (P < 0.0001), LHLK-GAL4 > AttBRNAi (P < 0.0001), LHLK-GAL4 > Got2RNAi (0.0063), and LHLK-GAL4 > Cyp28d1RNAi (P = 0.0101) flies. One-way ANOVA: F(15, 367) = 14.13, P < 0.0001 followed by Tukey's post hoc test. N = 24–25 per group. Data are mean ± SEM; *P < 0.05; **P < 0.01; ***P < 0.001.

Update of

References

    1. Allada R, Siegel JM. 2008. Unearthing the phylogenetic roots of sleep. Curr Biol. 18:R670–R679. doi: 10.1016/j.cub.2008.06.033. - DOI - PMC - PubMed
    1. Anders S, Pyl PT, Huber W. 2015. HTSeq–a python framework to work with high-throughput sequencing data. Bioinformatics (Oxford, England). 31(2):166–169. doi: 10.1093/bioinformatics/btu638. - DOI - PMC - PubMed
    1. Arble DM, Bass J, Behn CD, Butler MP, Challet E, Czeisler C, Depner CM, Elmquist J, Franken P, Grandner MA, et al. 2015. Impact of sleep and circadian disruption on energy balance and diabetes: a summary of workshop discussions. Sleep. 38(12):1849–1860. doi: 10.5665/sleep.5226. - DOI - PMC - PubMed
    1. Blighe K, Rana S, Lewis M. 2018. EnhancedVolcano: Publication-Ready Volcano Plots with Enhanced Colouring and Labeling.
    1. Brown EB, Shah KD, Faville R, Kottler B, Keene AC. 2019. Drosophila insulin-like peptide 2 mediates dietary regulation of sleep intensity. Plos Genet. doi: 10.1101/681551. - DOI - PMC - PubMed

LinkOut - more resources