. 2025 Sep;100(9):1486-1501.
doi: 10.1002/ajh.27736. Epub 2025 Jun 13.

Integrative Genomic and Transcriptomic Analysis Reveals Targetable Vulnerabilities in Angioimmunoblastic T-Cell Lymphoma

Affiliations

Integrative Genomic and Transcriptomic Analysis Reveals Targetable Vulnerabilities in Angioimmunoblastic T-Cell Lymphoma

Alyssa Bouska et al. Am J Hematol. 2025 Sep.

Abstract

Nodal follicular helper T-cell (T FH) lymphoma of the angioimmunoblastic (AITL) subtype has a dismal prognosis. Using whole-exome sequencing (n = 124), transcriptomic (n = 78), and methylation (n = 40) analysis, we identified recurrent mutations in known epigenetic drivers (TET2, DNMT3A, IDH2 R172 ) and novel ones (TET3, KMT2D). TET2, IDH2 R172 , DNMT3A co-mutated AITLs had poor prognosis (p < 0.0001). Genes regulating T-cell receptor (TCR) signaling (CD28, PLCG1, VAV1, FYN) or activation (RHOA G17V ) or regulators of the PI3K-pathway (PIK(3)C members, PTEN, PHLPP1, PHLPP2) were mutated. CD28 mutation/fusion was associated with poor prognosis (p = 0.02). WES of purified, neoplastic T-cell (CD3+PD1+) demonstrated high concordance with whole tumor biopsies and validated the presence of TET2 and DNMT3A in tumor and non-lymphoid cells, but other mutations (CD28, RHOA G17V , IDH2 R172 , PLCG1) in neoplastic cells. Integrated DNA-methylation and mRNA expression analysis revealed epigenetic alterations in genes regulating TCR, cytokines, PI3K-signaling, and apoptosis. RNA-seq analysis identified fusion transcripts regulating TCR-activation (8%), revealed a restricted TCR-repertoire (α = 87%, β = 72%), and showed the presence of Epstein-Barr virus transcriptome (73%). GEP demonstrated the association of B-cells or dendritic cells in the tumor milieu with prognosis (p < 0.01). RNA-seq and WES analysis of 12 AITL-patient-derived-xenografts (PDX) showed that bi-allelic TET2 and DNMT3A mutations or sub-clonal mutations (PLCG1, PHLPP2) propagated in sequential passages, and gene signatures related to T FH and T CM (central-memory) were well-maintained through passages. Gene expression signatures associated with late PDX passages (3rd-5th) were enriched with proliferation and metabolic reprogramming-related genes and predicted prognosis in an independent AITL series. Low PHLPP2 mRNA expression predicted poor prognosis (p = 0.05) and engineered PHLPP2 or TET2 loss in CD4+ T-cells showed enhanced PI(3)K activation, thus uncovering a therapeutic target for clinical trials.

Keywords: cancer genetics; genomics and transcriptomics; lymphomaangioimmunoblastic T‐cell lymphoma.


Conflict of interest statement

The authors declare no conflicts of interest.

Figures

FIGURE 1
FIGURE 1
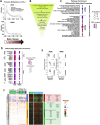
Mutations analysis in AITLs. (A) The oncoplot illustrates recurrent mutations identified through WES. The genes were selected by assessing their expression levels in normal T‐cells via RNA‐seq data, considering their functional relevance. Below, the chromosome‐5 copy number (CN) status, uniquely associated with AITLs, is presented and whether germline was also sequenced. The left oncoplot represents the 100 cases (of 119 sequenced) that had mutations in the depicted genes. The right oncoplot includes nine cases that were sorted for CD3+/PD1+ cells to enrich the tumor fraction. Four cases with WES sequencing on both the whole section and enriched tumor cells are noted. Lower panel: Plot of mutations that either co‐occur or are mutually exclusive using pairwise Fisher's exact tests for significance (p‐value). (B) Association of mutant genes in relation to the signaling transduction pathways. The mutated gene was placed within biological pathways using David.V6.7. A waterfall plot of the top three epigenetic mutations and significantly affected pathways are shown. On the left, the bubble plot illustrates the enrichment significance (p‐value) and number of genes within affected pathways. The three signaling pathways (i.e., Chemokine, RhoGTPases, and Ras in black box) were dominated by RHOA G17V (green color), however mutations in other genes in the pathways are colored blue. (C) Pairwise Fisher's exact tests were used to reveal correlation between epigenetic dysregulation (i.e., genes in black text) and other signaling pathways (red text) that demonstrate either co‐occurrence or mutual exclusivity. (D) Bar plot illustration of frequency of mutations in the genes/pathways in AITLs with RHOA G17V versus WT (Wild Type) cases. The asterisk indicates mutation with a significant difference between two groups (Fisher's exact test, p < 0.05). (E) Association of OS in AITLs carrying triple mutation (TET2, IDH2 R172 , DNMT3A) versus WT. Significantly inferior is associated with cases having triple mutations. [Color figure can be viewed at wileyonlinelibrary.com]
FIGURE 2
FIGURE 2
Transcriptomic and tumor microenvironment analysis in AITL. (A) Evaluation of pre‐defined AITL mRNA diagnostic signature (Iqbal et al., Blood 2014) utilizing RNA‐seq data of AITL versus other PTCLs (i.e., PTCL‐NOS, ALCL, ENKTCL, and γδ‐PTCL). The diagnostic signature is also assessed in normal T FH, naïve CD4+ T‐cells, and T‐effector cells. EBV transcript was identified from RNA‐seq data. Four PTCL‐NOS (now classified as n‐TFHLs) showed significant association with the AITL diagnostic signature and 3 of 4 showed IDH2R172 variant. These cases also have high expression of TFH specific genes, as noted in the heatmap. The lower section of the figure includes information on IDH2 mutations, EBV status, and the corresponding GEP data using HG‐U133plus2 platform. (B) Identification of in‐frame fusions in transcripts involved in the TCR signaling using RNA‐seq data utilizing fusion‐catcher. These fusions were also evaluated in normal T‐cells and not found. (C) Association CD28 genetic alterations (mutation/fusion) with OS demonstrate inferior OS associated with CD28 alterations. (D) Schematic of the FYN:TRAF3IP2 fusion identified by RNA‐seq and real‐time qPCR product of FYN‐TRAF3IP2 fusion (upper) or control primers (beta‐actin) in AITL cases. Fusion was verified by Sanger sequencing (see Figure S5E). (E) Assessment of T‐cell clonality using RNA‐seq data showed TCR‐α and TCR‐β clonal fraction in 87% of cases as indicated by Pie Chart. (F) Heatmap evaluating the dendritic‐cell mRNA signature (designated as (DC‐7, https://lymphochip.nih.gov/signaturedb/) and the B‐cell Expression Signature (https://lymphochip.nih.gov/signaturedb/, Newman A.M. et al., Nat. Methods 2015) in 78 AITLs. Mean expression levels of both signatures and the difference between the two are shown below the main heatmap. (G) Association of OS with the DC‐7 signature expression vs. B‐cell signature expression. The 78 AITL cases with RNA‐seq were divided into two halves (High DC‐7 vs. B‐cell signature and Low DC‐7 vs. B‐cell Signature) and OS assessed in the 60 cases with outcome data. AITL with higher DC‐7 vs. B‐cell mRNA signature are associated with poor prognosis (p = 0.0069). (H) Immunostains (×40) of CD20 and PD1 in a representative AITL case with high B‐cell content based on CIBERSORT (left) and low B‐cell content based on CIBERSORT (right). (I) Immunostains (×40) of myeloid markers CD68 and CD163 in a representative high DC‐7 and low DC‐7 case. (J) Association of DC‐7 mRNA signature with two representative IHC biomarkers (CD68 or CD163) quantified by QuPath software. A significant association with (CD163: R = 0.62, p = 0.016; CD68: R = 0.56, p = 0.0034) was observed. Correlation coefficients were calculated by spearman correlation and the dashed line represents the linear regression trendline. (K) Association of OS with EBV status assessed using RNA‐seq data. Significant association of EBV transcript with poor prognosis (p = 0.026) was noted in these cases. (L) CD20 IHC and EBER in situ hybridization (ISH) for one representative EBER‐positive (right) and one representative EBER‐negative (left) case. [Color figure can be viewed at wileyonlinelibrary.com]
FIGURE 3
FIGURE 3
Methylation analysis with AITLs. (A) Distribution of promoter methylation levels of all genes and TFH cell‐related gene sets in the AITL 450 K dataset (upper) and AITL RRBS dataset (lower). TFH‐expressed genes represent all genes that were expressed in the TFH cells (FPKM > 2). TFH‐up/down versus T‐effector or naïve T‐cells were differentially expressed genes between the TFH cells compared to T‐eff and naïve T cells. Beta‐values measure fractional methylation at CpG sites with 0 being fully unmethylated and 1 fully methylated. (B) Schematic of gene filtering strategy employed to identify disease‐relevant differentially methylated genes. (C) Enrichment analysis using concensus PathDB (http://cpdb.molgen.mpg.de/) of genes identified from Step 1 (B) whose promoter hypo‐ or hyper‐methylation status were consistent between platforms. (D) Selected genes whose promoter methylation levels were inversely correlated with mRNA expression and consistent between platforms that were identified from Step 2 of (B). (E) Inverse correlation between promoter methylation and mRNA expression for selected genes associated with T FH biology. Significant correlations (*p < 0.05, **p < 0.01) are marked with asterisks. (F) Genes with differentially methylated promoters (i.e., AITL vs. controls, lymph nodes, CD4+ T‐cells) that showed an inverse correlation with mRNA expression. Selected genes for analysis included genes significantly associated with AITL (i.e., differential mRNA expressed between AITLs vs. other PTCLs, Step 3 of B). [Color figure can be viewed at wileyonlinelibrary.com]
FIGURE 4
FIGURE 4
Molecular characterization of patient derived Xenograft (PDX) of AITLs. (A) H&E of mouse parenchymal organs (i.e., lung, liver, and spleens) from of NSG mouse implanted with a primary AITL biospecimen (second passage). Immunostains (×40) from spleens show that the majority of the tumors T‐cells have TFH immunophenotype (CD4+ PDL1+) demonstrating infiltration of neoplastic cells in these organs. (B) Variant allele frequencies (VAF) of recurrent AITL mutations detected in PDX models over passage time. The size of the bubble corresponds to the VAF of the mutation, indicating higher VAF in secondary passages. Time points that are not available for each case are denoted by a gray x. (C) Distribution of Cancer Cell Fraction (CCF) values for mutations across various clusters and sub‐clonal evolutions in a representative Patient‐Derived Xenograft (PDX) model. Similar clusters were utilized to calculate a potential phylogenetic tree from the CCF values recorded in the data matrix (left). Using Revolver [50], phylogenetic trees illustrating the clonal evolution of each variant were constructed (right). Circles in the trees represent clusters with and without driver gene mutations. “GL” denotes germline, C: Cluster, P: Primary; and T1, T2, T3, and T5 for Passages 1, 2, 3, and 5, respectively. (D) Evaluation of the previously defined AITL diagnostic signatures (mean expression levels) pan‐B and pan‐T‐cell signatures in the primary and secondary PDX passages demonstrating that neoplastic content is increasing, while TME is decreasing in secondary passages. (E) Cellular subset composition estimation of RNA‐seq data by CIBERSORT. The bar plot along the right represents the average proportion based on all samples in the time point. (F) Noted cell subsets estimated by CIBERSORT over passages. The dashed line in the plot represents a linear regression trendline. p‐values were calculated by Wilcoxon rank‐sum test. (G) Upregulated and downregulated genes observed in secondary passages over time (T1–T5). Pathways that are significantly affected by up‐ or down‐regulated genes are noted. (H) Pathway enrichment analysis of genes that were significantly up or down‐regulated over passage time. (I) Association of gene signatures identified in secondary PDX passages with OS in AITLs. Differential expression of signatures associated with late PDX passage (T5 vs. T1 or T3 vs. T1), upper left and right or T5 versus T1 or T3 versus T1 were evaluated in AITL cohort with GEP data. AITL cases were divided into the upper half and lower half based upon expression of the signature and associated with OS. Cases were also evaluated using TFH related genes only (i.e., genes differentially expressed between TFH and naïve T‐cells (lower left & right). [Color figure can be viewed at wileyonlinelibrary.com]
FIGURE 5
FIGURE 5
Abnormalities associated with PI3K activation in AITL. (A) The schematic of PI3K pathway and mutant genes identified by WES in this AITL study are indicated in red letters. (B) Schematics of PHLPP1 and PHLPP2 mutation spectrum in AITL. (C) Frequency of PHLPP1 and PHLPP2 DNA copy number loss in AITL compared to PTCL‐NOS and PTCL‐TFH. (D) Association of OS with mRNA expression level of PHLPP2 using two different platform (i.e., HG‐U133plus2 array [left panels] or RNA‐seq [right panels]) showing inferior OS associated with low PHLPP2 expression. (E) Western blot for indicated proteins (PHLPP2, AKT, FOXO1) in PHLPP2−/− CD4+ T‐cells showed down‐regulation of PHLPP2, but higher pAKT and pFOXO1 suggesting activation of AKT‐FOXO1 signaling. β‐actin was used as a control for protein lysate. (F) Cell proliferation curve of CD4+ T‐cells with/without PHLPP2 knock‐out cultured in standard culture conditions containing IL‐2, IL‐21, TH1 polarization conditions, or TH2 polarization conditions. Gold asterisk denotes significance for vector compared PHLPP2‐sg‐1 and green asterisks, vector compared to PHLPP2‐sg‐3 (p < 0.05*, p < 0.01**, p < 0.001***, p < 0.0001****). (G) H&E and ICOS IHC in a representative AITL case (×20), upper panel. Bar plot comparing the frequency of ICOS positivity in AITL, PTCL‐TFH, and PTCL‐NOS, lower panel. (H) Frequency of 2q33.2 CN gain encompassing ICOS gene in AITL and other PTCL using data previously published (Heavican et al., Blood 2019). (I) Western blot for TET2 expression in TET2 Knock‐out CD4+ T‐cells compared to WT cells confirms TET2 Knock‐out. (J) ICOS expression assessed by flow cytometry in WT and TET2 knock‐out CD4 T cells from three separate donors examined on the 10th day (10d) after the second (S2) or fifth (S5) round of α‐CD3/CD28 beads stimulation after TET2 knock‐out. *p < 0.05, t‐test. (K) Western blot examination of PI3K/AKT/mTOR signaling activation with 2 days α‐CD3/α‐ICOS stimulation in WT and TET2 knock‐out CD4 T cells. Densitometry values for the bands are denoted below and show values for a representative experiment of two independent experiments. [Color figure can be viewed at wileyonlinelibrary.com]

Similar articles

References

    1. Xu B. and Liu P., “No Survival Improvement for Patients With Angioimmunoblastic T‐Cell Lymphoma Over the Past Two Decades: A Population‐Based Study of 1207 Cases,” PLoS One 9, no. 3 (2014): e92585, 10.1371/journal.pone.0092585. - DOI - PMC - PubMed
    1. Mourad N., Mounier N., Briere J., et al., “Clinical, Biologic, and Pathologic Features in 157 Patients With Angioimmunoblastic T‐Cell Lymphoma Treated Within the Groupe D'etude Des Lymphomes de L'adulte (GELA) Trials,” Blood 111, no. 9 (2008): 4463–4470, 10.1182/blood-2007-08-105759. - DOI - PMC - PubMed
    1. de Leval L., Parrens M., Le Bras F., et al., “Angioimmunoblastic T‐Cell Lymphoma Is the Most Common T‐Cell Lymphoma in Two Distinct French Information Data Sets,” Haematologica 100, no. 9 (2015): e361–e364, 10.3324/haematol.2015.126300. - DOI - PMC - PubMed
    1. Ellin F., Landstrom J., Jerkeman M., and Relander T., “Real‐World Data on Prognostic Factors and Treatment in Peripheral T‐Cell Lymphomas: A Study From the Swedish Lymphoma Registry,” Blood 124, no. 10 (2014): 1570–1577, 10.1182/blood-2014-04-573089. - DOI - PubMed
    1. Petrich A. M., Helenowski I. B., Bryan L. J., Rozell S. A., Galamaga R., and Nabhan C., “Factors Predicting Survival in Peripheral T‐Cell Lymphoma in the USA: A Population‐Based Analysis of 8802 Patients in the Modern Era,” British Journal of Haematology 168, no. 5 (2015): 708–718, 10.1111/bjh.13202. - DOI - PubMed

MeSH terms