

Evolution of GC-biased gene conversion by natural selection
- PMID: 40510024
- PMCID: PMC12341927
- DOI: 10.1093/genetics/iyaf111
Evolution of GC-biased gene conversion by natural selection
Abstract
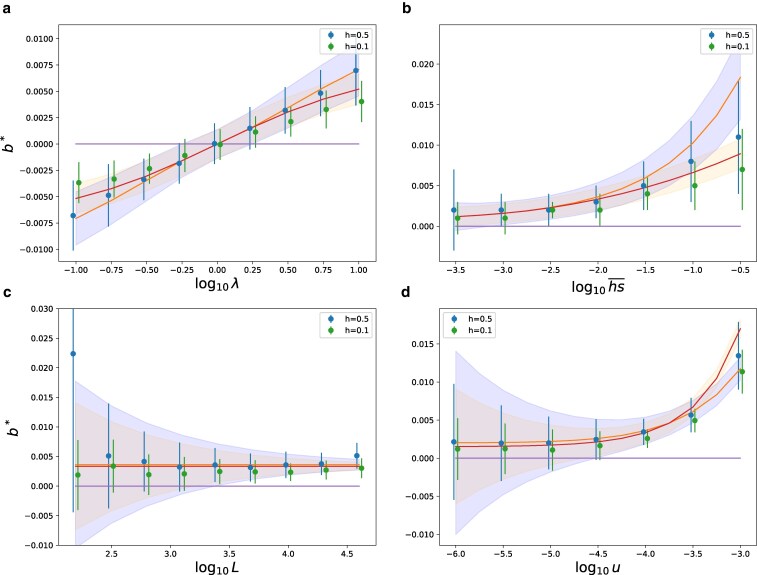
GC-biased gene conversion is a recombination-associated evolutionary process that biases the segregation ratio of AT:GC polymorphisms in the gametes of heterozygotes, in favor of GC alleles. This process is the major determinant of the variation in base composition across the human genome and can be the cause of a substantial burden of deleterious GC alleles. While the importance of GC-biased gene conversion in molecular evolution is increasingly recognized, the reasons for its existence and its variation in intensity between species remain largely unknown. Using simulations and semi-analytical approximations, we investigated the evolution of GC-biased gene conversion as a quantitative trait evolving by mutation, drift, and natural selection. We show that in a finite population in which most mutations are deleterious, GC-biased gene conversion is under weak stabilizing selection around a positive value that mainly depends on the intensity of the mutational bias and on the selective constraints exerted on the genome. Importantly, the levels of GC-biased gene conversion that evolve by natural selection do not minimize the load in the population and even increase it substantially in regions of high recombination rate. Therefore, even if they reduce the fitness of the population, the levels of GC-biased gene conversion currently observed in humans may, in fact, have been (weakly) positively selected.
Keywords: gBGC; genetic load; modifier; mutation bias; natural selection; recombination.
© The Author(s) 2025. Published by Oxford University Press on behalf of The Genetics Society of America.
Conflict of interest statement
Conflicts of interest: The author(s) declare no conflicts of interest.
Figures


Similar articles
-
Compensatory Evolution Following Deleterious Episodes of GC-biased Gene Conversion in Rodents.Mol Biol Evol. 2025 Jul 1;42(7):msaf168. doi: 10.1093/molbev/msaf168. Mol Biol Evol. 2025. PMID: 40629524 Free PMC article.
-
Signs and symptoms to determine if a patient presenting in primary care or hospital outpatient settings has COVID-19.Cochrane Database Syst Rev. 2022 May 20;5(5):CD013665. doi: 10.1002/14651858.CD013665.pub3. Cochrane Database Syst Rev. 2022. PMID: 35593186 Free PMC article.
-
[Volume and health outcomes: evidence from systematic reviews and from evaluation of Italian hospital data].Epidemiol Prev. 2013 Mar-Jun;37(2-3 Suppl 2):1-100. Epidemiol Prev. 2013. PMID: 23851286 Italian.
-
A cross-species analysis of neuroanatomical covariance sex differences in humans and mice.Biol Sex Differ. 2025 Jul 1;16(1):47. doi: 10.1186/s13293-025-00728-1. Biol Sex Differ. 2025. PMID: 40598550 Free PMC article.
-
The Black Book of Psychotropic Dosing and Monitoring.Psychopharmacol Bull. 2024 Jul 8;54(3):8-59. Psychopharmacol Bull. 2024. PMID: 38993656 Free PMC article. Review.
References
MeSH terms
Grants and funding
LinkOut - more resources
Full Text Sources
Miscellaneous
