. 2025 May 6;28(6):112595.
doi: 10.1016/j.isci.2025.112595. eCollection 2025 Jun 20.

Global analysis of excitotoxicity-induced alterations in RNA structure and RNA-protein binding in neurons

Affiliations

Global analysis of excitotoxicity-induced alterations in RNA structure and RNA-protein binding in neurons

Elena Alvarez-Periel et al. iScience. .

Abstract

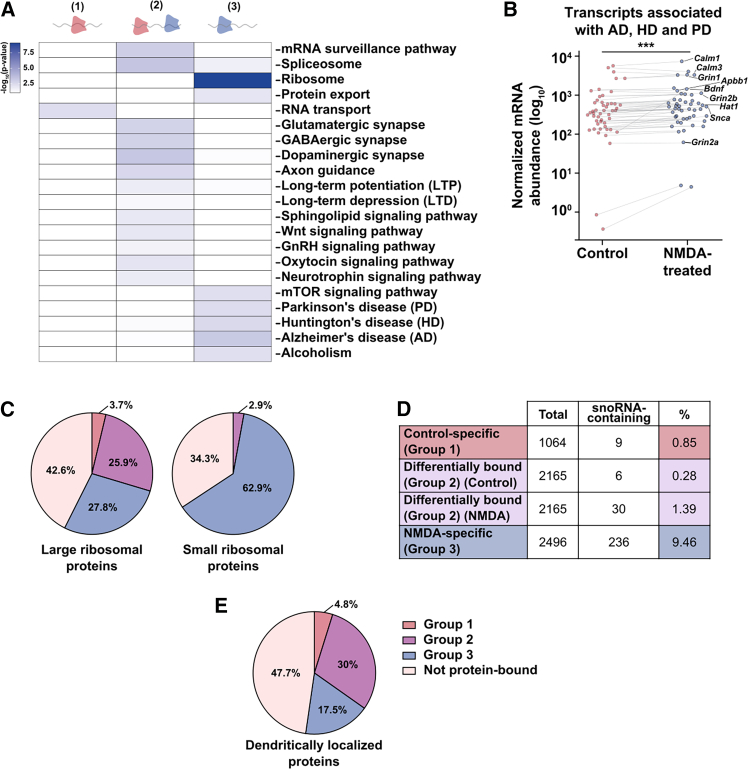
Excitotoxicity and altered RNA regulation by RNA-binding proteins (RBPs) are two prevalent hallmarks in multiple neurodegenerative disorders. However, global effects of excitotoxicity on RNA secondary structure and RNA-protein interactions are largely unknown. To address this, we have performed protein interaction profile sequencing (PIP-seq) in NMDA-treated primary neurons. Our results show that NMDA treatment alters RNA structure, which correlates, in opposite directions depending on the intragenic region, with changes in mRNA abundance. Moreover, NMDA treatment increases and alters RNA-protein binding sites defining subsets of transcripts functionally associated with synaptic functions and neurodegenerative disorders. Finally, we identify two RNA motifs enriched in protein binding after NMDA treatment, and several RBPs binding to them in vitro, including CELF6 and YBX3, which show NMDA-dependent changes in their protein levels. Overall, we provide extensive datasets that can be leveraged to bridge the mechanistic gap between two hallmarks of neurodegeneration: excitotoxicity and RNA regulation by RBPs.

Keywords: Molecular biology; Neuroscience.


Conflict of interest statement

The authors declare no competing interests.

Figures

None
Graphical abstract
Figure 1
Figure 1
PIP-Seq simultaneously detects RNA structure scores and RNA-protein binding density in primary cortical neurons revealing altered correlation of both parameters after NMDA treatment (A) Overview of PIP-Seq (Protein Interaction Profile Sequencing). Scheme of cortical neuronal primary cultures has been adapted from Servier Medical Art. (B and C) Average RBP binding (orange line) and structure scores (blue line) at each nucleotide +/− 200 nt of the annotated start and stop codon in control (B) and NMDA-treated (C) cultures for mRNAs expressed in both conditions. The tables represent Spearman’s rho correlations between RBP binding and structure scores in the indicated regions. PPSs identified in both biological replicates of control and NMDA-treated cultures were used to calculate RBP binding. Shading around the line indicates the SEM across all plotted transcripts. Gray boxes highlight the structural dips over the start and stop codon. N = 12,854 mRNAs. NS, and ∗∗∗ denote p-value >0.05, and <0.001, respectively, Spearman’s asymptotic t approximation. mRNA diagrams are representative and are not to scale.
Figure 2
Figure 2
NMDA treatment alters RNA structure scores which show differential correlation with mRNA abundance depending on the intragenic region examined (A) Average structure score in the +/− 200 nt of the annotated start and stop codon in control (red line) and NMDA-treated (blue line) cultures for protein-coding mRNAs expressed in both treatments. N = 12,854 mRNAs. Structure scores in the regions surrounding the start and stop codon are significantly different (Wilcoxon paired t-test, p-value <2.2 × 10⁻¹⁶). Shading around the line indicates the SEM across all plotted transcripts. Gray boxes highlight the structural dips over the start and stop codon. mRNA diagrams are representative and are not to scale. (B and C) Correlation between mRNA abundance (log10) and average RNA structure score across each whole transcript in control (B) and NMDA-treated (C) cultures. (D) Summary of R and p-value calculated from Pearson coefficient for each correlation as depicted in Figures 2B and 2C, (E and F, G–L) and Figures S4A and S4B. Significant values are represented in yellow (positive correlation) or in purple (negative correlation). (E–L) Correlation between mRNA abundance (log10) and average RNA structure score at the 5′UTR (E and F), CDS (G and H) and 3′UTR (J and K) in control (E, G, and J), and NMDA-treated (F, H, and K) cultures. Correlation between mRNA abundance fold change (log2[RPMNMDA/RPMcontrol]) and RNA structure score fold change (log2[NMDA/control]) at the CDS (I) and the 3′UTR (L) for transcripts expressed in both conditions. Plots were made using geom_hex in the ggplot2 packages in 50 bins. The color of each bin indicates the number of transcripts that fall within that range. Solid black line represents the linear regression of each plot.
Figure 3
Figure 3
NMDA treatment alters global RNA-protein binding in primary cortical neurons (A) RBP binding in the +/− 200 nt of the annotated start and stop codon for control-specific (red line), NMDA-specific (blue line) and common (yellow line) PPSs for protein-coding mRNAs expressed in both conditions. N = 12,854 mRNAs. Shading around the line indicates the SEM across all plotted transcripts. mRNA diagrams are representative and are not to scale. ∗∗∗ denote p-value <2.2 × 10⁻¹⁶ using a Wilcoxon unpaired t-test. (B) Venn diagram showing overlap between PPSs identified in both biological replicates in control (red) and NMDA-treated (blue) cultures. The intersection indicates PPSs that overlap by at least 1 nucleotide. (C) Distribution of control-specific, common, and NMDA-specific PPSs identified in each genic region within protein-coding mRNAs. (D) PPS enrichment in the 5′ UTR, CDS, 3′ UTR and intron for control-specific (red), common (yellow) and NMDA-specific (blue) PPSs. Log2 fold change is represented for relative number of bases within PPSs compared to the number of bases within the rat genome for each intragenic region. (E) Average GERP conservation scores from 103 mammals for control-specific, common and NMDA-specific PPSs (blue bars) and equal sized flanking regions (peach bars). Error bars indicate SEM. ∗, ∗∗∗ denote p-value <0.05 and <0.001 respectively, Kolmogorov-Smirnov test.
Figure 4
Figure 4
Transcripts differentially RBP-bound after NMDA treatment show higher number of PPSs and increased mRNA abundance (A) Diagram representing Group 1 (control-specific) (N = 1,064), Group 2 (differentially bound) (N = 2,165), and Group 3 (NMDA-specific) (N = 2,496) definitions based on PPSs distribution. (B) Intragenic distribution of PPSs within protein-coding transcripts for group 1, 2 and 3 transcripts. (C and D) Percentage of transcripts containing each stated number of PPSs per transcript in group 1 and group 3 (C) and in group 2 under control conditions and after NMDA treatment (D). Vertical dashed lines represent the mean number of PPSs in control (red) and after NMDA treatment (blue). (E) Normalized mRNA abundance in control (red) and NMDA-treated (blue) cultures calculated by DESeq2 for transcripts from Groups 1, 2, and 3. ∗∗∗ denotes p-value <0.001; Wilcoxon paired t-test.
Figure 5
Figure 5
Transcripts differentially RBP-bound after NMDA treatment are functionally associated to synaptic functions and neurodegenerative disorders (A) Gene ontology analysis of KEGG pathways using DAVID, for transcripts from Group 1, Group 2, and Group 3. Colors within each cell represents the calculated -log10(p-value). Heatmap is a representative image. (B) Normalized mRNA abundance (log10) in control (red) and NMDA-treated (blue) cultures calculated by DESeq2 for transcripts from Group 3 (NMDA-specific) which are classified in KEGG pathways for Alzheimer’s disease (AD), Parkinson’s disease (PD) and Huntington’s disease (HD). ∗∗∗ denotes p-value <0.001; Wilcoxon paired t-test. (C) Percentage of large and small ribosomal protein coding genes (as annotated in HGNC) within Groups 1, 2, and 3 or not presenting PPSs. (D) Percentage of transcripts within Groups 1, 2, and 3 with at least one PPS overlapping with an annotated snoRNA. (E) Percentage of dendritically localized transcripts (as described in Middleton et al.) within Groups 1, 2, and 3 or not presenting PPSs.
Figure 6
Figure 6
Identification of RNA motifs enriched in protein binding after NMDA treatment and of proteins binding to them in primary neurons (A) RNA motifs identified using MEME to be significantly enriched in PPSs at the 3′UTRs after NMDA treatment compared to a background of all 3′ UTR sequences in the Rnor_6.0 genome. p-value <1.8 × 10⁻³; Hypergeometric test. (B) Known RBPs motifs identified using TomTom with partial homology with Motif 1 and Motif 2. (C) Gene ontology analysis of KEGG pathways using DAVID, for transcripts containing Motif 1 or Motif 2. Colors within each cell represents the calculated -log10(p-value). (D and E) List of proteins identified by Mass Spec to bind only to Motif 1 or only to Motif 2 (D) or to both Motif 1 and to Motif 2 (E) and information on current existing literature on their role as RBPs and/or their involvement in neuronal functions or neurodegenerative disorders (full list of references and additional information can be found in Table S1).
Figure 7
Figure 7
CELF6 and YBX3 protein levels are altered in response to NMDA treatment (A and B) Representative western blots of protein samples obtained from DIV15 (A) or DIV21 (B) primary cortical neurons treated with NMDA 10μM for 4h or 24h. Histograms represent the mean ± SEM and are normalized to control levels. Actin was used as loading control. Statistical analysis was performed using one-way ANOVA with Fisher-LSD post hoc comparison. ∗ denotes p < 0.05, ∗∗p < 0.01, ∗∗∗p < 0.001, ∗∗∗∗p < 0.0001.

References

    1. Holt C.E., Schuman E.M. The central dogma decentralized: New perspectives on RNA function and local translation in neurons. Neuron. 2013;80:648–657. doi: 10.1016/j.neuron.2013.10.036. - DOI - PMC - PubMed
    1. Albihlal W.S., Gerber A.P. Unconventional RNA-binding proteins: an uncharted zone in RNA biology. FEBS Lett. 2018;592:2917–2931. doi: 10.1002/1873-3468.13161. - DOI - PubMed
    1. Nussbacher J.K., Tabet R., Yeo G.W., Lagier-Tourenne C. Disruption of RNA Metabolism in Neurological Diseases and Emerging Therapeutic Interventions. Neuron. 2019;102:294–320. doi: 10.1016/j.neuron.2019.03.014. - DOI - PMC - PubMed
    1. Chatterjee B., Shen C.K.J., Majumder P. RNA modifications and RNA metabolism in neurological disease pathogenesis. Int. J. Mol. Sci. 2021;22 doi: 10.3390/ijms222111870. - DOI - PMC - PubMed
    1. Landínez-Macías M., Urwyler O. The Fine Art of Writing a Message: RNA Metabolism in the Shaping and Remodeling of the Nervous System. Front. Mol. Neurosci. 2021;14 doi: 10.3389/fnmol.2021.755686. - DOI - PMC - PubMed

LinkOut - more resources