. 2025 May 29:16:1544973.
doi: 10.3389/fimmu.2025.1544973. eCollection 2025.

Chitinase-1 inhibition attenuates metabolic dysregulation and restores homeostasis in MASH animal models

Affiliations

Chitinase-1 inhibition attenuates metabolic dysregulation and restores homeostasis in MASH animal models

Katarzyna Drzewicka et al. Front Immunol. .

Erratum in

Abstract

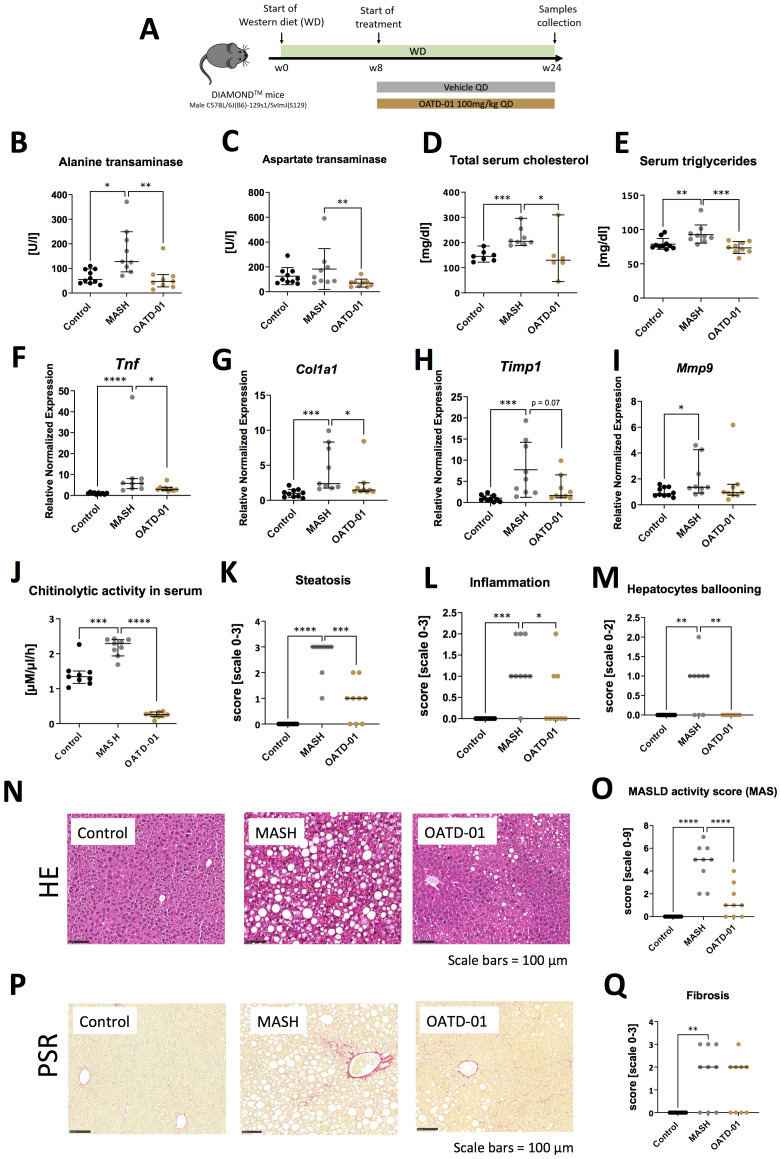
Background: OATD-01 is a chitinase-1 (CHIT1) inhibitor, reducing inflammation and fibrosis in animal models where chronic inflammation leads to tissue remodeling. CHIT1, predominantly secreted by macrophages, is overexpressed in metabolic dysfunction-associated steatohepatitis (MASH).

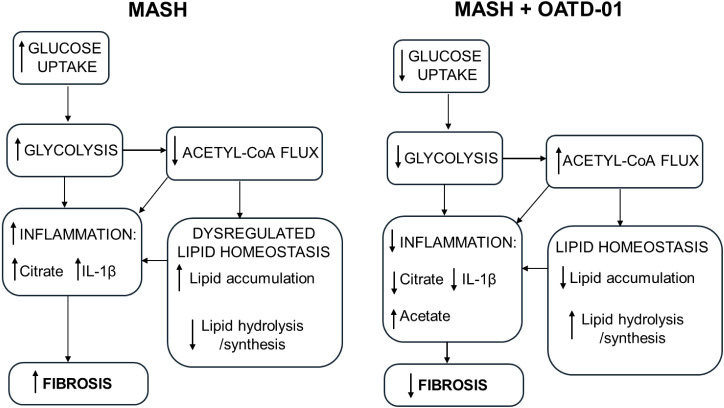
Methods and results: In the study, we demonstrated the therapeutic efficacy of OATD-01 in two murine models (STAM, DIAMOND) and one rat model (CDHFD) of MASH. RNA-Seq analysis of livers obtained from CDHFD rat model revealed that OATD-01 reversed MASH-dysregulated genes. In addition to reducing inflammation and fibrosis observed in the rat model, RNA-Seq demonstrated that OATD-01 regulated key metabolic processes such as acetyl-CoA metabolism, triglyceride metabolism, cholesterol synthesis, cholesterol flux, and glycolysis. Using functional assay performed on bone marrow-derived macrophages (BMDMs) we demonstrated that both genetic and pharmacological inactivation of CHIT1 resulted in inhibition of glucose uptake. As a consequence, our data suggest decreased glycolysis, accompanied by increased ATP levels, lower citrate, and increased acetate levels, ultimately leading to a reduced IL-1β secretion in BMDMs.

Conclusions: These results revealed the key role for CHIT1 in regulating metabolism. OATD-01 is a macrophage modulator that can directly restore metabolic balance and consequently inhibit inflammation and fibrosis, supporting its use for MASH treatment.

Keywords: MASH; OATD-01; chitinase 1; fibrosis; glycolysis; inflammation; macrophage; metabolism.


Conflict of interest statement

Authors KD, KG, MM, BH, IT, KP, MG, BD, TR, KL, AG, AM, and ZZ were employed by the company Molecure S.A. Author LO'N was a scientific advisor for the company Molecure S.A. The remaining authors declare that the research was conducted in the absence of any commercial or financial relationships that could be construed as a potential conflict of interest.​

Figures

Figure 1
Figure 1
OATD-01 reduces MASH features in a 6-week-long STAM model (high fat diet treated animals with destroyed pancreatic islet’s beta cells). Datasets were collected from three groups: non-disease (depicted as Control, black dots, n=10), STAM treated with vehicle (MASH, gray dots, n = 7), and treated with OATD-01 at 100 mg/kg QD for 4 weeks (OATD-01, blue dots, n = 8). Data points from all animals were included in the analysis. Statistical significance of differences between groups was tested between groups: Control vs MASH and MASH vs OATD-01 with unpaired t test or Mann-Whitney U test based on normality of the data points. Significance was depicted as *p < 0.05, **p < 0.01, ***p < 0.001, ****p < 0.0001. Scale bars reference for histological images are depicted below panels. (A) Scheme of the study. (B) Activity of chitinases in the serum. Data is presented as individual points with means and standard deviation. (C–F) Histopathological evaluation of MASH severity, according to the Kleiner system, in hematoxylin and eosin (HE) stained sections of livers from animals in the study: steatosis (C), lobular inflammation (D) and hepatocytes ballooning (E). These scores sum up to the MAS score (metabolic dysfunction-associated steatotic liver disease activity score) (G). Representative pictures of HE stained sections (F). Data is presented as individual points with medians. (H, I) Analysis of fibrosis burden in livers. Representative pictures of Picro-Sirius red-stained section of livers from experimental groups (H). In red – depositions of collagen I and III. On graph (I) computer-aided analysis of red-positive area in pictures taken from the specimens (n=5 fields/animal, 200x magnification), presented as percent of field-of-view covered by red collagen (performed with ImageJ). Data is presented as individual points with means and standard deviation. (J, K) Analysis of liver F4/80(+)-macrophages. Representative pictures of immunochemically (IHC) detected F4/80(+) cells in sections of livers from experimental groups (J). Graph (K) shows a computer-aided analysis of the brown-positive area in pictures taken from the specimens (n=5 fields/animal, 200x magnification). Data are presented as percent of field-of-view covered by positive signal (performed with ImageJ). Data presented as medians with 95% confidence interval.
Figure 2
Figure 2
OATD-01 reduces MASH features in a murine model of a high fat, high sugar, and high sucrose diet for 24 weeks (DIAMOND model). Datasets are collected from three groups: healthy animals (depicted as Control, black dots), diet-fed DIAMOND mice treated with vehicle (MASH, gray dots) or treated with OATD-01 at 100 mg/kg QD for 16 weeks (OATD-01, brown dots). Number of data points were: nControl =10, nMASH =9, nOATD-01 = 9 unless stated otherwise. Statistical significance of differences between groups was tested between groups: Control vs MASH and MASH vs OATD-01 with Mann-Whitney U test. Significance was depicted as: *p < 0.05, **p < 0.01, ***p < 0.001, ****p < 0.0001. Scale bars reference for histological images are depicted below panels. (A) Scheme of the study. (B–E) Measurements of liver-related markers in serum: activity of ALT (B) and AspAT (C), total cholesterol (D), triglycerides (E). In (D): nControl =7, nMASH =8, nOATD-01 = 6. Data are presented as individual points with a median depicted with a 95% confidence interval. (F–I) Expression of genes involved in the development and progression of MASH in liver tissue collected from animals in the study: Tnf (F), Col1a1 (G), Timp1 (H), Mmp9 (I). Datasets are normalized to the mean value from the control group. Data are presented as individual points with medians and 95% confidence interval. (J) Activity of chitinases in serum: nControl =9, nMASH =9, nOATD-01 = 9. Data are presented as individual points with medians and 95% confidence interval. (K–O) Histopathological evaluation of MASH severity, according to the Kleiner system, in hematoxylin and eosin (HE) stained sections of livers from animals in the study: steatosis (K), lobular inflammation (L) and hepatocytes ballooning (M). These scores sum up to the MAS score (O). Representative pictures of HE stained sections from control animals are shown on (N). Data are presented as individual points with medians. (P, Q) Analysis of fibrosis burden in livers. Representative pictures of PSR-stained section of livers from experimental groups (P). In red – depositions of collagen I and III. On graph (Q) analysis of the scoring of fibrosis acc. to Kleiner guidelines. Data are presented as individual points with medians.
Figure 3
Figure 3
OATD-01 reduces MASH symptoms in a 12-week-long, choline-deficient, high fat diet-induced (CDHFD) rat model of MASH. Datasets were collected from three groups: non-disease animals (depicted as Control, black dots), animals fed with the diet and treated with vehicle (MASH, gray dots), treated with AKL5i (1 mg/kg BID for 6 weeks, green dots) and administered with OATD-01 at 100 mg/kg BID for 6 weeks (OATD-01, purple dots). Number of data points were: nControl =10, nMASH =12, nALK5i=12, nOATD-01 = 12 unless stated otherwise. The statistical significance of differences between groups was evaluated separately for the Control and MASH groups using the Mann-Whitney test, whereas comparisons among the MASH vs ALK5i MASH vs OATD-01 groups were conducted using the Kruskal-Wallis test unless stated otherwise. Data presented as medians with 95% confidence interval unless stated otherwise. Significance was depicted as: *p < 0.05, **p < 0.01, ***p < 0.001, ****p < 0.0001. Scale bars reference for histological images are depicted in the panels below. (A) Scheme of the study. (B) Liver weight-to-body weight ratio in rats in the study. Number of data points were: nControl =10, nMASH =9, nALK5i=11, nOATD-01 = 11. (C) Aspartate transaminase (AspAT) activity in serum collected from experimental animals. (D–F) Measurements of ELF (Enhanced Liver Fibrosis) system parameters in serum of experimental animals: type III procollagen peptide (PIIINP)(D), TIMP-1 (E), hyaluronian (F): number of data points were: nControl =8, nMASH =9, nALK5i=11, nOATD-01 = 10. (G, H) Pharmacokinetic properties of OATD-01 in the model, assessed by measurements of compound concentration in serum on the 14th day of treatment (week 8 of the study) with OATD-01 at 100 mg/kg BID, at timepoints: pre-dose, 0.25, 1.5, 6 and 24 hours post-dosing (n=3, sequential blood collection). In plot (G) the measured total concentration is presented as a solid line; the dotted line represents the “free fraction” of the compound, recalculated by considering plasma protein binding. These animals did not receive the second dose of the compound that day. Summary of the calculated PK properties in table (H) Activity of chitinases in serum (I) and in liver homogenates (J) from animals in the study. (K, L) Analysis of fibrosis burden in livers from experimental animals. Representative pictures of the Picro-Sirius red (PSR) stained section are presented in (K). In red – depositions of collagen I and III. In graph (L) whole slide computer-aided analysis of the red-positive area is presented as the percent of the liver section covered by red collagen (performed with Visiopharm Image Analysis Software). (M, N) Analysis of inflammation in livers from experimental animals. Representative pictures of immunochemically (IHC) detected CD45(+) cells in the section are presented in (M). In graph (N) the whole slide computer-aided analysis of the brown-positive area is presented as a percent of the liver section covered by a positive signal (performed with Visiopharm Image Analysis Software). Based on the normality of the data, the t-test was used to compare Control vs MASH and one-way ordinary ANOVA to compare MASH vs ALK5i and MASH vs OATD-01. Data presented as means and standard deviations. (O, P) Analysis of CD68(+) macrophages infiltration of livers from experimental animals. Representative pictures of immunochemically (IHC) detected CD68(+) cells in the section are presented on (O). In graph (P) whole slide computer-aided analysis of the brown-positive area is presented as the percent of liver section covered by positive signal (performed with Visiopharm Image Analysis Software).
Figure 4
Figure 4
OATD-01 attenuates the gene expression of MASH biomarkers and mitigates changes in cellular composition caused by MASH. (A) Volcano plots of differentially expressed genes in the MASH group vs Control group (on the left) and in the MASH + OATD-01 vs MASH group (on the right) in the MASH rat study. Biomarkers related to human MASH study are labeled. (B) Heatmap of 20 orthologs of human MASH-related biomarkers expression comparison between the three groups. Each column represents a single individual, and each row represents a gene expression measured in a scaled VST metric, which indicates the direction of expression changes. (C) Selected cell type populations derived from RNA-seq deconvolution results obtained from the livers of control, MASH, and MASH+OATD-01 rats. The full RNA-seq deconvolution results are shown in Supplementary Figure 3 .
Figure 5
Figure 5
Clustering of GO biological processes from GSEA analysis shows that OATD-01 has a reversal effect, significantly influencing metabolism in the MASH rat study. (A, B) Clustered significantly changed processes in MASH vs Control (A) and MASH + OATD-01 vs MASH (B). NES describes the gene enrichment of the selected process in the gene ranking list concerning the permuted order of these genes. Here, the NES coefficient indicates the median NES of the cluster. Positive NES means that leading genes from the cluster are mostly upregulated, while negative NES indicates downregulation of the most leading genes from the cluster. Clustered processes related to lipid metabolism are bolded. (C) Heatmaps showing the expression of leading genes in clustered processes are highlighted in (A, B). Gene expression changes are presented using log2(FoldChange) and visualized through a color gradient where blue indicates strong downregulation, and red indicates strong upregulation.
Figure 6
Figure 6
OATD-01 inhibits glucose uptake in LPS-treated BMDMs. (A) Heatmaps displaying the expression of genes involved in glycolysis, altered in MASH (|log2(foldChange)| >1) and improved by OATD-01. Genes were retrieved from the KEGG database. Gene expression changes are presented using log2(FoldChange) and visualized through a color gradient where blue indicates strong downregulation, and red indicates strong upregulation. (B) Experimental protocol scheme for bone marrow-derived macrophages (BMDMs). BMDMs were derived from WT and CHIT1 KO mice. Upon collection of bone marrow cells, WT cells were treated with OATD-01 at two doses (1 µM and 10 µM) or with DMSO as a control during the differentiation period and polarization with LPS for 48h until material collection. Non-LPS treated cells were also prepared as a control of metabolic changes. (C) Assessment of glucose uptake with 2-NDB-labeled glucose (n=3 biological replicates) prepared as described in (B). Data presented in (C) are shown as means and standard deviation. The statistical test used in (C) is an unpaired t-test. Statistical significance between groups is indicated as follows: *p < 0.05, **p < 0.01, ***p < 0.001.
Figure 7
Figure 7
OATD-01 restores metabolic homeostasis in MASH condition. A comprehensive model of OATD-01 mechanism of action as a regulator of MASH-related metabolic pathways based on transcriptomic data from MASH rat study as well as metabolic characterization of OATD-01-treated macrophages. In the MASH condition, increased glucose uptake and glycolysis drive inflammation. There is reduced acetyl-CoA flux, leading to citrate accumulation and dysregulated lipid homeostasis, characterized by increased lipid accumulation and decreased lipid processing. This imbalance in lipids may also contribute to heightened inflammation. OATD-01 reverses these processes by directly targeting glycolysis, as observed in macrophages, resulting in decreased inflammation, improved lipid homeostasis and reduced fibrosis.

Similar articles

References

    1. Kopitz J. Lipid glycosylation: a primer for histochemists and cell biologists. Histochem Cell Biol. (2017) 147:175–98. doi: 10.1007/s00418-016-1518-4 - DOI - PubMed
    1. Reily C, Stewart TJ, Renfrow MB, Novak J. Glycosylation in health and disease. Nat Rev Nephrol. (2019) 15:346–66. doi: 10.1038/s41581-019-0129-4 - DOI - PMC - PubMed
    1. Sklepkiewicz P, Dymek B, Mlacki M, Zagozdzon A, Salamon M, Siwińska AM, et al. Inhibition of macrophage-specific CHIT1 as an approach to treat airway remodeling in severe asthma. Int J Mol Sci. (2023) 24. doi: 10.3390/ijms24054719 - DOI - PMC - PubMed
    1. Koralewski R, Dymek B, Mazur M, Sklepkiewicz P, Olejniczak S, Czestkowski W, et al. Discovery of OATD-01, a first-in-Class chitinase inhibitor as potential new therapeutics for idiopathic pulmonary fibrosis. J Medicinal Chem. (2020) 63:15527–40. doi: 10.1021/acs.jmedchem.0c01179 - DOI - PubMed
    1. Sklepkiewicz P, Dymek BA, Mlacki M, Koralewski R, Mazur M, Nejman-Gryz P, et al. Inhibition of CHIT1 as a novel therapeutic approach in idiopathic pulmonary fibrosis. Eur J Pharmacol. (2022) 919. doi: 10.1016/j.ejphar.2022.174792 - DOI - PubMed