. 2025 May 29:16:1585505.
doi: 10.3389/fimmu.2025.1585505. eCollection 2025.

Integrated multi-omics analysis and experimental investigation of mitochondrial dynamics-related genes: molecular subtypes, immune landscape, and prognostic implications in lung adenocarcinoma

Affiliations

Integrated multi-omics analysis and experimental investigation of mitochondrial dynamics-related genes: molecular subtypes, immune landscape, and prognostic implications in lung adenocarcinoma

Sixuan Wu et al. Front Immunol. .

Abstract

Background: Lung adenocarcinoma (LUAD) is a common and aggressive subtype of lung cancer associated with poor clinical outcomes. The role of mitochondrial dynamics (MD)-related genes in tumor progression and immune regulation remains poorly understood.

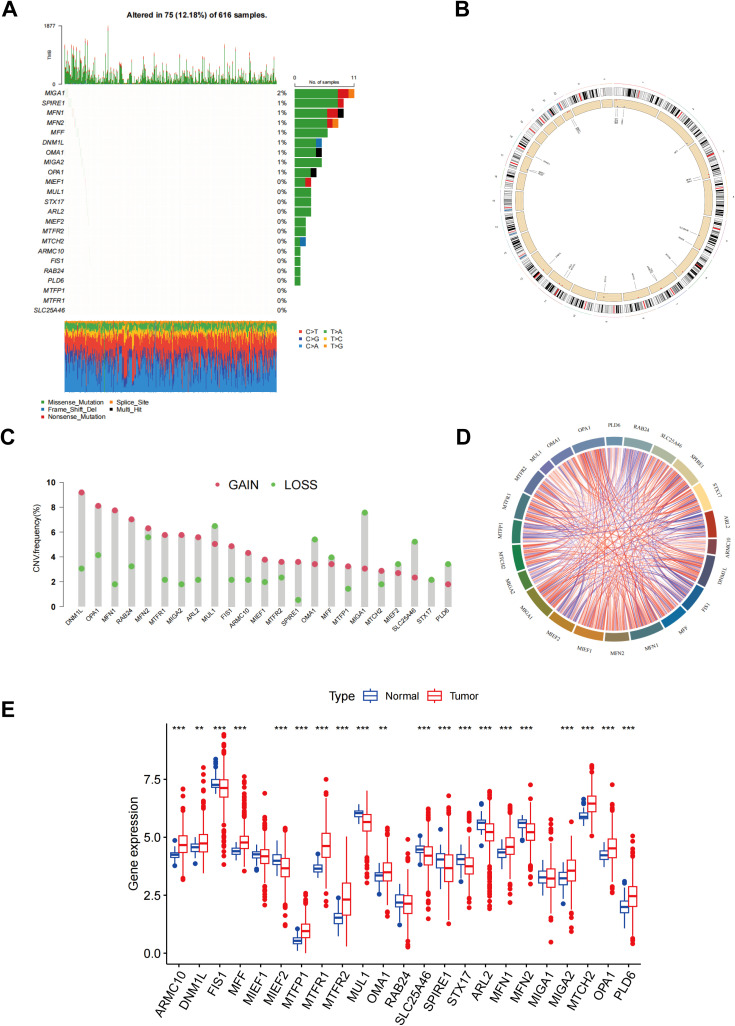
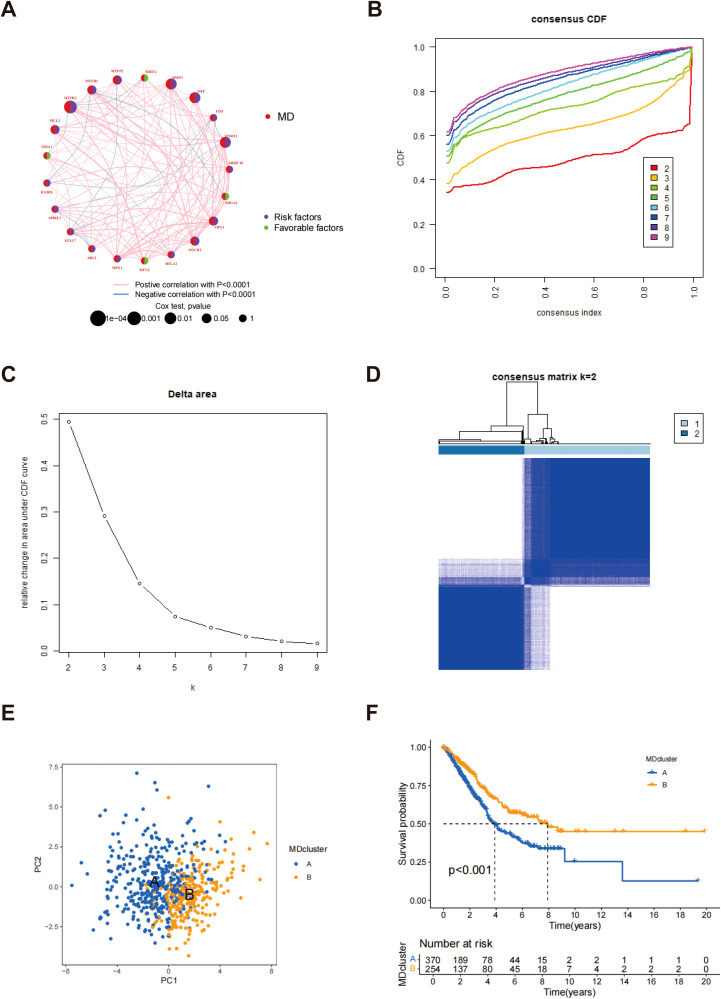
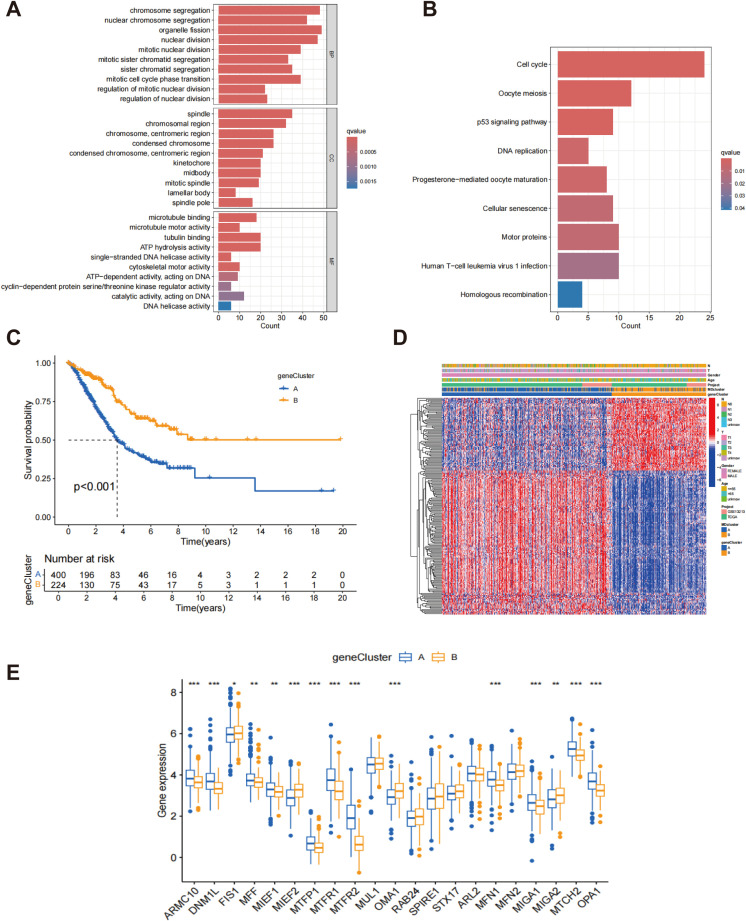
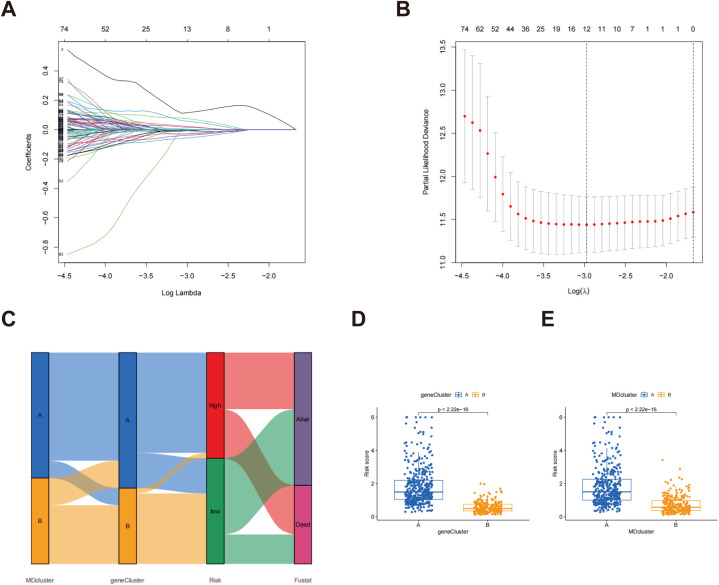
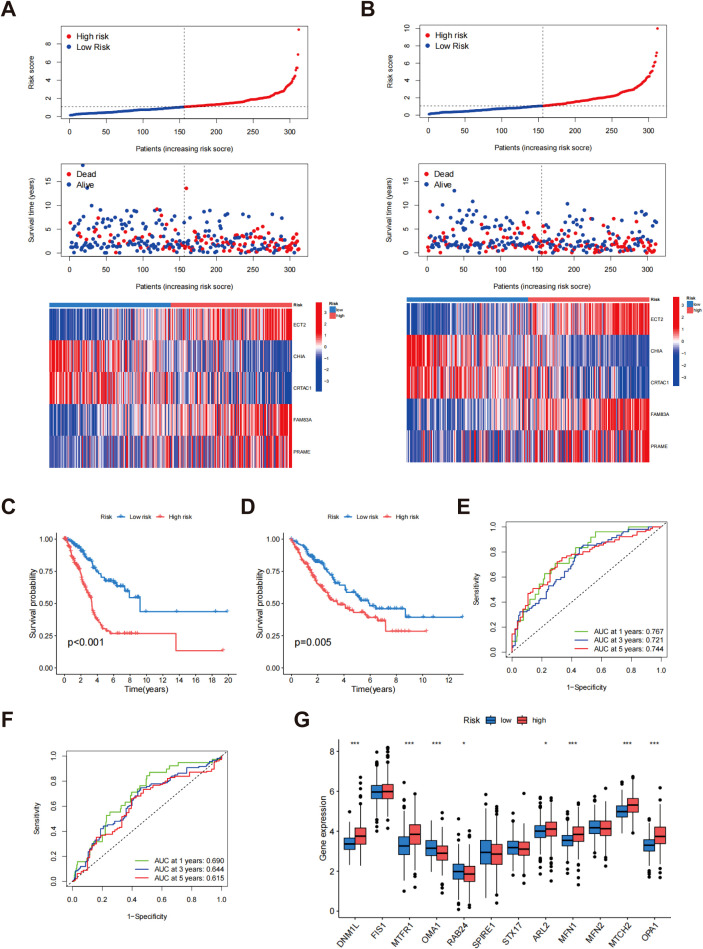
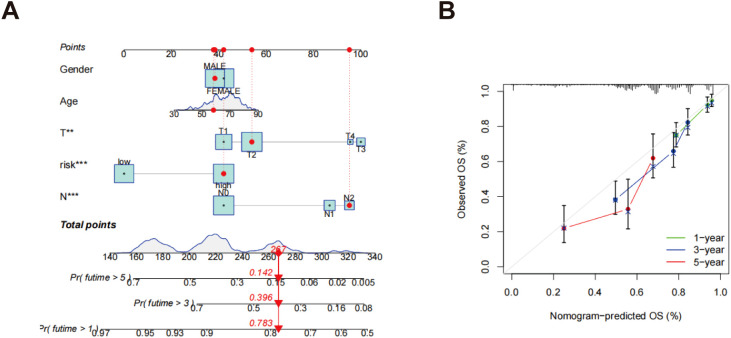
Methods: Data from public databases were integrated, and subtypes were classified based on 23 MD-related genes. A five-gene prognostic model was constructed. Associations between the model and immune infiltration, tumor mutational burden (TMB), tumor stemness, and drug sensitivity were analyzed. The function of the key gene MTCH2 was validated through in vitro experiments.

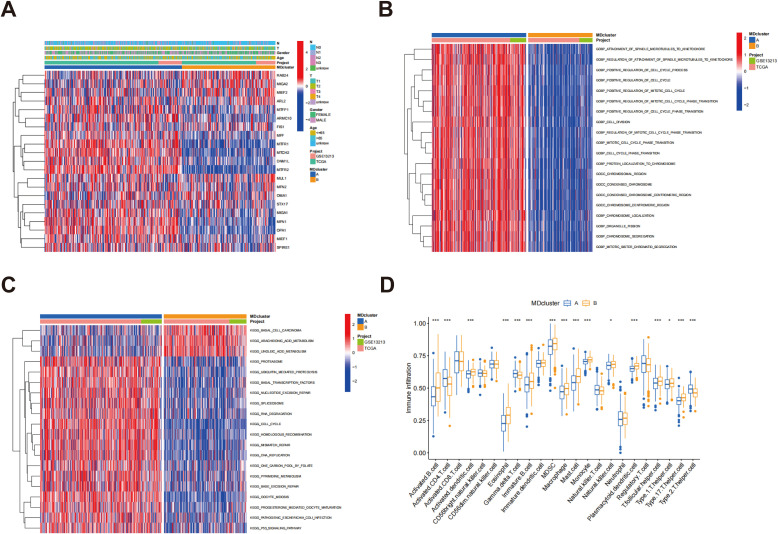
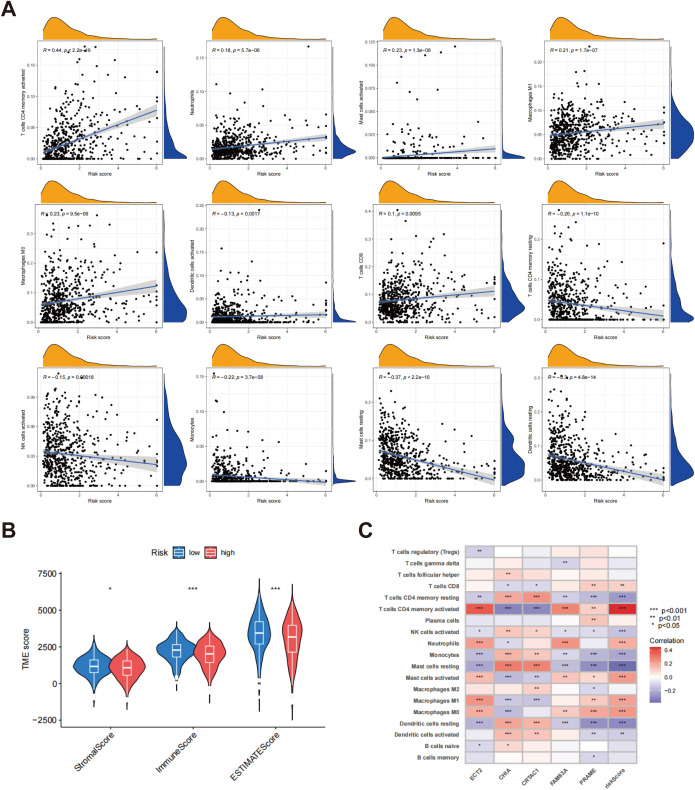
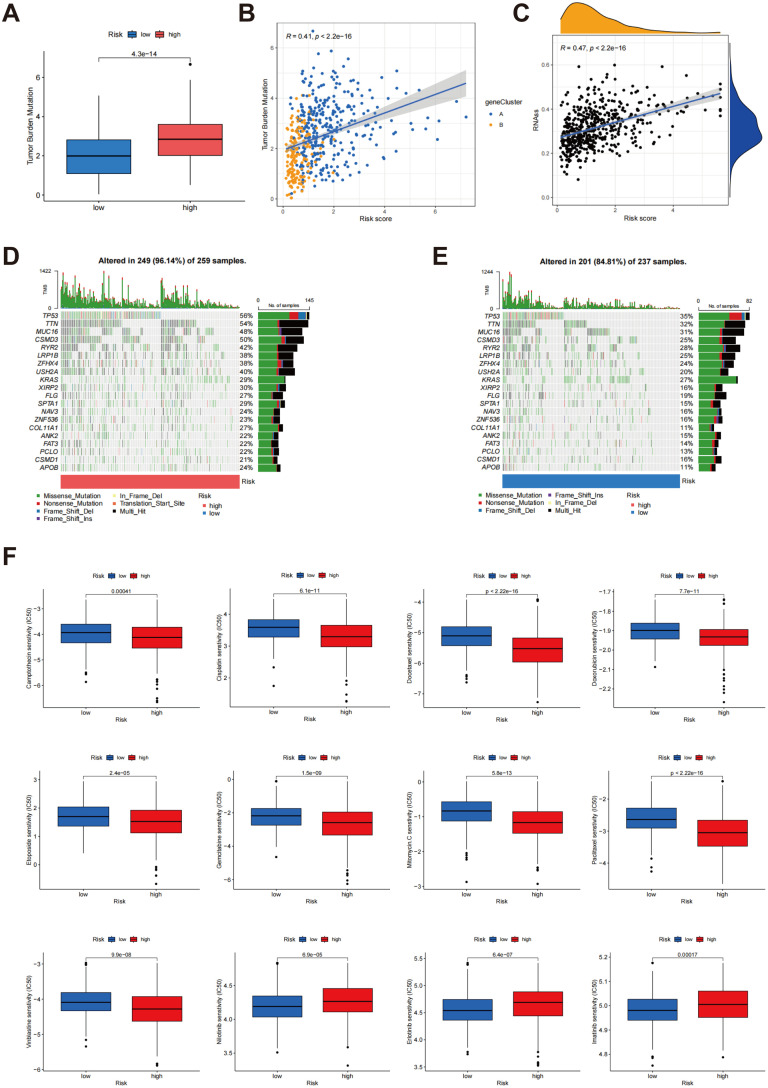
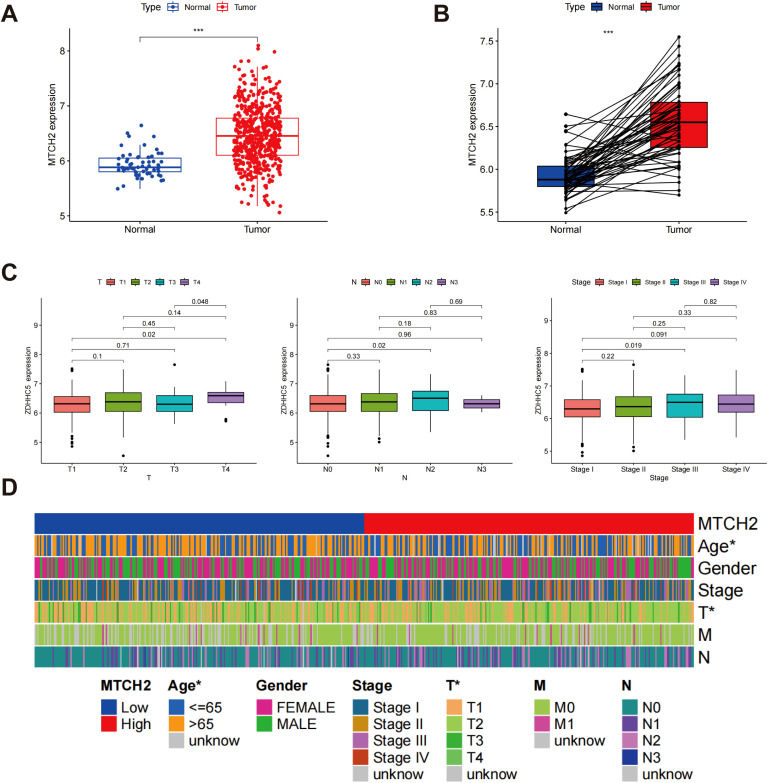
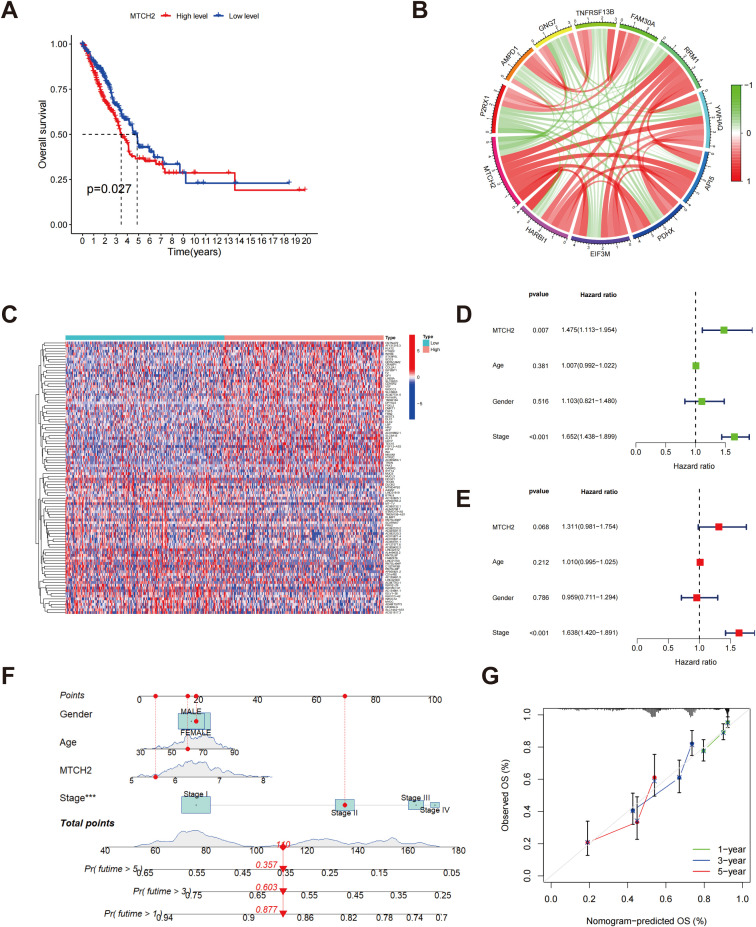
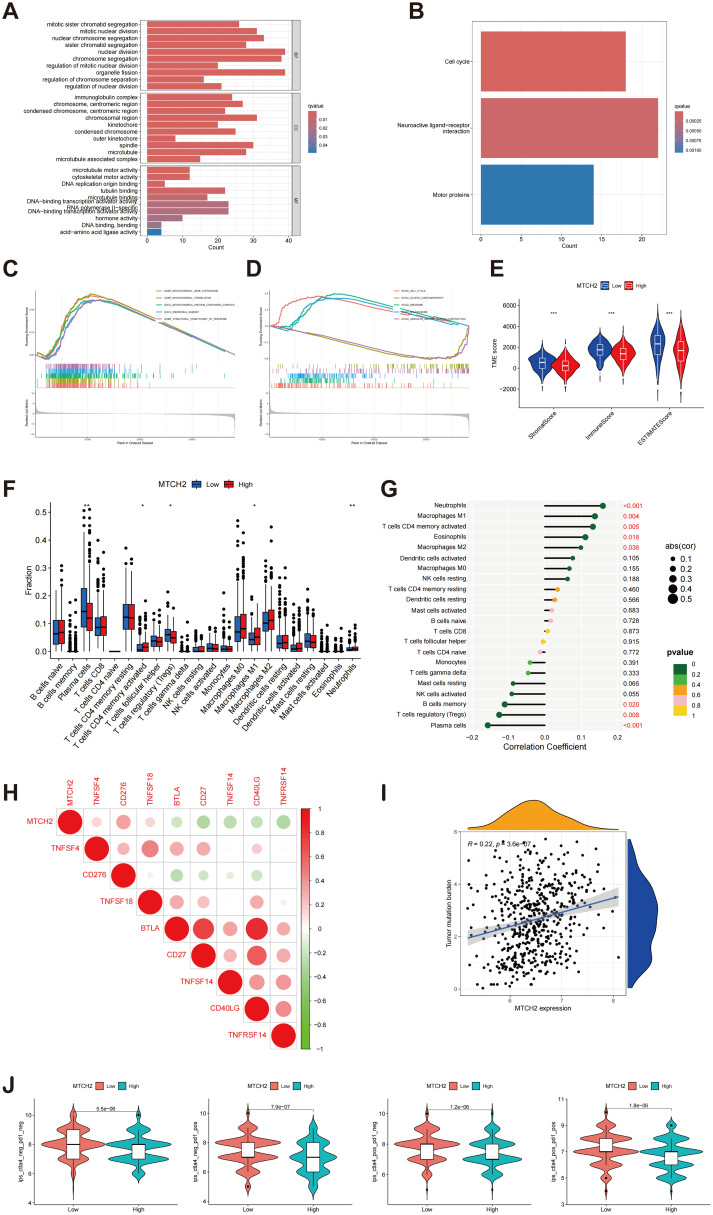
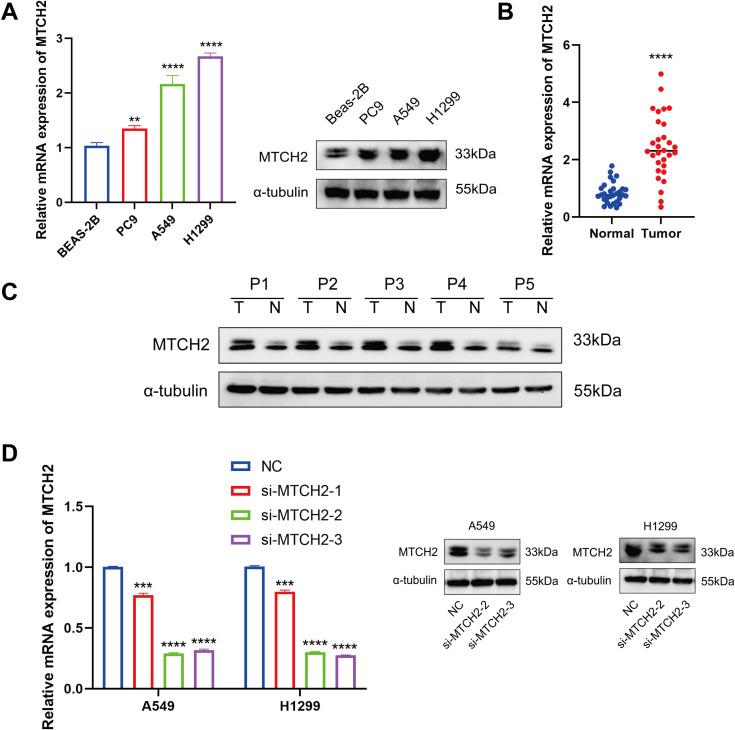
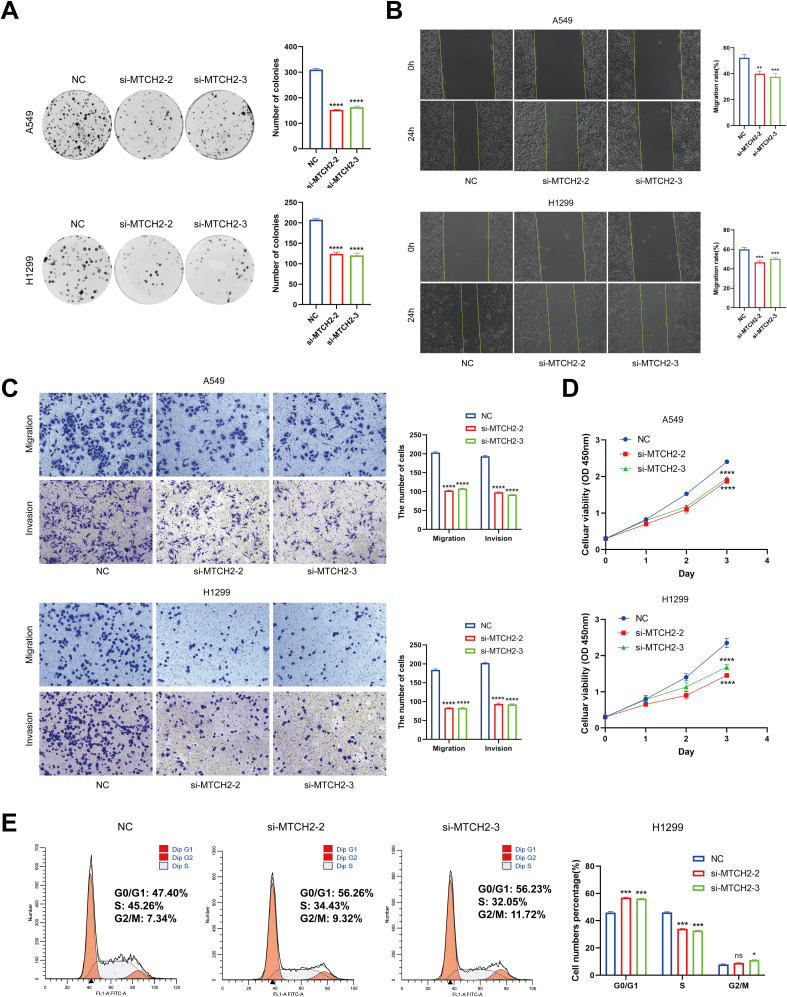
Results: Two distinct MD molecular subtypes were identified, exhibiting significant differences in prognosis and immune characteristics. A corresponding risk score model was established. Patients in the low-risk group showed better prognosis and enhanced immune activity, whereas the high-risk group displayed higher TMB and stemness scores. Drug sensitivity analysis revealed distinct responses to chemotherapeutic agents such as cisplatin and docetaxel between risk groups. Functional assays demonstrated that MTCH2 knockout significantly inhibited LUAD cell proliferation, migration, and invasion, and induced G0/G1 phase arrest, suggesting that MTCH2 may act as a potential adverse prognostic marker.

Conclusion: MD-related genes exhibit strong prognostic and immune subtyping value. The proposed risk model holds clinical potential, and MTCH2 may serve as a promising target for precision therapy in LUAD.

Keywords: LUAD; MTCH2; mitochondrial dynamics; prognostic model; tumor microenvironment.


Conflict of interest statement

The authors declare that the research was conducted in the absence of any commercial or financial relationships that could be construed as a potential conflict of interest.

Figures

Figure 1
Figure 1
Different mutations, CNV, and expression of MD genes. (A) The frequency of somatic mutations in genes related to MD; (B) The location of CNVs of MD genes; (C) The CNV frequency of MD genes; (D) An analysis of the correlation among the MD genes; (E) Result of MD genes expression in both normal and LUAD tissues. p** < 0.01; ***p < 0.001.
Figure 2
Figure 2
Confirmation of MD subtypes. (A) Network diagram of MD genes and their interactions; (B) Consensus CDF plot for different numbers of clusters; (C) Delta area representation illustrating the results of consensus clustering; (D) Consensus Matrix for k=2 clusters; (E) PCA of MD clusters; (F) Kaplan-Meier survival analysis for LUAD patients by MD clusters.
Figure 3
Figure 3
Enrichment analysis of MD subtypes and immune cell infiltration analysis. (A) Heatmap of mitochondrial dynamic gene expression in LUAD patients; (B) GSVA was conducted to assess the biological pathways across two distinct subtypes; (C) GSVA was utilized to evaluate the molecular functions between these two distinct subtypes; (D) An analysis was conducted to compare the infiltration of immune cells among the MD clusters. p* < 0.05; ***p < 0.001.
Figure 4
Figure 4
Classification of gene subtypes derived from DEGs. (A) Go enrichment analysis of DEGs associated with the subtypes of MD; (B) KEGG enrichment analysis of DEGs associated with MD subtypes; (C) Kaplan-Meier survival analysis of patients stratified by gene clusters A and B.; (D) Heatmap of two gene subtypes and associated clinical features; (E) Comparison of MD gene expression levels between gene clusters A and B. *p < 0.05; **p < 0.01; ***p < 0.001.
Figure 5
Figure 5
The LASSO regression and the creation of risk scores. (A) LASSO regression analysis for feature selection; (B) LASSO coefficient profiles; (C) Sankey diagram showing the relationships between MDcluster, genecluster, risk, and survival status; (D) Distribution of risk scores by genecluster; (E) Distribution of risk scores by MDcluster.
Figure 6
Figure 6
Evaluation of risk scores. The allocation of risk scores, survival outcomes, and prognostic gene expression levels within the training cohort (A) and testing cohort (B); Kaplan-Meier survival analysis for the training cohort (C) and testing cohort (D); ROC curves for the training cohort (E) and testing cohort (F, G) Assessment of MD gene expression levels contrasting low-risk and high-risk groups. p* < 0.05; ***p < 0.001.
Figure 7
Figure 7
Development of a nomogram. (A) A nomogram designed to forecast OS at the 1, 3, and 5-year marks; (B) Calibration curves associated with the nomogram that estimate OS. **p < 0.01; ***p < 0.001.
Figure 8
Figure 8
Assessment of TME in different risk scors. (A) Connections between immune cell types and risk scores; (B) A comparative assessment of TME scores was conducted between the groups identified as low risk and high risk; (C) Correlation heatmap between gene expression, risk score, and immune cell infiltration. *p < 0.05; p** < 0.01; ***p < 0.001.
Figure 9
Figure 9
Analysis of TMB, tumour stemness score and somatic mutation characteristics in different risk scores. (A) Comparison of TMB between groups classified as low risk and high risk; (B) Association between risk score and TMB; (C) Correlation between risk score and tumor stemness score; (D, E) Comparison of somatic mutation profiles between high-risk and low-risk cohorts; (F) Relationship between risk scores and drug sensitivity.
Figure 10
Figure 10
MTCH2 expression and clinical characterization in LUAD. (A) Comparison of MTCH2 expression in normal versus tumor tissues; (B) Comparative analysis of MTCH2 expression in matched normal and tumor tissue samples; (C) Association between MTCH2 expression levels and N stage, T stage and clinical stage; (D) Heatmap illustrating the distribution of MTCH2 expression levels and clinical characteristics, including gender, age, stage, T, M, and N classifications. *p < 0.05; ***p < 0.001.
Figure 11
Figure 11
Relationship between MTCH2 and prognosis. (A) The Kaplan-Meier survival analysis displays OS rates among patients categorized by high versus low MTCH2 expression levels; (B) Circos plot showing MTCH2 co-expression with the six most positively and five most negatively correlated genes; (C) A heatmap represents the top 50 DEGs identified in groups with high and low MTCH2 expression; (D) Univariate Cox regression forest plot for MTCH2 expression, age, gender, and stage; (E) Multivariate Cox regression forest plot for MTCH2 expression, gender, stage, and age; (F) Nomogram predicting 1-, 3-, and 5-year survival probabilities; (G) A calibration plot is included, which assesses the nomogram’s predictive accuracy for survival probabilities at the 1-, 3-, and 5-year marks. ***p < 0.001.
Figure 12
Figure 12
Enrichment analysis of MTCH2 DEGs and correlation of MTCH2 expression with immune infiltration. (A) GO enrichment analysis was conducted on DEGs; (B) Analysis of the KEGG pathways was performed on DEGs; (C–D) GSEA analysis of MTCH2 DEGs; (E) Comparison of stromal, immune, and ESTIMATE scores between high and low MTCH2 expression groups; (F) Distribution of 22 immune cell types between high and low MTCH2 expression groups; (G) Connection analysis between MTCH2 expression and various immune cell types; (H) Heatmap showing connection between MTCH2 expression and immune checkpoint genes; (I) Association between MTCH2 expression and TMB; (J) Connection between MTCH2 expression and immunotherapy. *p < 0.05; p** < 0.01; ***p < 0.001.
Figure 13
Figure 13
MTCH2 expression levels in normal and tumor cells and tissues, and the effect of siRNA knockdown of MTCH2. (A) Relative mRNA and protein expression levels of MTCH2 in normal lung cell line BEAS-2B compared to lung cancer cell lines PC9, A549, and H1299; (B) Comparison of MTCH2 mRNA expression in 30 paired normal and tumor LUAD tissues; (C) The protein expression of MTCH2 in matched normal (N) and tumor (T) samples obtained from five LUAD patients; (D) MTCH2 knockdown reduces mRNA and protein levels in A549 and H1299 cells. p** < 0.01; ***p < 0.001; ****p < 0.0001.
Figure 14
Figure 14
The Impact of MTCH2 knockdown on proliferation, invasion, migration, and cell cycle of LUAD cells. (A) Colony formation assay in H1299 and A549 cells after MTCH2 knockdown; (B) Wound healing assay in H1299 and A549 cells after MTCH2 knockdown. Scale bars, 200 µm; (C) Transwell migration and invasion assays in H1299 and A549 cells after MTCH2 knockdown. Scale bars, 200 µm; (D) CCK-8 assay in H1299 and A549 cells after MTCH2 knockdown; (E) Cell cycle analysis of H1299 cells following MTCH2 knockdown. *p < 0.05; p** < 0.01; ***p < 0.001; ****p < 0.0001.

Similar articles

References

    1. Tian H, Liu C, Yu J, Han J, Du J, Liang S, et al. Phf14 enhances DNA methylation of smad7 gene to promote tgf-B-driven lung adenocarcinoma metastasis. Cell Discov. (2023) 9:41. doi: 10.1038/s41421-023-00528-0 - DOI - PMC - PubMed
    1. Wang SQ, Chen JJ, Jiang Y, Lei ZN, Ruan YC, Pan Y, et al. Targeting gstp1 as therapeutic strategy against lung adenocarcinoma stemness and resistance to tyrosine kinase inhibitors. Adv Sci (Weinh). (2023) 10:e2205262. doi: 10.1002/advs.202205262 - DOI - PMC - PubMed
    1. Kishikawa S, Hayashi T, Saito T, Takamochi K, Sasa K, Suehara Y, et al. Distinct properties of pure- and mixed-type high-grade fetal lung adenocarcinomas by genetic profiling and transcription factor expression. Virchows Arch. (2022) 480:609–19. doi: 10.1007/s00428-021-03247-7 - DOI - PubMed
    1. Yu Z, Tang H, Chen S, Xie Y, Shi L, Xia S, et al. Exosomal loc85009 inhibits docetaxel resistance in lung adenocarcinoma through regulating atg5-induced autophagy. Drug Resist Update. (2023) 67:100915. doi: 10.1016/j.drup.2022.100915 - DOI - PubMed
    1. Li H, Zhang H, Huang G, Bing Z, Xu D, Liu J, et al. Loss of rps27a expression regulates the cell cycle, apoptosis, and proliferation via the rpl11-mdm2-P53 pathway in lung adenocarcinoma cells. J Exp Clin Cancer Res. (2022) 41:33. doi: 10.1186/s13046-021-02230-z - DOI - PMC - PubMed

MeSH terms

Substances

LinkOut - more resources