Dynamic alterations of circulating lymphocytes during the trajectory of Hantaan virus-induced hemorrhagic fever with renal syndrome
- PMID: 40510360
- PMCID: PMC12159035
- DOI: 10.3389/fimmu.2025.1567306
Dynamic alterations of circulating lymphocytes during the trajectory of Hantaan virus-induced hemorrhagic fever with renal syndrome
Abstract
Introduction: Hemorrhagic fever with renal syndrome (HFRS) is a zoonotic disease with high mortality. Almost 90% of global cases of HFRS are induced by Hantaan virus (HTNV) infection. Although lymphocyte dysfunction is a critical factor in HFRS progression, the specific immune dynamics of HTNV remain unexplored, and current analyses predominantly depend on single-time point sampling. Therefore, comprehensive longitudinal studies are needed to characterize circulating lymphocyte dynamics during HTNV-induced HFRS progression.
Methods: In this study, we conducted a flow cytometric analysis of circulating lymphocytes in 39 patients with HTNV-induced HFRS across different clinical phases. The analysis encompassed conventional T cells, unconventional T cells, B cells, NK cells and their respective repertoires.
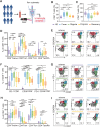
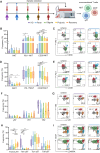
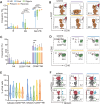
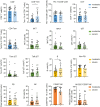
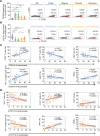
Results and discussion: Here, we revealed phase-specific immune patterns: CD8+ T, CD8+ Tems, and activated CD8+ T, MAIT and NKT cells peaked during febrile/oliguric phases before declining in polyuria/recovery, while CD4+ T and MAIT cells showed inverse fluctuation patterns. Higher frequencies of CD8+ Tem, B, and CD56dim NK cells during the febrile phase correlated with severe disease, enabling early risk stratification. Lower CD4+ Tcm levels in the oliguric phase marked progression to severe HFRS, indicating potential therapeutic strategies aimed at enhancing CD4+ Tcm generation or inhibiting effector differentiation. Additionally, CD38 and CD161 expression predicted specific lymphocyte subset dynamics, offering novel biomarkers for immunomodulatory strategies. Our study thus provides the first comprehensive atlas of lymphocyte evolution in HTNV-induced HFRS, connecting immune dysregulation with clinical outcomes.
Keywords: HFRS; HTNV; biomarkers; dynamic alterations; lymphocyte subsets.
Copyright © 2025 Su, Liu, Shi, Cheng, Gao, Guo, He, Zhang, Chen, Hu, Li and Wang.
Conflict of interest statement
The authors declare that the research was conducted in the absence of any commercial or financial relationships that could be construed as a potential conflict of interest.
Figures

Similar articles
-
Levels of HTNV-specific CD8+ T lymphocytes in PBMC from the patients with hemorrhagic fever with renal syndrome.Intern Emerg Med. 2013 Sep;8(6):503-8. doi: 10.1007/s11739-011-0633-4. Epub 2011 Jun 8. Intern Emerg Med. 2013. PMID: 21655928
-
CD8low CD100- T Cells Identify a Novel CD8 T Cell Subset Associated with Viral Control during Human Hantaan Virus Infection.J Virol. 2015 Dec;89(23):11834-44. doi: 10.1128/JVI.01610-15. Epub 2015 Sep 16. J Virol. 2015. PMID: 26378166 Free PMC article.
-
Design and synthesis of HLA-A*02-restricted Hantaan virus multiple-antigenic peptide for CD8+ T cells.Virol J. 2020 Jan 31;17(1):15. doi: 10.1186/s12985-020-1290-x. Virol J. 2020. PMID: 32005266 Free PMC article.
-
Hemorrhagic Fever with Renal Syndrome: Pathogenesis and Clinical Picture.Front Cell Infect Microbiol. 2016 Feb 3;6:1. doi: 10.3389/fcimb.2016.00001. eCollection 2016. Front Cell Infect Microbiol. 2016. PMID: 26870699 Free PMC article. Review.
-
Potential clinical biomarkers in monitoring the severity of Hantaan virus infection.Cytokine. 2023 Oct;170:156340. doi: 10.1016/j.cyto.2023.156340. Epub 2023 Aug 20. Cytokine. 2023. PMID: 37607412 Review.
References
MeSH terms
LinkOut - more resources
Full Text Sources
Research Materials

