. 2025 May 29:16:1539646.
doi: 10.3389/fendo.2025.1539646. eCollection 2025.

Comprehensive bioinformatics analysis and experimental verification identify mitochondrial gene Dgat2 as a novel therapeutic biomarker for myocardial ischemia-reperfusion

Affiliations

Comprehensive bioinformatics analysis and experimental verification identify mitochondrial gene Dgat2 as a novel therapeutic biomarker for myocardial ischemia-reperfusion

Hong Li et al. Front Endocrinol (Lausanne). .

Abstract

Background: Ischemic cardiomyopathy is a severe disease marked by high morbidity and mortality, often exacerbated by myocardial ischemia/reperfusion injury (MI/RI). Mitochondrial metabolism plays a critical role in MI/RI progression. This study aimed to identify potential new targets and biomarkers for mitochondria-related genes in MI/RI.

Methods: MI/R microarray data (GSE160516) from the GEO database and a mitochondrial geneset were analyzed. Limma identified differentially expressed genes (DEGs), followed by GSEA, GO, and KEGG pathway enrichment. Mitochondria-related DEGs (MitoDEGs) were pinpointed. Protein-Protein Interaction (PPI) networks and machine learning identified key MitoDEGs. Regulatory networks were constructed using transcription factor (TF) predictions. Immune cell infiltration was assessed with ImmuCelAl, and correlations between MitoDEGs and immune cell levels were examined. Mouse myocardial ischemia-reperfusion models were established to validate pivotal MitoDEGs.

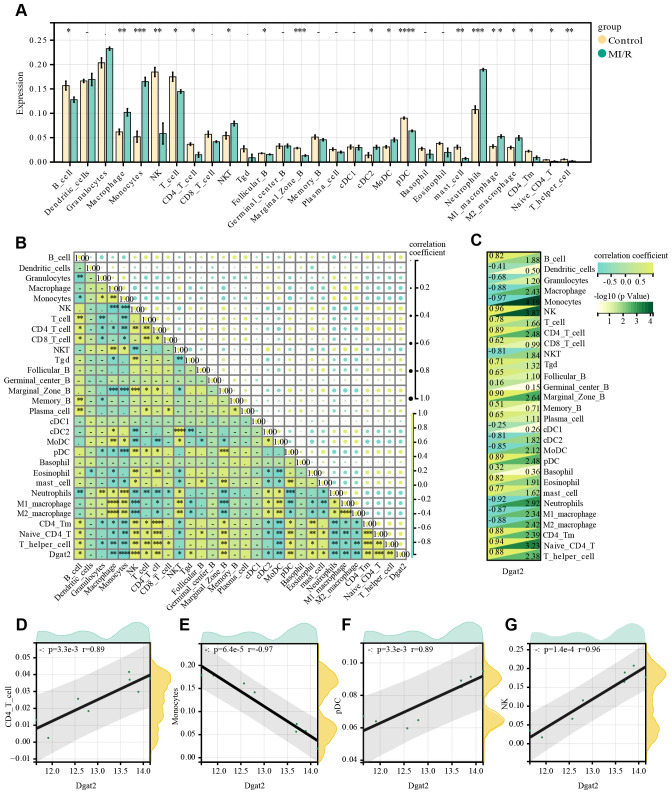
Results: MitoDEGs were enriched in bio-oxidation, immune-inflammation, and oxidative stress pathways. Machine learning identified two hub genes: Dgat2 and Cybb. Dgat2 was significantly elevated in ischemia-reperfusion mouse models, confirmed by RT-PCR and Western blot. Functional enrichment indicated that Dgat2 may be involved in biological oxidation and lipid metabolism. TF prediction suggested PPARG as a regulator of Dgat2 expression. Immune infiltration analysis revealed significant correlations between Dgat2 and immune cells, including CD4_T_cells and NK cells, suggesting a role for immunity in MI/RI.

Conclusions: We found that Dgat2 could be exploited as a novel mitochondria-related gene target and biomarker in myocardial ischemia-reperfusion injury, which is of great clinical significance.

Keywords: Dgat2; bioinformatics analysis; mitochondria; myocardial ischemia/reperfusion injury; oxidative stress.


Conflict of interest statement

The authors state that the study was done without any commercial or financial links that could be seen as a potential conflict of interest.

Figures

Figure 1
Figure 1
Flowchart of analytical steps in this study.
Figure 2
Figure 2
Sample characteristics and identified DEGs in MI/RI. (A) Individual characteristics of the GSE dataset. (B) Volcano plot of DEGs in GSE160516. Orange triangles and green triangles represent significantly upregulated and downregulated genes, respectively. Black dots: non-significant. Dashed lines indicate thresholds. (C) Clustered heatmap of DEGs in GSE160516. Color scale: relative expression (yellow=high, green=low). Rows: DEGs; columns: samples (yellow=MI/R, green=control).
Figure 3
Figure 3
GO and KEGG enrichment analyses of DEGs from GSE160516, and results of GSEA analysis. (A, E) The enriched GO: BP (biological process) terms of DEGs in GSE160516. In (A) the terms significantly enriched are sorted by Z-score (color bar). The x-axis represents statistical significance (-Log10 adjusted p-value), and the y-axis shows the GO terms. Key pathways related to oxidative stress and immune response are highlighted. In (E) the GO terms are color-coded based on regulation direction (upregulated: green; downregulated: yellow), with the size/height of the bars representing the Z-score. Several terms and their GO identifiers are highlighted. (B, F) The enriched GO: CC (cellular component) terms of DEGs in GSE160516. (C, G) The enriched GO: MF (molecular function) terms of DEGs in GSE160516. (D, H) KEGG pathway enrichment results in GSE160516. (I-L) 4 GSEA datasets(Biological Oxidations, Toll Like Receptor Signaling Pathway, Cytokine Signaling Immune System, B Cell Receptor, Signaling Pathway) with significant correlation. The curves in the figure display the distribution of genes in the ranked dataset. The x-axis represents the gene ranking in the ordered dataset, and the y-axis represents the enrichment score. NES (Normalized Enrichment Score), P.adj, and FDR (False Discovery Rate) are indicated in the figure.
Figure 4
Figure 4
MitoDEGs in MI/RI; PPI network analysis, GO and KEGG enrichment analyses and hub MitoDEGs identification. (A) MitoDEGs that overlap between DEGs and mitochondria-related genes from 2031 mitochondria-related publications. (B) PPI network of MitoDEGs. The nodes represent genes, with the color intensity reflecting their significance (dark green indicates high significance, while light green indicates low significance). The edges represent interactions between the genes. (C, D) GO and KEGG pathway enrichment results in MitoDEGs. (E) Identification of five characterized genes in Random Forest pairs. The x-axis represents the genes, and the y-axis represents their scores in the Random Forest model. The darker the color of the bars, the higher the score. (F) Hub MitoDEGs that overlap between 10 key genes in PPI network and 5 major genes in Random Forest results.
Figure 5
Figure 5
Confirmation of hub MitoDEGs expression and association with MI/R mouse. (A) Representative echocardiographic images were obtained 24 h after myocardial ischemia/reperfusion (MIR). (B, C) Left ventricular ejection fraction (LVEF) and fractional shortening (LVFS). (D) Representative images of myocardial 2,3,5-triphenyltetrazolium chloride (TTC)/Evans blue double staining. (E) The infarct size (INF) was calculated as a percentage of the myocardial area at risk (AAR). (F) The LDH levels in serum. (G, H) Cybb and Dgat2 relative mRNA expression. (I, J) Protein levels of Cybb, Dgat2 by western blotting, and quantitative analysis in heart tissue. (K, L) The immunohistochemistry staining of Dgat2 protein in heart tissue and quantitative analysis. Data are expressed as mean ± SE, n = 6, ns, no significance, *p < 0.05, **p < 0.01, ****p < 0.0001.
Figure 6
Figure 6
PPI network analysis, GO and KEGG enrichment analyses of Dgat2. (A) PPI Network Analysis for Dgat2 of GeneMANIA Database. The edge colors represent different types of interactions: physical interactions (red, 45.00%), predictions (yellow, 22.45%), co-expression (green, 17.96%), pathways (light blue, 2.07%), genetic interactions (green, 1.81%), co-localization (dark blue, 1.57%), shared protein domains (yellow, 1.04%), and other predicted associations (gray, 8.09%). (B) PPI Network Analysis for Dgat2 of STRING Database. Based on the confidence scores (ranging from 0 to 1) provided by the STRING database, we selected the top 10 highest-confidence protein-protein interactions with a confidence score ≥ 0.9 for visualization. (C) The enriched GO terms for Dgat2(BP biological process, CC cellular component, MF molecular function). GeneRatio represents the proportion of enriched genes in each term; the color of the dots indicates the number of genes (count), and the size of the dots reflects the level of significance (Q-value). (D) KEGG pathway enrichment results for Dgat2.
Figure 7
Figure 7
Infiltration of immune cell types compared between MI/R and Control group. (A) The histogram of the immune cell proportions; (B) The correlation matrix of immune cell proportions; (C) Heatmap of immune cells correlating with Dgat2; (D-G) Four leukocyte subpopulations(CD4+ T cell, Monocytes, pDC and NK) with significant correlation with the expression of the key gene Dgat2.
Figure 8
Figure 8
Transcription factor prediction for Dgat2. (A) Three different databases for GTRD, ChEA3, and hTFtarget identified 17 transcription factor overlaps; (B) PPARG binding site prediction by JASPAR; (C) Conserved PPARG binding sites in the promoter region of the DGAT2 gene.

Similar articles

References

    1. Nowbar AN, Gitto M, Howard JP, Francis DP, Al-Lamee R. Mortality from ischemic heart disease. Circ Cardiovasc Qual Outcomes. (2019) 12:e005375. doi: 10.1161/CIRCOUTCOMES.118.005375 - DOI - PMC - PubMed
    1. Liu Y, Wang Z, Zhang J, Zhou Z. Myocardial ischemia-reperfusion injury; Molecular mechanisms and prevention. Microvasc Res. (2023) 149:104565. doi: 10.1016/j.mvr.2023.104565 - DOI - PubMed
    1. Tian H, Zhao X, Zhang Y, Xia Z. Abnormalities of glucose and lipid metabolism in myocardial ischemia-reperfusion injury. BioMed Pharmacother. (2023) 163:114827. doi: 10.1016/j.biopha.2023.114827 - DOI - PubMed
    1. Jennings RB, Steenbergen C, Jr., Reimer KA. Myocardial ischemia and reperfusion. Monogr Pathol. (1995) 37:47–80. - PubMed
    1. Banović MD, Ristić AD. The role of mitochondrial dysfunction in heart failure and potential therapeutic targets. Curr Pharm Des. (2016) 22:4752–62. doi: 10.2174/1381612822666160614081853 - DOI - PubMed

MeSH terms

Substances

LinkOut - more resources