. 2025 May 14;36(2):102559.
doi: 10.1016/j.omtn.2025.102559. eCollection 2025 Jun 10.

Differentially expressed ncRNAs as key regulators in infection of human bronchial epithelial cells by the SARS-CoV-2 Delta variant

Affiliations

Differentially expressed ncRNAs as key regulators in infection of human bronchial epithelial cells by the SARS-CoV-2 Delta variant

Glory Ranches et al. Mol Ther Nucleic Acids. .

Abstract

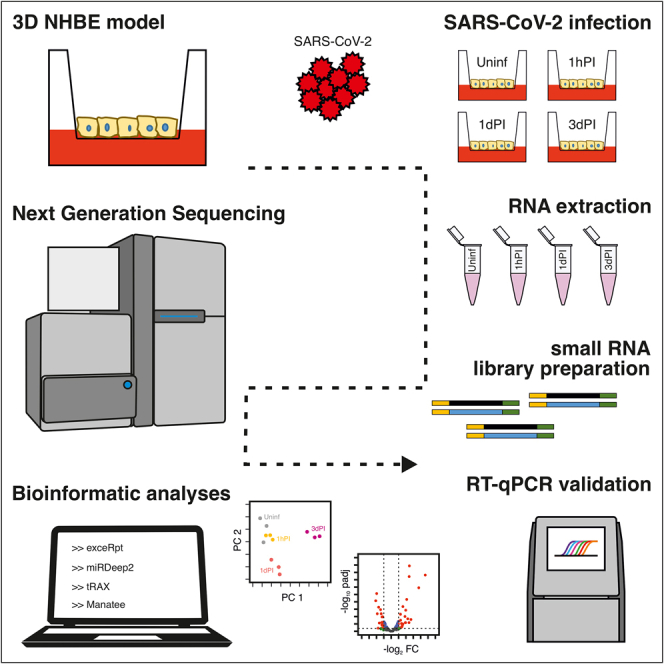
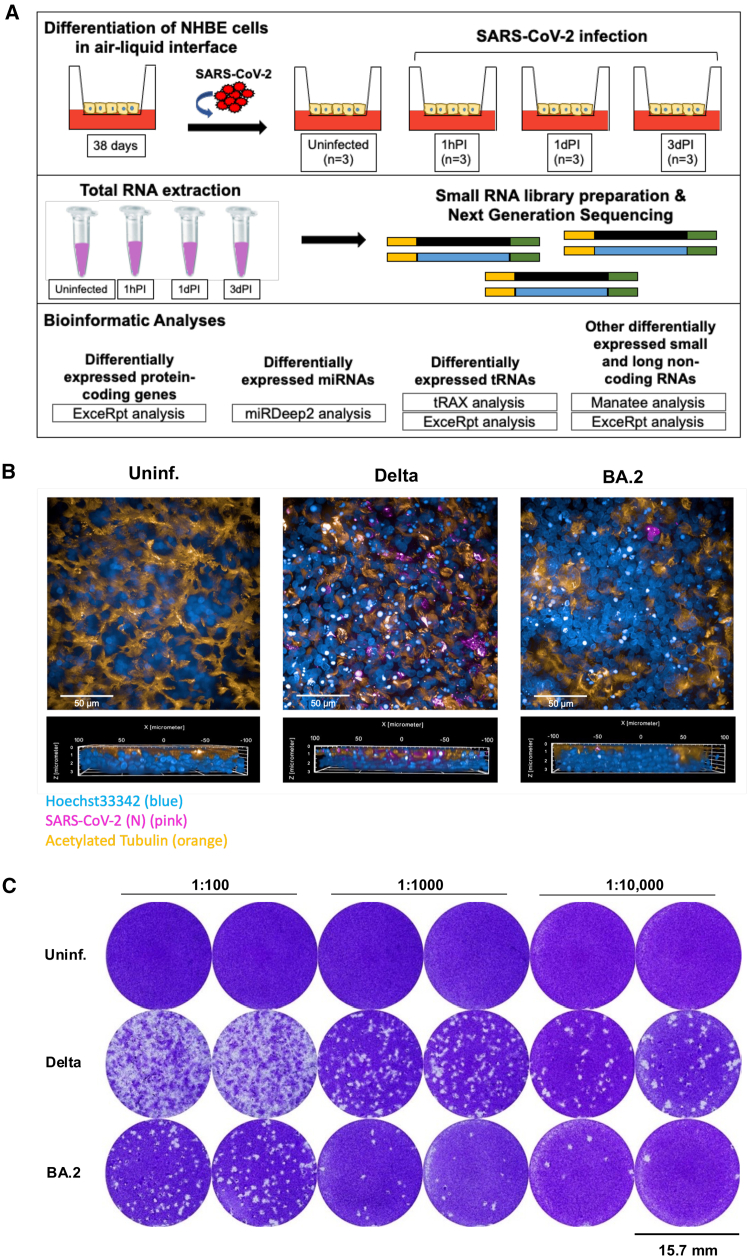
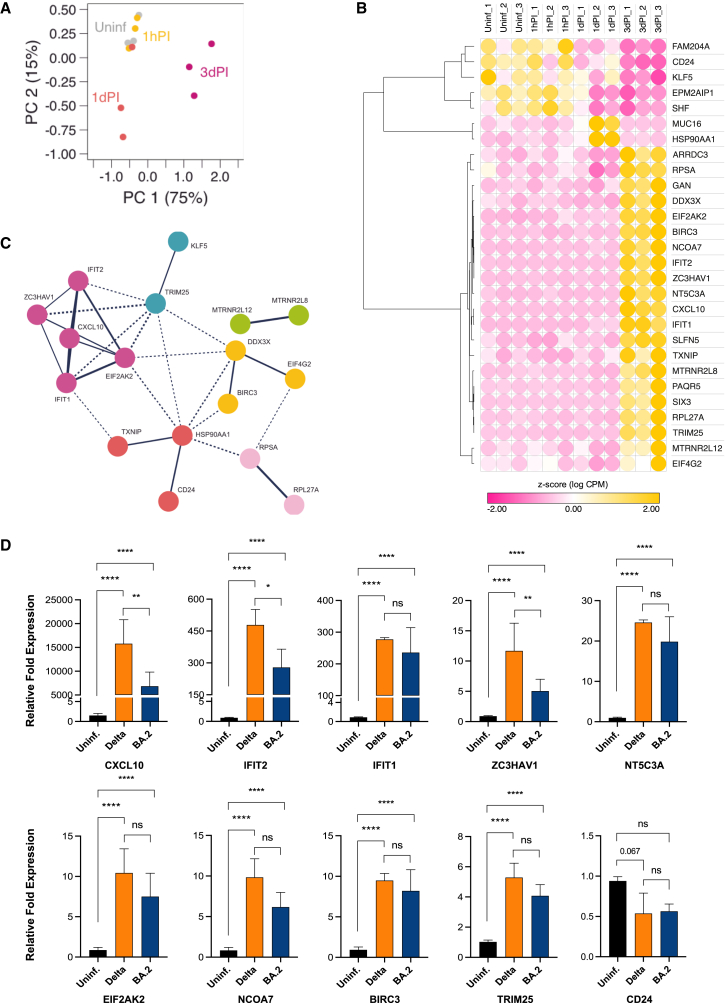
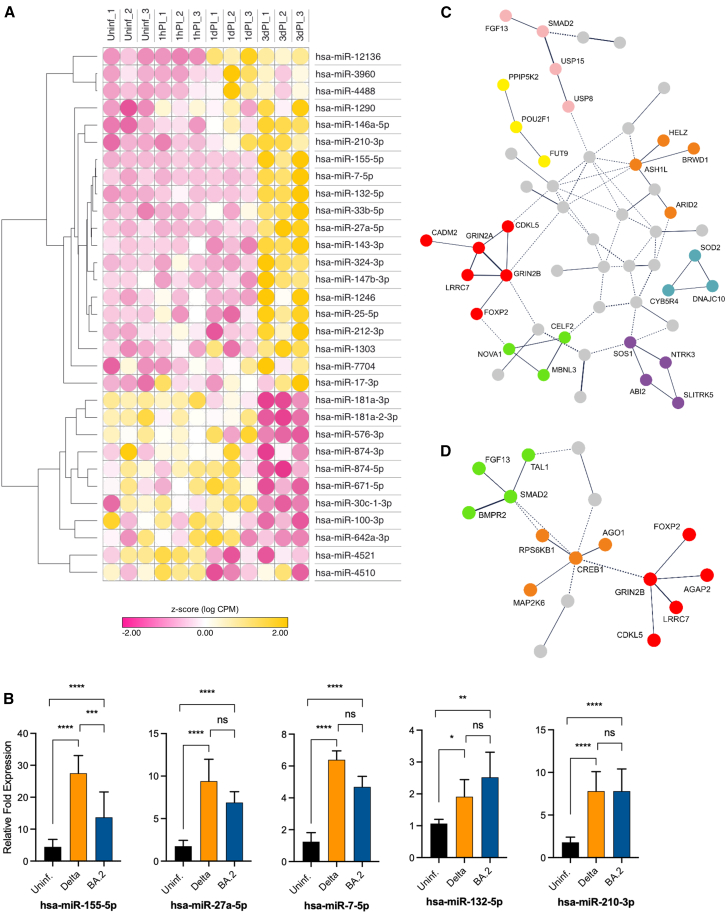
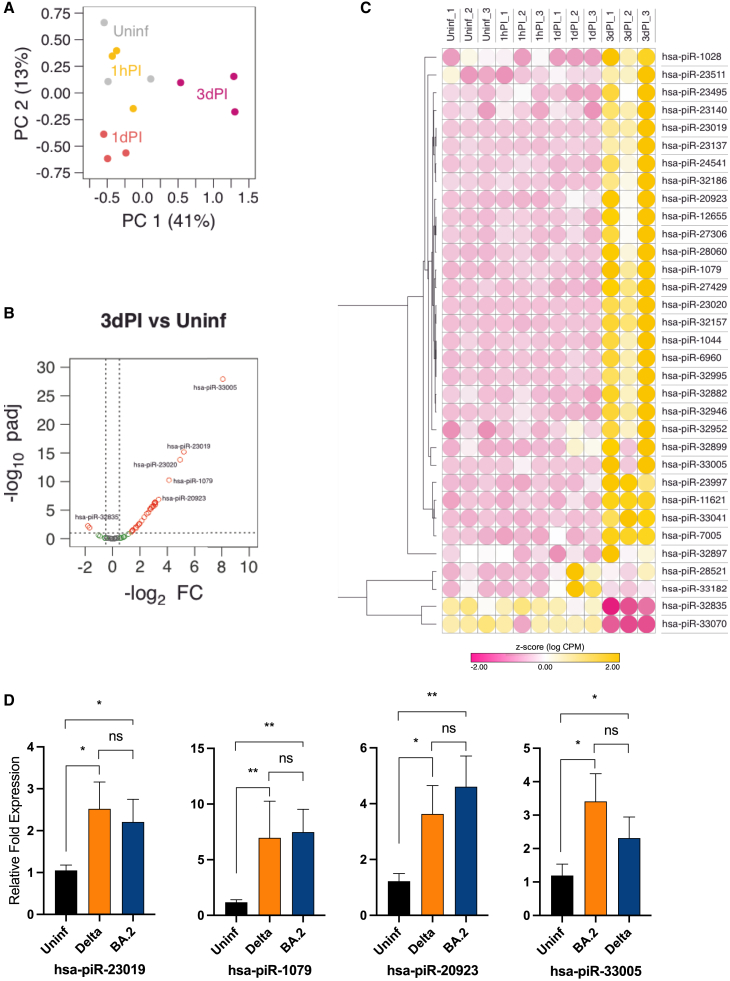
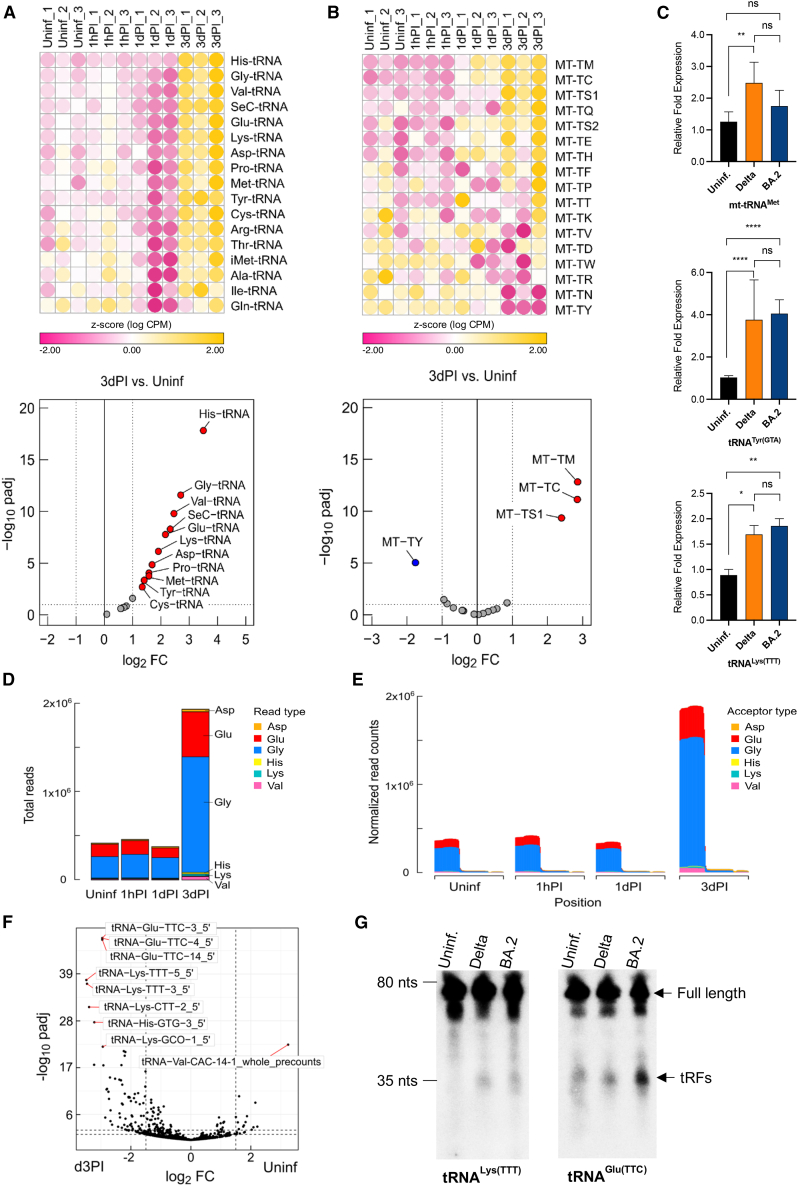
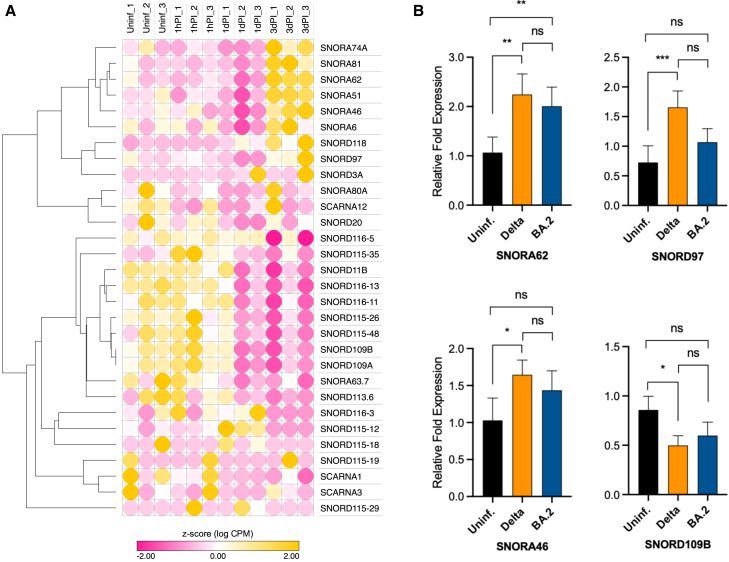
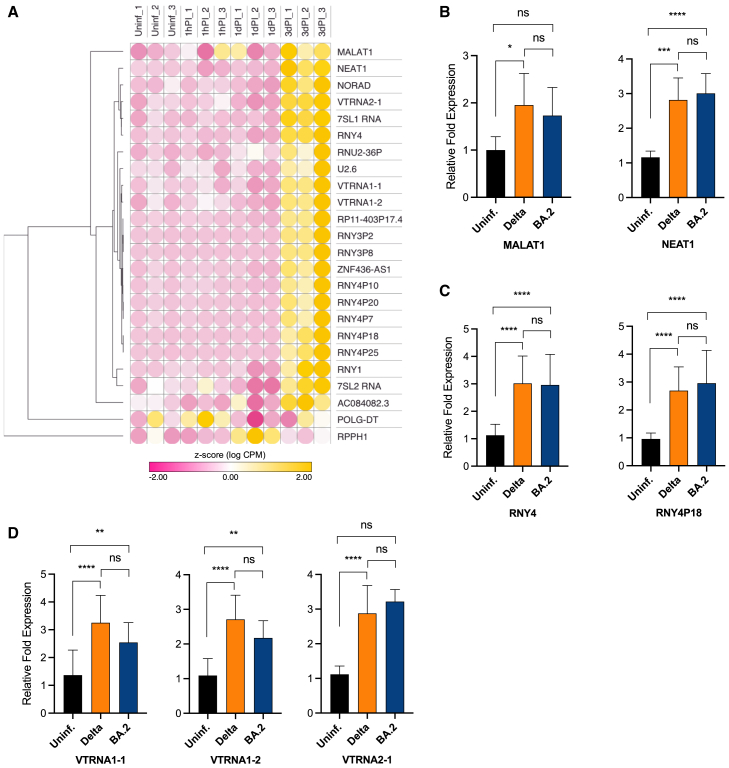
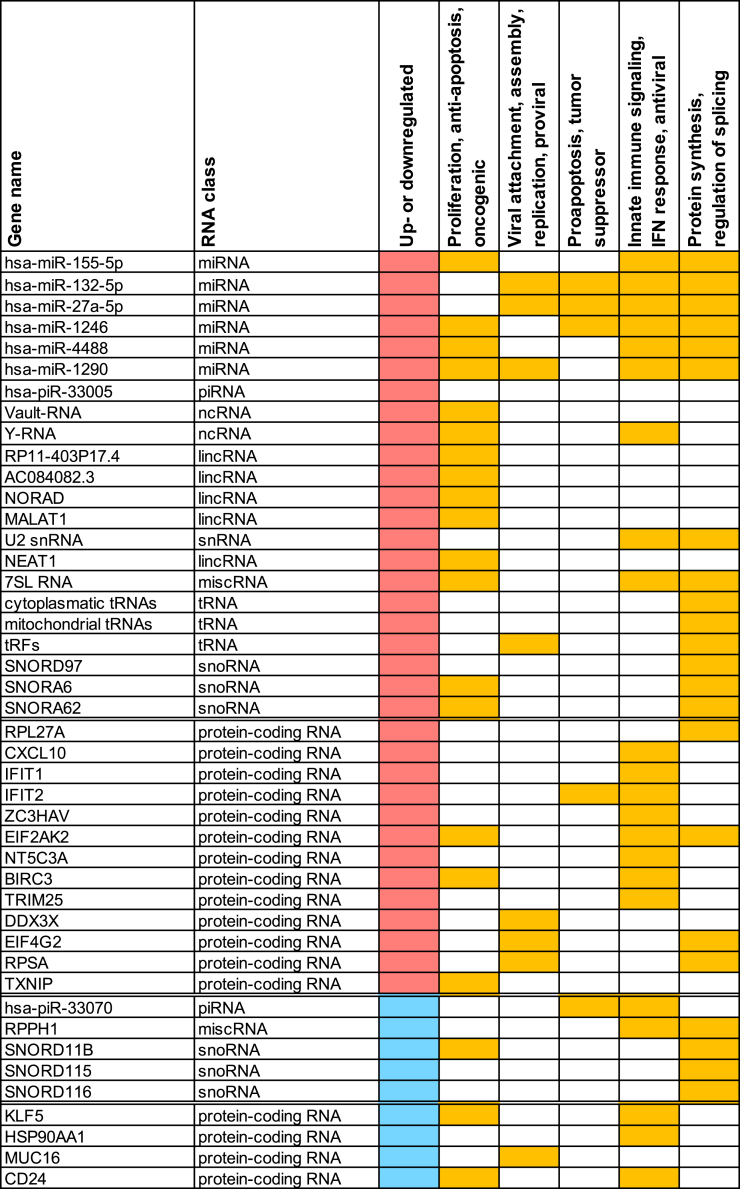
SARS-CoV-2 infection initiates complex interactions at mucosal barriers. In primary human bronchial epithelial cells, we investigated changes in the small RNA transcriptome induced by Delta variant infection. Thereby, we uncovered differential expression of a specific set of microRNAs (miRNAs), PIWI-interacting RNAs (piRNAs), small nucleolar RNAs (snoRNAs), vault RNAs, Y RNAs, and long intergenic non-coding RNAs (lincRNAs), which inhibit apoptosis while promoting cell proliferation and viral infection. Conversely, differential expression of 7SL, U2, and RPPH1 RNAs, as well as miR-155-5p and miR-27a-5p, was found to be involved in antiviral signaling. In addition, expression of the protein-coding genes CXCL10, IFIT1, NCOA7, IFIT2, SIX3, and RPSA was increased during infection. Interestingly, the ribosomal protein RPSA has recently been reported to also serve as a viral surface receptor promoting pro-inflammatory cytokine signaling. By investigating these differentially expressed genes also after Omicron BA.2 variant infection, we observed a significantly lower expression of the protein-coding genes CXCL10, IFIT2, and ZC3HAV1. In contrast, expression changes for the majority of non-coding RNAs (ncRNAs) were similar between Delta and Omicron variants with the exception of miR-155-5p and 5'-tRFGlu(TTC), emphasizing their potential as biomarkers for disease severity. Our findings thus highlight distinct molecular responses in SARS-CoV-2-infected cells, revealing specific genes and ncRNAs involved in viral replication, immune response, and apoptosis.

Keywords: MT: Non-coding RNAs; SARS-CoV-2; non-coding RNAs; pathways; transcriptomic profile; virus variants.


Conflict of interest statement

The authors declare no competing interests.

Figures

None
Graphical abstract
Figure 1
Figure 1
SARS-CoV-2 infection and characterization (A) Schematic diagram of SARS-CoV-2 (Delta) treatment of differentiated NHBE cells in air-liquid interface (ALI) culture system. Following post infection of cells for 1 h (1hPI), 24 h or 1 day post-infection (1dPI), and 72 h or 3 days post-infection (3dPI), cells were harvested and analyzed for total RNA extraction. Uninfected (Uninf.) cells were used as controls. Total RNA extracts were analyzed for small RNA-seq library preparation and RNA sequencing (RNA-seq). RNA-seq data were processed by employing specific data analysis pipelines to determine differentially expressed genes in the presence of SARS-CoV-2. (B) Representative images of NHBE cells, which were either Uninf. or infected with SARS-CoV-2 Delta or Omicron BA.2 for 72 h. Cells were fixed and stained for Hoechst (blue), SARS-CoV-2 (N) (pink), and acetylated tubulin (orange), and subsequently analyzed by confocal microscopy. Scale bars, 50 μm. (C) Productive infection of NHBE cells after 72 h following Delta (middle) or Omicron BA.2 (BA.2) (bottom) infection is illustrated. Uninf. NHBE cells (top) served as negative control. VeroE6/TMPRSS2/ACE2 were inoculated with supernatants of Uninf., Delta-, or BA.2-infected NHBE cultures at different dilutions (i.e., 1:100, 1:1,000 and 1:10,000). After 72 h, cells were stained using crystal violet and viral plaques were counted to analyze productive infection. Assays were performed at least 3 times and a representative experiment is depicted. Scale bars, 15.7 mm.
Figure 2
Figure 2
Differentially expressed protein-coding genes induced by SARS-CoV-2 in NHBE cells (A) Principal-component analysis of differentially expressed protein-coding genes in NHBE cells upon SARS-CoV-2 (Delta) infection following 1 h post-infection (1hPI), 24 h or 1 day post-infection (1dPI), and 72 h or 3 days post-infection (3dPI). Uninfected (Uninf.) NHBE cells were used as control group. (B) Heatmap of differentially expressed protein-coding genes shown as relative Z score, which indicates the normalized expression levels of each group relative to the mean. Positive values (yellow) indicate high expression and negative values (pink) represent low expression per gene. (C) Protein-protein interaction network for differentially expressed protein-coding genes. Clustering was performed using MCL clustering with inflation parameter set to 3. Disconnected nodes are hidden from the network. (D) RT-qPCR validation of selected protein-coding gene candidates in (B) using Uninf. and SARS-CoV-2-(Delta or Omicron BA.2)-infected NHBE cells at 3dPI. Bar graphs indicate mean ± standard deviation of fold change in expression of gene candidates in SARS-CoV-2-infected cells relative to Uninf. cells. Two-way ANOVA followed by Tukey’s post-hoc test was performed using normalized Ct values. The analysis was performed in triplicates using at least three independent samples. ∗p < 0.05, ∗∗p < 0.01, and ∗∗∗∗p < 0.0001; and ns, not significant.
Figure 3
Figure 3
Significantly dysregulated miRNAs in NHBE cells upon SARS-CoV-2 infection (A) Heatmap of dysregulated miRNA candidates in SARS-CoV-2 (Delta)-infected NHBE cells following 1 h post-infection (1hPI), 24 h or 1 day post-infection (1dPI), and 72 h or 3 days post-infection (3dPI). The relative Z score values, which indicate the normalized expression of each group relative to the mean, are shown. Positive values (yellow) indicate high expression and negative values (pink) represents low expression. (B) RT-qPCR validation of selected differentially expressed miRNA candidates in uninfected (Uninf.) and SARS-CoV-2-(Delta or Omicron BA.2)-infected NHBE cells at 3dPI. The experiment was performed using at least three independent samples (n = 3) for each group and the analysis was carried out in triplicates. Bar graphs indicate mean ± standard deviation of fold change in expression of selected miRNA candidates in SARS-CoV-2-infected cells relative to Uninf. cells. Two-way ANOVA followed by Tukey’s post-hoc test was performed using normalized Ct values. The experiment was performed using at least three independent samples. ∗p < 0.05, ∗∗p < 0.01, ∗∗∗p < 0.001, and ∗∗∗∗p < 0.0001; and ns, not significant. (C and D) Protein-protein interaction (PPI) networks of main genes predicted to be targeted by at least 50% of significantly upregulated (C) or downregulated (D) miRNAs. Clustering performed using MCL clustering with inflation parameter set to 3. Disconnected nodes are hidden from the network.
Figure 4
Figure 4
Differential expression of piRNAs observed in NHBE cells upon SARS-CoV-2 infection (A) Principal-component analysis of differentially expressed piRNAs in uninfected (Uninf.) and SARS-CoV-2 (Delta)-infected NHBE cells following 1 h post-infection (1hPI), 24 h or 1 day post-infection (1dPI), and 72 h or 3 days post-infection (3dPI). (B) Volcano plot of −log 10 p values adjusted (padj) versus log2 fold change (FC) for piRNAs in infected NHBE cells (3dPI) compared to Uninf. cells. Significantly differentially expressed genes are highlighted in red dots. (C) Heatmap of dysregulated piRNA candidates (as in B), which is indicated by relative Z score values, showing the normalized expression levels of each group relative to the mean. Positive values (yellow) indicate high expression and negative values (pink) represent low expression. (D) RT-qPCR analysis of selected differentially expressed piRNA candidates in (C) using SARS-CoV-2 (Delta or Omicron BA.2)-infected NHBE cells (3dPI) compared with Uninf. group. The experiment was carried out using at least three independent samples (n = 3) for each group and the analysis was performed in triplicates for each sample. Bar graphs indicate mean ± standard deviation of fold change in expression of selected piRNA candidates in SARS-CoV-2-infected cells relative to Uninf. cells. Two-way ANOVA followed by Tukey’s post-hoc test was performed using normalized Ct values. ∗p < 0.05, ∗∗p < 0.01, ∗∗∗p < 0.001, and ∗∗∗∗p < 0.0001; and ns, not significant. The experiment was carried out using at least three independent samples.
Figure 5
Figure 5
Identification of differentially expressed tRNA genes in NHBE cells during the onset of SARS-CoV-2 infection by exceRpt analysis and tRFs using tRAX analysis (A) Heatmap (left) and volcano plot (right) analyses of significantly dysregulated nuclear-encoded tRNAs in SARS-CoV-2 (Delta)-infected NHBE cells for 1 h post-infection (1hPI), 24 h or 1 day post-infection (1dPI), or 72 h or 3 days post-infection (3dPI). Uninfected (Uninf.) cells were used as controls. For the heatmap, the normalized expression levels of each group relative to the mean are indicated by Z score values. Positive values (yellow) indicate high expression, whereas negative values (pink) indicate low expression. Log2 fold change versus −log10 p value of tRNA candidates in 3dPI NHBE cells versus the control (Uninf.) group are shown for the volcano plot. (B) (Left ) Heatmap analysis of differentially expressed mt-tRNAs in SARS-CoV-2 (Delta)-infected NHBE cells (1hPI, 1dPI, and 3dPI) relative to Uninf. cells (as in A) based on Z score values. Uninf. cells were used as controls. Yellow indicates high expression; whereas, pink indicates low expression. (Right) Volcano plot analysis of log2 fold change versus −log10 p value of mt-tRNAs candidates in 3dPI NHBE cells versus the control or Uninf. group. (C)Validation of selected tRNA candidates (in A and B) in Uninf. and SARS-CoV-2 (Delta or Omicron BA.2)-infected NHBE cells (3dPI) by RT-qPCR. The experiment was performed using three independent samples (n = 3) for each group and the analysis was done in triplicates for each sample. Bar graphs indicate mean ± standard deviation of fold change in expression of selected tRNA candidates in SARS-CoV-2-infected cells relative to Uninf. cells. Two-way ANOVA followed by Tukey’s post-hoc test was performed using normalized Ct values. ∗p < 0.05, ∗∗p < 0.01, and ∗∗∗∗p < 0.0001; and ns, not significant. (D) Distribution of most abundant nuclear-encoded tRNA gene in NHBE cells, which were either uninfected or infected with SARS-CoV-2 Delta variant for 1 h post-infection (1hPI), 24 h or 1 day post-infection (1dPI), or 72 h or 3 days post-infection (3dPI), based on total reads. (E) Read coverage analysis of tRNA species in Uninf. and infected NHBE cells as in (D), showing the overall distribution of fragments at the 5′ or 3′ position based on normalized read counts. (F) Volcano plot of log2 fold change values versus adjusted p values of tRNAs, showing differentially expressed tRNA isotypes in fragment, full length or other form. (G) Northern blot analysis of selected tRF candidates. An equal amount of total RNA extracts (pooled from four independent samples) derived from Uninf. and infected NHBE cells (3dPI) with SARS-CoV-2 Delta or Omicron BA.2 (BA.2) were used in the analysis.
Figure 6
Figure 6
Differentially expressed snoRNAs in SARS-CoV-2-infected NHBE cells (A) Heatmap of significantly differentially expressed snoRNAs in uninfected (Uninf.) and SARS-CoV-2-infected following 1 h post-infection (1hPI), 24 h or 1 day post-infection (1dPI), and 72 h or 3 days post-infection (3dPI), indicated by Z score values. Positive values (yellow) represent high expression and negative values (pink) indicates low expression. (B) Validation of selected snoRNA candidates by RT-qPCR in (A) using Uninf. and SARS-CoV-2 (Delta or Omicron BA.2)-infected NHBE cells (3dPI). Bar graphs indicate mean ± standard deviation of fold change in expression of snoRNA candidates in Delta- and Omicron BA.2 (BA.2)-infected NHBE cells relative to Uninf. cells. The experiment was performed in triplicates using at least three independent samples (n = 3) for each group. Statistical analysis was carried out using Fisher’s LSD test. ∗p < 0.05, ∗∗p < 0.01, and ∗∗∗p < 0.001; and ns, not significant.
Figure 7
Figure 7
Differential expression of miscRNAs and lincRNAs identified in SARS-CoV-2-infected NHBE cells (A) Heatmap of significantly differentially expressed miscRNAs and lincRNAs indicated by Z score values. Positive values (yellow) indicate high expression and negative values (pink) represent low expression. (B–D) Validation of selected lincRNA, Y RNA, and vault RNA candidates in (A) by RT-qPCR using uninfected (Uninf.) and SARS-CoV-2 (Delta or Omicron BA.2)-infected NHBE cells (3dPI). The experiment was conducted in triplicates using at least three independent samples (n = 3) for each group. Bar graphs indicate mean ± standard deviation of fold change in expression of selected candidates in Delta- and Omicron BA.2 (BA.2)-infected NHBE cells relative to Uninf. cells. Normalized Ct values were used for statistical analysis using two-way ANOVA followed by Tukey’s post-hoc test. ∗p < 0.05, ∗∗p < 0.01, ∗∗∗p < 0.001, and ∗∗∗∗p < 0.0001; and ns, not significant.
Figure 8
Figure 8
Involvement of differentially expressed RNA candidates with specific cellular pathways Allocation of upregulated (red) and downregulated (blue) protein-coding genes and non-coding RNA classes to the conserved pathways, namely “Proliferation, anti-apoptosis, oncogenic,” “Viral attachment, assembly, replication, proviral,” “Proapoptosis, tumor suppressor,” “Innate immune signaling, IFN response, antiviral,” and “Protein synthesis, regulation of splicing” based on a literature search of the respective genes and pathway terms.

Similar articles

References

    1. Fehr A.R., Perlman S. Coronaviruses: an overview of their replication and pathogenesis. Methods Mol. Biol. 2015;1282:1–23. - PMC - PubMed
    1. Callaway E. Heavily mutated Omicron variant puts scientists on alert. Nature. 2021;600:21. - PubMed
    1. Shanmugaraj B., Malla A., Khorattanakulchai N., Phoolcharoen W. SARS-CoV-2 omicron variant: Could it be another threat? J. Med. Virol. 2022;94:1284–1288. - PMC - PubMed
    1. Moore J.P., Offit P.A. SARS-CoV-2 Vaccines and the Growing Threat of Viral Variants. JAMA. 2021;325:821–822. - PubMed
    1. Jeworowski L.M., Muhlemann B., Walper F., Schmidt M.L., Jansen J., Krumbholz A., Simon-Loriere E., Jones T.C., Corman V.M., Drosten C. Humoral immune escape by current SARS-CoV-2 variants BA.2.86 and JN.1, December 2023. Euro Surveill. 2024;29 - PMC - PubMed

LinkOut - more resources