

Web-based real-time risk assessment of coronavirus disease 2019 infection in schools and social dining settings
- PMID: 40510847
- PMCID: PMC12159886
- DOI: 10.1016/j.nmni.2025.101600
Web-based real-time risk assessment of coronavirus disease 2019 infection in schools and social dining settings
Abstract
Background: Schools and dining situations are associated with a high risk of indoor transmission of coronavirus disease 2019 (COVID-19). Performing risk assessment in real time could enable organizers to adjust the duration and size of indoor activities depending on the epidemic situation.
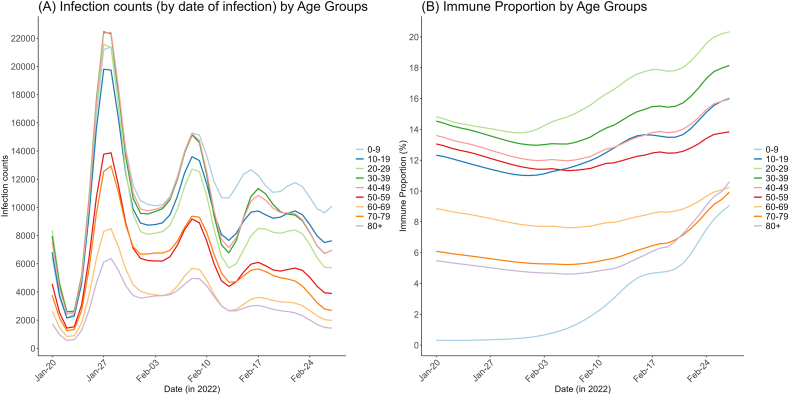
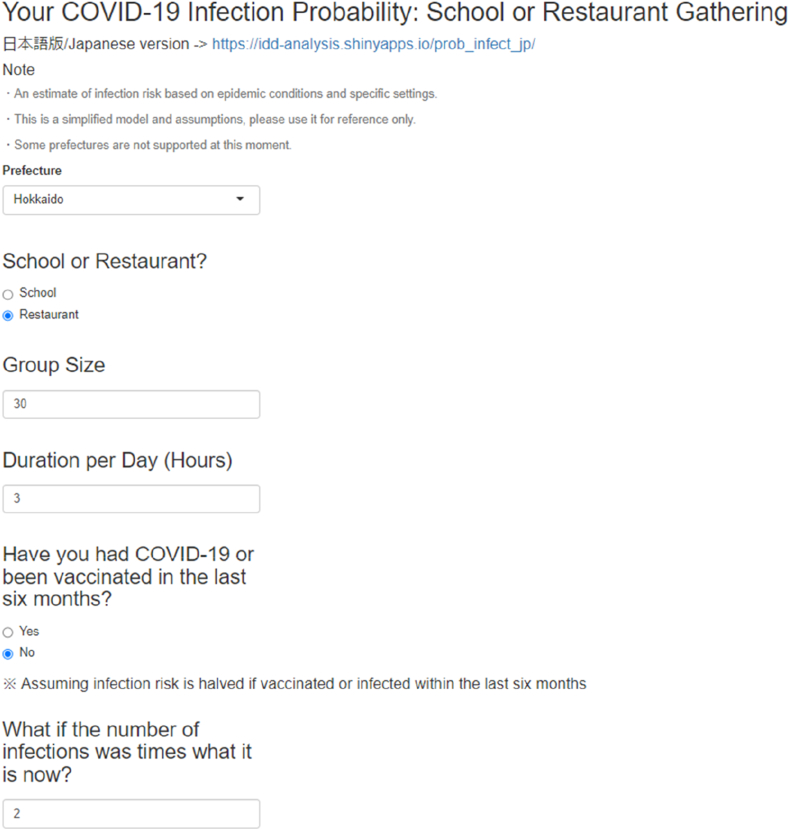
Methods: The per-hour transmission rates of COVID-19 from a single infector in school and social dining settings were estimated from COVID-19 surveillance data in Japan from January to February 2022 using a mathematical model. We then developed a web application that calculates the risk of COVID-19 infection in those settings, accounting for place of residence, vaccination history, duration of indoor activity, and the number of participants.
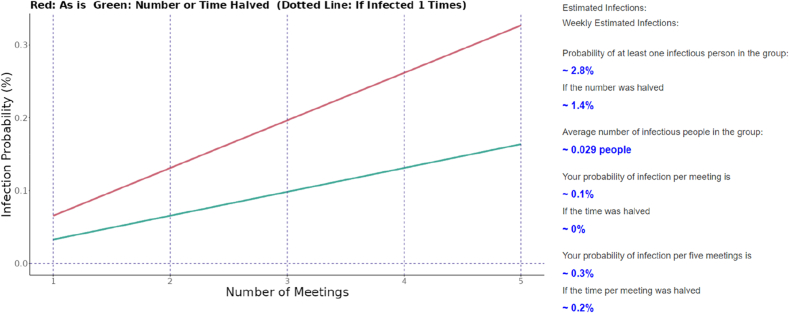
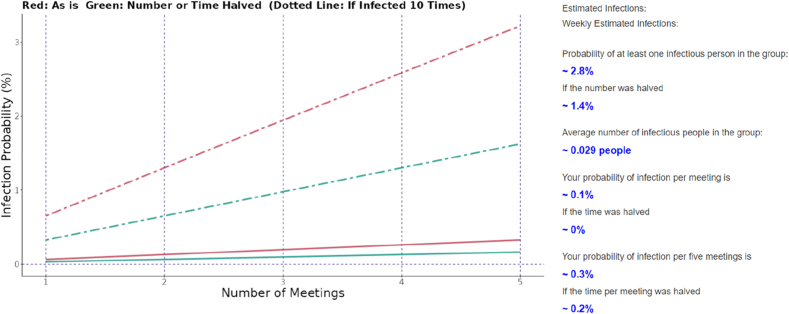
Results: The estimated per-hour transmission rates were 0.01934 (95 %CrI: 0.01939-0.01947) in social dining settings and 0.00324 (95 %CrI: 0.00323-0.00325) in school settings. Accounting for the epidemiological risk of having infected persons in indoor settings, a web application was devised to compute the risk of a single participant contracting COVID-19 at the event. Web application users can vary input variables including the duration and the number of participants, thereby benefiting the real time risk reduction.
Conclusions: The per-hour transmission rate was higher in social dining settings compared with that in school settings, but the greater number of participants that is typical of gatherings at schools might offset this gap in per-hour per-infector transmission risk. The proposed web application can act as an important tool for promoting risk awareness regarding COVID-19 in high-risk settings.
Keywords: Aerosol; COVID-19; Indoor transmission; Japan; Web application.
© 2025 The Authors.
Conflict of interest statement
The authors declare that they have no known competing financial interests or personal relationships that could have appeared to influence the work reported in this paper.
Figures
Similar articles
-
Vaccine-induced reduction of COVID-19 clusters in school settings in Japan during the epidemic wave caused by B.1.1.529 (Omicron) BA.2, 2022.Math Biosci Eng. 2024 Sep 12;21(9):7087-7101. doi: 10.3934/mbe.2024312. Math Biosci Eng. 2024. PMID: 39483074
-
Transmission of COVID-19 in Nightlife, Household, and Health Care Settings in Tokyo, Japan, in 2020.JAMA Netw Open. 2023 Feb 1;6(2):e230589. doi: 10.1001/jamanetworkopen.2023.0589. JAMA Netw Open. 2023. PMID: 36826818 Free PMC article.
-
Folic acid supplementation and malaria susceptibility and severity among people taking antifolate antimalarial drugs in endemic areas.Cochrane Database Syst Rev. 2022 Feb 1;2(2022):CD014217. doi: 10.1002/14651858.CD014217. Cochrane Database Syst Rev. 2022. PMID: 36321557 Free PMC article.
-
The Impact of Keeping Indoor Dining Closed on COVID-19 Rates Among Large US Cities: A Quasi-Experimental Design.Epidemiology. 2022 Mar 1;33(2):200-208. doi: 10.1097/EDE.0000000000001444. Epidemiology. 2022. PMID: 34799474 Free PMC article.
-
The Risk of SARS-CoV-2 Transmission in Community Indoor Settings: A Systematic Review and Meta-analysis.J Infect Dis. 2024 Oct 16;230(4):e824-e836. doi: 10.1093/infdis/jiae261. J Infect Dis. 2024. PMID: 38753340 Free PMC article.
References
-
- Nishiura H., Oshitani H., Kobayashi T., Saito T., Sunagawa T., Matsui T., et al. Closed environments facilitate secondary transmission of coronavirus disease 2019 (COVID-19) medRxiv. 2020 2020.02.28.20029272.
-
- Qian H., Miao T., Liu L., Zheng X., Luo D., Li Y. Indoor transmission of SARS-CoV-2. Indoor Air. 2021;31:639–645. - PubMed
LinkOut - more resources
Full Text Sources
Miscellaneous