. 2025 Dec;17(1):2517821.
doi: 10.1080/19490976.2025.2517821. Epub 2025 Jun 13.

Lachnospiraceae bacterium alleviates alcohol-associated liver disease by enhancing N-acetyl-glutamic acid levels and inhibiting ferroptosis through the KEAP1-NRF2 pathway

Affiliations

Lachnospiraceae bacterium alleviates alcohol-associated liver disease by enhancing N-acetyl-glutamic acid levels and inhibiting ferroptosis through the KEAP1-NRF2 pathway

Hejiao Zhang et al. Gut Microbes. 2025 Dec.

Abstract

Alcohol-associated liver disease (ALD) is a prevalent global health issue primarily caused by excessive alcohol consumption. Recent studies have highlighted the gut-liver axis's protective role against ALD, mainly through gut microbiota. However, the precise mechanism remains ill-defined. Our results showed a significant reduction in Lachnospiraceae bacterium in the gut microbiota of ALD patients and ethanol (EtOH)-fed mice, as revealed by 16S rDNA sequencing. Supplementation with Lachnospiraceae bacterium strains in mice significantly reduced inflammation, hepatic neutrophil infiltration, oxidative stress, and improved gut microbiota and intestinal permeability. Multi-omics analysis identified N-Acetyl-glutamic acid (NAG) as the most significantly altered metabolite following Lachnospiraceae bacterium supplementation, with levels positively correlated to Lachnospiraceae bacterium colonization. NAG treatment exhibited significant protective effects in EtOH-exposed hepatocyte cell lines and EtOH-fed mice. Mechanistically, NAG confers hepatoprotection against ALD by activating the KEAP1-NRF2 pathway, inhibiting ferroptosis. Notably, the protective effects of NAG were reversed by the NRF2 inhibitor. In conclusion, oral supplementation with Lachnospiraceae bacterium mitigates alcohol-induced liver damage both in vivo and in vitro by inhibiting ferroptosis through NAG-mediated activation of the KEAP1-NRF2 pathway. Lachnospiraceae bacterium may serve as promising probiotics for future clinical applications.

Keywords: Alcohol-associated liver disease; Lachnospiraceae bacterium; N-Acetyl-glutamic acid; NRF2; ferroptosis.


Conflict of interest statement

No potential conflict of interest was reported by the author(s).

Figures

None
Graphical abstract
Figure 1.
Figure 1.
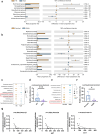
The abundance of Lachnospiraceae bacterium is significantly reduced in ALD patients and EtOH-fed mice and negatively correlates with liver injury in ALD patients. (a) The comparison of the relative abundance of gut bacteria between HC and ALD groups at the family level (statistical differences were analyzed using two-sided Welch’s t-test of STAMP). (b) The comparison of the relative abundance of gut bacteria between pair-fed and EtOH groups at the family level (statistical differences were analyzed using two-sided Welch’s t-test of STAMP). (c) Indicator analysis between HC and ALD groups. The bubble plot visualizes biomarkers; indval represents the ratio of specificity to occupancy. (d) Relative abundance of Lachnospiraceae bacterium between HC and ALD groups. (e) Indicator analysis between pair-fed and EtOH groups. (f) Relative abundance of Lachnospiraceae bacterium between pair-fed and EtOH groups. (g) Correlation analysis of differential species with serum ALT, AST, and GGT levels. n = 20 per group. HC: healthy controls; ALD: alcohol-associated liver disease patients. *p < 0.05, **p < 0.01, ***p < 0.001.
Figure 2.
Figure 2.
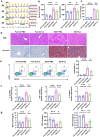
Lachnospiraceae bacterium attenuates alcohol-associated steatohepatitis in mice. (a) Schematic of experimental design (yellow arrows indicate gavage with PBS or Lachnospiraceae bacterium every other day). (b) Serum ALT and AST levels. (c) Liver TG levels. (d) Representative H&E and Oil red O staining of liver tissue (scale bar: 100 μm). (e) Proportion of neutrophils analyzed by flow cytometry, with corresponding statistical graphs. (f) Hepatic mRNA expression of inflammatory cytokines (IL-1β, TNF-α, IL-6). (g) Relative expression of oxidative stress markers (MDA, SOD, GSH) in liver tissue. n = 6–8 per group. *p < 0.05, **p < 0.01, ***p < 0.001.
Figure 3.
Figure 3.
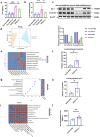
Lachnospiraceae bacterium modulates gut microbiota composition and increases metabolite N-Acetyl-glutamic acid. (a) Serum LPS levels. (b) Serum FITC-dextran levels. (c) Protein levels of ZO-1, occludin, and β-actin in ileum tissue with statistical analysis (Pair-fed+PBS vs Pair-fed+Lb vs EtOH+PBS vs EtOH+Lb). (d) PCoA plot of gut microbiota composition (based on Bray-Curtis distances). (e) Heatmap of species-level bacterial composition between EtOH+PBS and EtOH+Lb groups. (f) Histogram showing the relative abundance of Lachnospiraceae bacterium between EtOH+PBS and EtOH+Lb groups. (g) VIP plot of differential metabolites distinguishing EtOH+PBS and EtOH+Lb groups. (h) Histogram of NAG levels between EtOH+PBS and EtOH+Lb groups. (i) Heatmap showing Spearman’s correlation between gut microbiota and metabolites. (j) Portal vein serum NAG levels. n = 6–8 per group. *p < 0.05, **p < 0.01, ***p < 0.01. For (C): *p < 0.05, **p < 0.01 and ***p < 0.001 vs Pair-fed+PBS, #p < 0.05, ##p < 0.01, ###p < 0.001 vs EtOH+PBS.
Figure 4.
Figure 4.
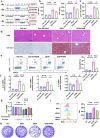
NAG confers profound protection against EtOH-induced liver injury in vivo and in vitro. (a) Schematic of experimental design. (b) Serum ALT and AST levels. (c) Hepatic TG levels. (d) Representative H&E and Oil red O staining of liver tissues (scale bar: 100 μm). (e) The proportion of neutrophils was analyzed by flow cytometry with statistical graph. (f) Hepatic mRNA expression levels of inflammatory markers IL-1β, TNF-α, and IL-6. (g) Cell viability assay after 48 hours of culture. (h) Cell clonogenic assay. (i) Cellular ROS assay with statistical analysis.
Figure 5.
Figure 5.
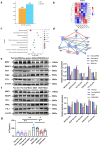
Lachnospiraceae bacterium and NAG inhibit ferroptosis in alcohol-associated steatohepatitis. (a) Histogram of differential proteins (VIP > 1, p < 0.05) between EtOH and EtOH+Lb groups. (b) Heatmap of differential proteins (VIP > 1, p < 0.05) between EtOH and EtOH+Lb groups. (c) KEGG-enriched pathway analysis. (d) PPI network of ferroptosis-related proteins. (e) Protein levels of NRF2, KEAP1, HO-1, TFRC, FTL1, and β-actin in liver tissue with statistical analysis (Pair-fed+PBS vs Pair-fed+Lb vs EtOH+PBS vs EtOH+Lb). (f) Protein levels of NRF2, KEAP1, HO-1, TFRC, FTL1, and β-actin in liver tissue with statistical analysis (Pair-fed vs Pair-fed+NAG vs EtOH vs EtOH+NAG). (g) Hepatic ferrous ion concentrations. n = 6–8 per group. *p < 0.05, **p < 0.01, ***p < 0.001. For (E, F): *p < 0.05, **p < 0.01 and ***p < 0.001 vs Pair-fed+PBS/Pair-fed, #p < 0.05, ##p < 0.01, ###p < 0.001 vs EtOH+PBS/EtOH. Animal model: n = 6–8 per group; Cell model: n = 3 per group. *p < 0.05, **p < 0.01, ***p < 0.001.
Figure 6.
Figure 6.
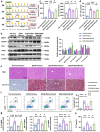
KEAP1-NRF2 pathway mediates NAG-exerted hepatoprotection against alcohol-associated steatohepatitis. (a) Experimental timeline for treatments (Yellow arrows indicate gavage with DMSO or ML385 every other day). (b) Protein levels of NRF2, KEAP1, HO-1, TFRC, FTL1, and β-actin with statistical analysis (Pair-fed+vehicle vs EtOH+Vehicle vs EtOH+NAG+Vehicle vs EtOH+NAG+ML385). (c) Serum ALT and AST levels. (d) Hepatic TG levels. (e) Representative H&E and Oil red O staining of liver tissues (scale bar: 100 μm). (f) The proportion of neutrophils was analyzed by flow cytometry with statistical graph. (g) Hepatic mRNA expression levels of IL-1β, TNF-α, and IL-6. (h) Hepatic ferrous ion concentrations. n = 6–8 per group. *p < 0.05, **p < 0.01, ***p < 0.001. For (B): *p < 0.05, **p < 0.01, ***p < 0.001 vs Pair-fed+vehicle, #p < 0.05, ##p < 0.01, ###p < 0.001 vs EtOH+Vehicle, &p < 0.05, &&p < 0.01, &&&p < 0.001 vs EtOH+NAG+Vehicle.

Similar articles

References

    1. Mackowiak B, Fu Y, Maccioni L, Gao B.. Alcohol-associated liver disease. J Clin Invest. 2024;134(3):134. doi: 10.1172/JCI176345. - DOI - PMC - PubMed
    1. Thursz M, Lingford-Hughes A. Advances in the understanding and management of alcohol-related liver disease. BMJ. 2023;383:e077090. doi: 10.1136/bmj-2023-077090. - DOI - PubMed
    1. Hernández-Évole H, Jiménez-Esquivel N, Pose E, Bataller R. Alcohol-associated liver disease: epidemiology and management. Ann Hepatol. 2024;29(1):101162. doi: 10.1016/j.aohep.2023.101162. - DOI - PubMed
    1. Room R, Callinan S, Greenfield TK, Rekve D, Waleewong O, Stanesby O, Thamarangsi T, Benegal V, Casswell S, Florenzano R, et al. The social location of harm from others’ drinking in 10 societies. Addict. 2019;114(3):425–19. doi: 10.1111/add.14447. - DOI - PMC - PubMed
    1. Griswold MG, Fullman N, Hawley C, Arian N, Zimsen SRM, Tymeson HD, Venkateswaran V, Tapp AD, Forouzanfar MH, Salama JS, et al. Alcohol use and burden for 195 countries and territories, 1990–2016: a systematic analysis for the global burden of disease study 2016. Lancet. 2018;392(10152):1015–1035. doi: 10.1016/S0140-6736(18)31310-2. - DOI - PMC - PubMed

LinkOut - more resources