

Association of Serum Uric Acid With Relative Muscle Loss: A US Population-Based Cross-Sectional Study
- PMID: 40511540
- PMCID: PMC12163516
- DOI: 10.1002/jcsm.13867
Association of Serum Uric Acid With Relative Muscle Loss: A US Population-Based Cross-Sectional Study
Abstract
Background: Evidence regarding serum uric acid (SUA) and sarcopenia remains insufficient and controversial. Muscle mass is a basic and objective component of sarcopenia, and relative muscle loss has been used to define sarcopenia in some studies. We sought to investigate the association of SUA levels with relative muscle loss in the National Health and Nutrition Examination Survey (NHANES) 2011-2018.
Methods: Relative muscle loss was defined by the Foundation for the National Institutes of Health (FNIH) as characterized by appendicular lean mass (ALM) adjusted by BMI (ALM/BMI) < 0.512 for women and < 0.789 for men. Multivariate logistic regression models were performed, and sample weights were accounted to reflect the nationally representative estimates. Restricted cubic spline regression was performed to visualize the dose-response relationship.
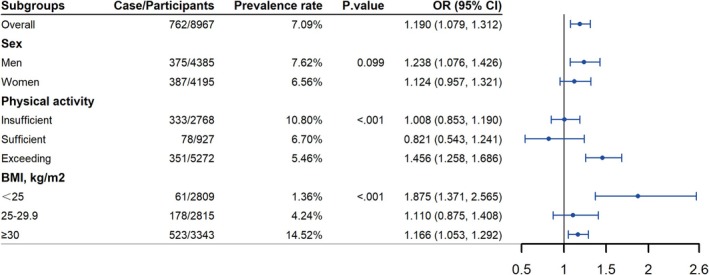
Results: A total of 8967 individuals (mean age 39.4 ± 0.3 years, female 50.1%) were included, with a mean SUA of 5.3 ± 0.02 mg/dL; 762 patients with relative muscle loss (weight prevalence 7.1%) were identified, and participants in the highest quintile of SUA exhibited the highest prevalence, up to 10.5%, while participants in the lowest quintile presented the lowest prevalence (5.3%). After adjusting for sociodemographic, behavioural factors, morbidities and renal function related indicators, participants in the highest quintile of SUA levels presented an elevated risk of relative muscle loss, with OR of 1.78 (95% CI: 1.24, 2.56), as compared with the lowest quintile. This association remained stable across most subgroups, and stronger associations were observed in groups with BMI < 25 kg/m2 and exceeding recommended physical activity levels (p for interaction < 0.05). Notably, a nonlinear association between SUA and relative muscle loss was observed in the overall populations, whereas a linear association was observed in men, participants with BMI < 25 kg/m2, and participants with exceeding recommended physical activity levels, with the risk of relative muscle loss increasing as SUA levels increased (p for overall < 0.01 and p for nonlinear > 0.05).
Conclusions: In summary, this study revealed that elevated SUA levels are a potentially independent risk factor of relative muscle loss among the US adults. Clinical screening for SUA levels may contribute to early detection and prevention of muscle loss.
Keywords: dose–response relationship; oxidative stress; relative muscle loss; sarcopenia; serum uric acid.
© 2025 The Author(s). Journal of Cachexia, Sarcopenia and Muscle published by Wiley Periodicals LLC.
Conflict of interest statement
The authors declare no conflicts of interest.
Figures


References
-
- Sayer A. A., Cooper R., Arai H., et al., “Sarcopenia,” Nature Reviews. Disease Primers 10, no. 1 (2024): 68. - PubMed
-
- Carvalho do Nascimento P. R., Bilodeau M., and Poitras S., “How Do We Define and Measure Sarcopenia? A Meta‐Analysis of Observational Studies,” Age and Ageing 50, no. 6 (2021): 1906–1913. - PubMed
-
- Vareldzis R., Perez A., and Reisin E., “Hyperuricemia: An Intriguing Connection to Metabolic Syndrome, Diabetes, Kidney Disease, and Hypertension,” Current Hypertension Reports 26, no. 6 (2024): 237–245. - PubMed
MeSH terms
Substances
Grants and funding
LinkOut - more resources
Full Text Sources
