. 2025 Jun;18(2):e70051.
doi: 10.1002/tpg2.70051.

Identification of significant genome-wide associations and QTL underlying variation in seed protein composition in pea (Pisum sativum L.)

Affiliations

Identification of significant genome-wide associations and QTL underlying variation in seed protein composition in pea (Pisum sativum L.)

Ahmed O Warsame et al. Plant Genome. 2025 Jun.

Abstract

Pulses are a valuable source of plant proteins for human and animal nutrition and have various industrial applications. Understanding the genetic basis for the relative abundance of different seed storage proteins is crucial for developing cultivars with improved protein quality and functional properties. In this study, we employed two complementary approaches, genome-wide association study (GWAS) and quantitative trait locus (QTL) mapping, to identify genetic loci underlying seed protein composition in pea (Pisum sativum L.). Sodium dodecyl sulfate-polyacrylamide gel electrophoresis was used to separate the seed proteins, and their relative abundance was quantified using densitometric analysis. For GWAS, we analyzed a diverse panel of 209 accessions genotyped with an 84,691 single-nucleotide polymorphism (SNP) array and identified genetic loci significantly associated with globulins, such as convicilin, vicilin, legumins, and non-globulins, including lipoxygenase, late embryogenesis abundant protein, and annexin-like protein. Additionally, using QTL mapping with 96 recombinant inbred lines, we mapped 11 QTL, including five that overlapped with regions identified by GWAS for the same proteins. Some of the significant SNPs were within or near the genes encoding seed proteins and other genes with predicted functions in protein biosynthesis, trafficking, and modification. This comprehensive genetic mapping study serves as a foundation for future breeding efforts to improve protein quality in pea and other legumes.


Conflict of interest statement

The authors declare no conflicts of interest.

Figures

FIGURE 1
FIGURE 1
One‐dimensional sodium dodecyl sulfate‐polyacrylamide gel electrophoresis (SDS‐PAGE) profile of pea seed proteins (∼20–100 kDa) run under reducing conditions using 10% Bis‐Tris gels. Lane 1: molecular weight standard (Abcam AB116029); lane 2: total seed protein extract from accession number JI0072. Protein identity was determined using non‐LC–MS/MS (where LC–MC is liquid chromatography–mass spectrometry) and the Caméor genome v1protein database (https://urgi.versailles.inra.fr/Species/Pisum/Pea‐Genome‐project). The short name of the proteins (band ID) is used in this study for convenience, and proteins belonging to the same class are suffixed with numbers based on the order in which they appear on the gel.
FIGURE 2
FIGURE 2
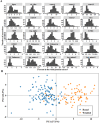
Variation in seed protein composition in the pea diversity panel. (A) Histograms of the relative abundances of 25 polypeptides. The data were based on the adjusted means of 196 accessions grown in the field during 2021 and 2022. Relative proportions were calculated densitometrically for each protein band based on the total protein intensity in each gel lane. (B) Principal component analysis based on the data in (A), showing two clusters representing round and wrinkled (sbe1 or rr) accessions.
FIGURE 3
FIGURE 3
Population structure of the 209 pea accessions used in this study. (A) Ancestry proportions predicted using fastSTRUCTURE software. (B) Population genetic structure predicted by the snmf algorithm in the LEA R package, with k ranging from 1 to 20. The k value with the lowest cross‐entropy (k = 18, marked by a red arrow) represents the number of sub‐populations in the panel. (C) Population stratification based on principal component analysis, where accessions are colored according to clusters identified by fastSTRUCTURE software.
FIGURE 4
FIGURE 4
Single‐nucleotide polymorphism (SNPs) in the chromosome 3 region flanking the R locus that had significant associations with 14 abundant seed proteins. (A) The 90–120 Mb segment of chromosome 3 showing the positions of SNPs significantly associated with different proteins during 2021 and 2022. Also shown is the location of ABA‐insensitive 5 (ABI5), Det, R, and Tl, which control globulin composition, indeterminacy, seed shape, and tendrils in pea, respectively. (B and C) Heatmaps showing the linkage disequilibrium (LD) of SNPs within the chromosomal segment based on 72 accessions of wrinkled and round pea. LD is expressed as the squared correlation (R 2) between the alleles of SNPs, and the red color in the heatmap denotes regions with a high LD. The blue asterisks in the heatmaps indicate the location of the SNP closest to the R locus.
FIGURE 5
FIGURE 5
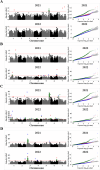
Genome‐wide association study (GWAS) analysis of the relative abundance of convicilin polypeptides during 2021 and 2022. Manhattan plots (left) and quantile–quantile (QQ) plots (right) for (A) convc1, (B) convc2, (C) convc3, and (D) convc5. The solid horizontal line is the GWAS significance threshold corresponding to the false discovery rate (FDR) at p = 0.05, whereas the dotted line is the threshold for suggestive association at p = 0.1. Single‐nucleotide polymorphisms (SNPs) above the significance threshold in the Manhattan plots and the QQ plots are colored by GWAS model, with red, blue, and green denoting results from Bayesian information and Linkage disequilibrium iteratively Nested Keyway (BLINK), fixed and random model circulating probability unification (FarmCPU), and settlement of MLM under progressively exclusive relationship (SUPER), respectively.
FIGURE 6
FIGURE 6
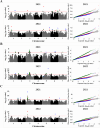
Genome‐wide association study (GWAS) analysis of the relative abundance of vicilin polypeptides in 2021 and 2022 Manhattan plots (left) and quantile–quantile (QQ) plots (right) for (A) vic1, (B) vic2, and (C) vic3. The solid horizontal line is the GWAS significance threshold corresponding to the false discovery rate (FDR) at p = 0.05, whereas the dotted line is the threshold for suggestive association at p = 0.1. Single‐nucleotide polymorphisms (SNPs) above the significance threshold in the Manhattan plots and the QQ plots are colored by GWAS model, with red, blue, and green denoting results from Bayesian information and Linkage disequilibrium iteratively Nested Keyway (BLINK), fixed and random model circulating probability unification (FarmCPU), and settlement of MLM under progressively exclusive relationship (SUPER), respectively.
FIGURE 7
FIGURE 7
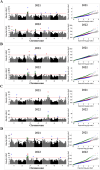
Genome‐wide association study (GWAS) analysis of relative abundance of non‐globulin seed proteins during the 2021 and 2022 seasons. Manhattan plots (left) and quantile–quantile (QQ) plots (right) for (A) albumin (alb), (B) late embryogenesis abundant protein (LEA), (C) annexin‐like, and (D) ENR2 (where ENR is enoyl‐(acyl carrier protein) reductases). The solid horizontal line is the GWAS significance threshold corresponding to the false discovery rate (FDR) at p = 0.05, whereas the dotted line is the threshold for suggestive association at p = 0.1. Single‐nucleotide polymorphisms (SNPs) above the significance threshold in the Manhattan plots and the QQ plots are colored by GWAS model, with red, blue, and green denoting results from Bayesian information and Linkage disequilibrium iteratively Nested Keyway (BLINK), fixed and random model circulating probability unification (FarmCPU), and settlement of MLM under progressively exclusive relationship (SUPER), respectively.
FIGURE 8
FIGURE 8
Quantitative trait loci (QTL) identified for protein composition in a JI0281 × Caméor RIL population of 96 lines. Chromosome numbers and linkage groups are shown on the x‐axis for ease of comparison with other studies (for example, 1LG6 indicates chromosome 1 and the corresponding linkage group 6 in the genetic map). The horizontal dashed line indicates the logarithm of odds (LOD) threshold for significance at α ≤ 0.05. See Table 1 for details on the QTL mapping summary.

Similar articles

References

    1. Ajibola, C. F. , & Aluko, R. E. (2022). Physicochemical and functional properties of 2S, 7S, and 11S enriched hemp seed protein fractions. Molecules, 27(3), 1059. 10.3390/molecules27031059 - DOI - PMC - PubMed
    1. Alves‐Carvalho, S. , Aubert, G. , Carrère, S. , Cruaud, C. , Brochot, A.‐L. , Jacquin, F. , Klein, A. , Martin, C. , Boucherot, K. , Kreplak, J. , da Silva, C. , Moreau, S. , Gamas, P. , Wincker, P. , Gouzy, J. , & Burstin, J. (2015). Full‐length de novo assembly of RNA‐seq data in pea (Pisum sativum L.) provides a gene expression atlas and gives insights into root nodulation in this species. The Plant Journal, 84(1), 1–19. 10.1111/tpj.12967 - DOI - PubMed
    1. Barac, M. , Cabrilo, S. , Pesic, M. , Stanojevic, S. , Zilic, S. , Macej, O. , & Ristic, N. (2010). Profile and functional properties of seed proteins from six pea (Pisum sativum) genotypes. International Journal of Molecular Sciences, 11(12), 4974–4991. 10.3390/ijms11124973 - DOI - PMC - PubMed
    1. Bhattacharyya, M. K. , Smith, A. M. , Ellis, T. H. , Hedley, C. , & Martin, C. (1990). The wrinkled‐seed character of pea described by Mendel is caused by a transposon‐like insertion in a gene encoding starch‐branching enzyme. Cell, 60(1), 115–122. 10.1016/0092-8674(90)90721-p - DOI - PubMed
    1. Bhowmik, P. , Yan, W. , Hodgins, C. , Polley, B. , Warkentin, T. , Nickerson, M. , Ro, D. K. , Marsolais, F. , Domoney, C. , Shariati‐Ievari, S. , & Aliani, M. (2023). CRISPR/Cas9‐mediated lipoxygenase gene‐editing in yellow pea leads to major changes in fatty acid and flavor profiles. Frontiers in Plant Science, 14, 1246905. 10.3389/fpls.2023.1246905 - DOI - PMC - PubMed

LinkOut - more resources