

Bulk-level maps of pioneer factor binding dynamics during the Drosophila maternal-to-zygotic transition
- PMID: 40512118
- PMCID: PMC12268169
- DOI: 10.1242/dev.204460
Bulk-level maps of pioneer factor binding dynamics during the Drosophila maternal-to-zygotic transition
Abstract
Gene regulation by transcription factors (TFs) binding cognate sequences is of paramount importance. For example, the TFs Zelda (Zld) and GAGA factor (GAF) are widely acknowledged for pioneering gene activation during zygotic genome activation (ZGA) in Drosophila. However, quantitative dose/response relationships between bulk TF concentration and DNA binding, an event tied to transcriptional activity, remain elusive. Here, we map these relationships during ZGA: a crucial step in metazoan development. To map the dose/response relationship between nuclear concentration and DNA binding, we performed raster image correlation spectroscopy, a method that can measure biophysical parameters of fluorescent molecules. We found that, although Zld concentration increases during nuclear cycles 10 to 14, its binding in the transcriptionally active regions decreases, consistent with its function as an activator for early genes. In contrast, GAF-DNA binding is nearly linear with its concentration, which sharply increases during the major wave, implicating its involvement in the major wave. This study provides key insights into the properties of the two factors and puts forward a quantitative approach that can be used for other TFs to study transcriptional regulation.
Keywords: DNA binding; GAGA factor; Pioneer factors; Raster image correlation spectroscopy; Zelda; Zygotic genome activation.
© 2025. Published by The Company of Biologists.
Conflict of interest statement
Competing interests The authors declare no competing or financial interests.
Figures
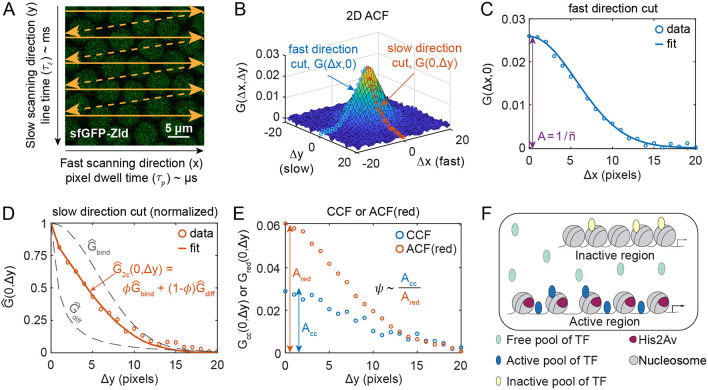
 and a diffusible ACF
  . The linear combination weight is φ, the immobile fraction. (E) Plots of cuts of the cross correlation function (CCF; blue circles) and of the ACF in the red channel (orange circles). The ratio of the amplitudes (Acc/Ared) is proportional to ψ, the fraction bound in active regions of the DNA. (F) Illustration of the different pools of TF: freely diffusible (light blue), bound to active regions (dark blue) and bound to inactive regions (yellow). His2Av (purple) is associated with the active regions of DNA.
Similar articles
-
Chip (Ldb1) is a putative cofactor of Zelda forming a functional bridge to CBP during zygotic genome activation.Mol Cell. 2025 Jun 19;85(12):2425-2441.e9. doi: 10.1016/j.molcel.2025.05.018. Epub 2025 Jun 9. Mol Cell. 2025. PMID: 40494353
-
Catalytic-dependent and independent functions of the histone acetyltransferase CBP promote pioneer-factor-mediated zygotic genome activation.Mol Cell. 2025 Jun 19;85(12):2409-2424.e8. doi: 10.1016/j.molcel.2025.05.009. Epub 2025 May 28. Mol Cell. 2025. PMID: 40441155
-
Short-Term Memory Impairment.2024 Jun 8. In: StatPearls [Internet]. Treasure Island (FL): StatPearls Publishing; 2025 Jan–. 2024 Jun 8. In: StatPearls [Internet]. Treasure Island (FL): StatPearls Publishing; 2025 Jan–. PMID: 31424720 Free Books & Documents.
-
Management of urinary stones by experts in stone disease (ESD 2025).Arch Ital Urol Androl. 2025 Jun 30;97(2):14085. doi: 10.4081/aiua.2025.14085. Epub 2025 Jun 30. Arch Ital Urol Androl. 2025. PMID: 40583613 Review.
-
EORTC guidelines for the use of erythropoietic proteins in anaemic patients with cancer: 2006 update.Eur J Cancer. 2007 Jan;43(2):258-70. doi: 10.1016/j.ejca.2006.10.014. Epub 2006 Dec 19. Eur J Cancer. 2007. PMID: 17182241
Cited by
-
Novel Fluorescent and Photoconvertible Fusions Reveal Dorsal Activator Dynamics.bioRxiv [Preprint]. 2025 Jul 23:2025.05.12.653543. doi: 10.1101/2025.05.12.653543. bioRxiv. 2025. PMID: 40462965 Free PMC article. Preprint.
References
-
- Al Asafen, H., Clark, N. M., Goyal, E., Jacobsen, T., Dima, S. S., Chen, H.-Y., Sozzani, R. and Reeves, G. T. (2024). Dorsal/NF-κB exhibits a dorsal-to-ventral mobility gradient in the Drosophila embryo. eLife 13, rp100462. 10.7554/eLife.100462.1 - DOI
-
- Bellec, M., Dufourt, J., Hunt, G., Lenden-Hasse, H., Trullo, A., Zine El Aabidine, A., Lamarque, M., Gaskill, M. M., Faure-Gautron, H., Mannervik, M.et al. (2022). The control of transcriptional memory by stable mitotic bookmarking. Nat. Commun. 13, 1176. 10.1038/s41467-022-28855-y - DOI - PMC - PubMed
MeSH terms
Substances
Grants and funding
LinkOut - more resources
Full Text Sources
Miscellaneous
