. 2025 Aug 1;13(8):1284-1302.
doi: 10.1158/2326-6066.CIR-24-0519.

Tumor Cell-Intrinsic Decr2 Regulates Ferroptosis and Immunotherapy Efficacy

Affiliations

Tumor Cell-Intrinsic Decr2 Regulates Ferroptosis and Immunotherapy Efficacy

Shuyin Li et al. Cancer Immunol Res. .

Abstract

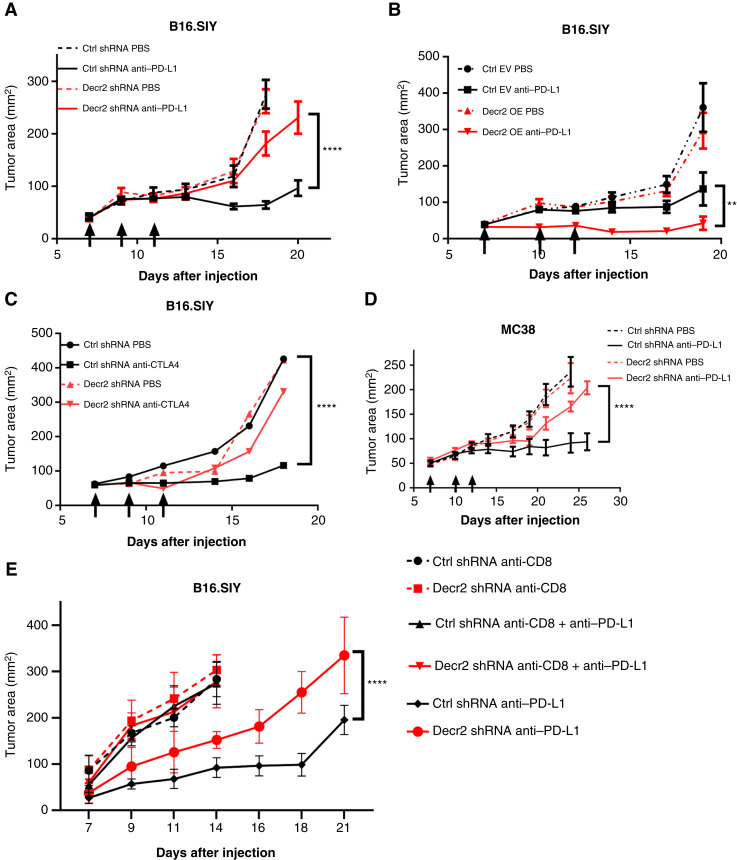
Immune checkpoint blockade therapies have transformed the landscape of cancer care, but durable clinical responses are achieved in only a subset of patients. To identify genes that can contribute to immunotherapy resistance, a genome-wide CRISPR screen was performed. Selection for mutants that are resistant to T cell-mediated killing identified the gene encoding Decr2, a peroxisomal 2,4-dienoyl-CoA reductase. We show that Decr2 in tumor cells participates in CD8+ T cell-mediated tumor cell killing and that Decr2 knockdown reduces the efficacy of anti-PD-L1 therapy in vivo. Knocking down Decr2 expression resulted in diminished ferroptosis that was associated with reduced induction of polyunsaturated ether phospholipids. Analysis of tumor RNA sequencing data from patients with melanoma revealed that upregulation of Decr2 was associated with anti-PD-1 efficacy, and patients with Decr2 gene deletions showed worse clinical outcomes. Our results identify Decr2 as a regulator of immunomediated tumor cell killing, with implications for improving immunotherapy efficacy.


Conflict of interest statement

H. Shah reports grants from the NCI during the conduct of the study. J. Trujillo reports grants from the NCI and Harold Amos Medical Faculty Development Program (AMFDP) of the Robert Wood Johnson Foundation during the conduct of the study. T.F. Gajewski reports grants from Bristol Myers Squibb and Merck, grants and personal fees from Pyxis, and personal fees from Allogene Therapeutics, Bicara Therapeutics, CatalYm, Samyang Biopharma, and Zai Lab outside the submitted work. No disclosures were reported by the other authors.

Figures

Figure 1.
Figure 1.
Identification of Decr2 gene as being critical for effector CD8+ T-cell killing through a genome-wide CRISPR screen. A, Diagram of genome-wide CRISPR screen. B, Enrichment score for the abundance of the top five most enriched sgRNAs for every gene after 2C CD8+ T-cell killing. C–E, Relative live cell percentage of tumor cells co-cultured with activated CD8+ T cells in vitro. Tumor cells expressing SIY peptide were co-cultured with pre-activated 2C transgenic CD8+ T cells, which specifically target SIY antigen for 16 hours at an effector:target ratio of 1. T cells were removed, and tumor cells were recovered for 48 hours in fresh medium. Live cell survival (%) was calculated from control cells unexposed to T-cell selection. C, Live cell percentage of B16.SIY control cells or the Decr2 KO clone. D, Live cell percentage of B16.SIY cells expressing control shRNA or Decr2 shRNAs. E, Live cell percentage of MC38.SIY cells expressing control shRNA or Decr2 shRNA. Data are combined from two independent experiments. Data are mean ± SD; statistical significance was determined using the two-tailed t test. **, P < 0.01; ***, P < 0.001; ****, P < 0.0001.
Figure 2.
Figure 2.
Decr2 expression levels modulate tumor sensitivity to checkpoint blockade immunotherapy in vivo. A–C, 2 × 10⁶ B16.SIY tumors cells were injected subcutaneously in C57BL/6 mice with or without checkpoint blockade immunotherapy treatment. Arrows indicate the days on which the mice received antibody therapy. A, Tumor area of B16.SIY control tumors (black) or Decr2 KD tumors (red) with or without anti–PD-L1 treatment. Data are mean ± SEM; n ≥ 7 mice per group; data are combined from two independent experiments. B, Tumor area of B16.SIY transduced with an empty vector (EV, black color) or Decr2 overexpression (OE) tumors (red color) with or without anti–PD-L1 treatment. Data are mean ± SEM; n ≥ 7 mice per group; data are combined from two independent experiments. C, Tumor area of B16.SIY control tumors (black) or Decr2 KD (red) tumors with or without anti-CTLA4 treatment. Data are mean ± SEM; n = 5 mice per group. D, Tumor area of MC38 control tumors (black) or Decr2 KD tumors (red) with or without anti–PD-L1 treatment. n ≥ 7 mice per group. E, Control (black) or Decr2 KD (red) B16.SIY tumor growth with or without anti–PD-L1 treatment in CD8+ T cell–depleted mice. Anti–CD8 antibody was intraperitoneally injected weekly, and anti–PD-L1 treatment was on days 7, 9, and 11. The control or Decr2 KD tumor growth treated with anti–PD-L1 in WT mice served as control groups. Data are mean ± SEM; n = 5 mice per group. P values determined using two-way ANOVA. **, P < 0.01; ****, P < 0.0001. Ctrl, control.
Figure 3.
Figure 3.
Decr2 KD B16.SIY tumors fail to show intratumoral expansion of SIY-specific CD8+ T cells after anti–PD-L1 treatment. A, The numbers of T cells secreting IFN-γ in response to SIY are shown. Splenocytes were isolated from B6 mice 7 days after B16.SIY tumor implantation. For detection of IFN-γ release, 106 splenocytes were stimulated with SIY peptide. Data are mean ± SD; n ≥ 9 mice per group; data combined from two independent experiments. B, The number of SIY antigen-specific CD8+ T-cell infiltration in control (black) or Decr2 KD (red) B16.SIY tumors on day 14 after tumor implantation. Data are mean ± SD; n ≥ 9 mice per group; data combined from two independent experiments. C, The number of alive B16.SIY tumors in B6 mice treated with or without anti–PD-L1. Data are mean ± SD; n ≥ 9 mice per group; data combined from two independent experiments. D and E, Tumor area of control (D) or Decr2 KD (E) B16.SIY tumors in WT B6 or Prf1 KO mice treated with anti–PD-L1 or PBS. Arrows indicate on which days mice received antibody therapy. Data are mean ± SEM; n = 5 mice per group. F, Tumor area of control or Decr2 overexpression B16.SIY tumors in Prf1 KO mice treated with anti–PD-L1 or PBS. Arrows indicate on which days mice received antibody therapy. Data are mean ± SEM; n = 5 mice per group. P values determined using the two-tailed t test (B, C) or two-way ANOVA (D, F). *, P < 0.05; **, P < 0.01; ****, P < 0.0001; ns, not significant. OE, overexpression.
Figure 4.
Figure 4.
Decr2 KD tumor cells are relatively resistant to ferroptosis inducers. A, B16.SIY cells expressing control or Decr2 shRNA were treated with RSL3 for 24 hours at various concentrations. The percentage of live cells was measured using Fixable Viability Dye staining. Data are from one representative study from two independent experiments. Data are mean ± SD. B, The percentage of live cells of B16.SIY tumors expressing control shRNA or Decr2 shRNA treated with different concentrations of Erastin for 24 hours. Data are from one representative study from two independent experiments. Data are mean ± SD. C, The percentage of live cells of B16.SIY tumors expressing control shRNA or Decr2 shRNA treated with different concentrations of ML210 for 24 hours. Data are from one representative study from two independent experiments. Data are mean ± SD. D, Viability of B16.SIY cells cultured with RSL3 (0.5 μmol/L) ± Fer-1 (2 μmol/L). Data are from one representative study from two independent experiments. Data are mean ± SD. E, Relative lipid ROS of B16.SIY tumor cells expressing control shRNA or Decr2 shRNA co-cultured with or without pre-activated 2C CD8+ T cells for 12 hours. Relative lipid ROS was measured using Liperfluo; the mean fluorescence intensity (MFI) is shown; n = 3 biological replicates. Data are from one representative study from two independent experiments. Data are mean ± SD. F, Relative lipid ROS of tumor cells expressing control shRNA or Decr2 shRNA ex vivo treated with or without anti–PD-L1 on day 14. n = 5 mice per group; data are from one representative study from two independent experiments. Data are mean ± SD. G, Volcano plots showing the changes in phospholipidome in the medium (left) or with RSL3 treatment (right): B16.SIY cells expressing control shRNA or Decr2 shRNA (n = 4). P value was determined using two-way ANOVA. H, The relative percentage of live cells in B16.SIY cells pretreated with AGPS-IN-2i for 24 hours and then treated with RSL3 (0.2 μmol/L). I, Plasmalogen levels with PUFA at sn-2 position in control-infected or Decr2 KD B16.SIY cells after RSL3 stimulation for 24 hours. Data are mean ± SD; P value was determined using the t test. J, Plasmalogen biosynthesis detection. B16.SIY cells were treated with DMSO or RSL3, and signals are normalized to the percent of the total of each respective class. Data are mean ± SD. P values determined using two-way ANOVA (A, B, C, F, G), the t test (D, H, I, J), and the two-tailed t test (E). *, P < 0.05; **, P < 0.01; ***, P < 0.001; ****, P < 0.0001; ns, not significant.
Figure 5.
Figure 5.
Ferroptosis can be induced by activated CD8+ T cells through IFN-γ. A, Experimental design. B, Relative fold change of lipid ROS in B16.SIY cells under different culture conditions. C, Relative fold change of lipid ROS in B16.SIY cells after blocking IFN-γ protein secreted by activated 2C CD8+ T cells. D, Relative lipid ROS of B16.SIY tumor cells co-cultured with or without pre-activated OT1 CD8+ T cells for 12 hours. Relative lipid ROS was measured by using Liperfluo; the mean fluorescence intensity (MFI) is shown; n = 3 biological replicates. Data are from one representative study from two independent experiments. E, Relative lipid ROS of IFN-γR2 KO or control B16.SIY tumor cells co-cultured with or without pre-activated 2C CD8+ T cells for 12 hours. Relative lipid ROS was measured by using Liperfluo; MFI is shown; n = 3 biological replicates. Data are from one representative study with two independent experiments. F, Relative Decr2 expression level of B16.SIY cells after being co-cultured with activated 2C CD8+ T cells or IFN-γ. G, Relative lipid ROS of B16.SIY tumor cells with or without IFN-γ treatment; MFI is shown; n = 3 biological replicates. H, The percentage of live cells in B16.SIY tumors expressing control shRNA, Decr2 shRNA, or Decr2 overexpression after IFN-γ treatment. Data are mean ± SD. P values determined using the two-tailed t test. **, P < 0.01; ***, P < 0.001; ****, P < 0.0001; ns, not significant.
Figure 6.
Figure 6.
Decr2 expression correlates with patient outcomes, and Slc7a11 is a candidate therapeutic target. A, Fold changes of Decr2 in matched pretherapy and on-therapy samples from patients with melanoma. B, Relationship between overall survival and mRNA expression level of Decr2 in human patients treated with ipilimumab. C,Decr2 deletion (deep and shallow) and Decr2 copy-number gain association with overall survival in response to ipilimumab. D, IF staining of human melanoma tissue sections. DECR2 (green), SOX10 (red), and DAPI (blue). Scale bar, 50 μm. E, Percentage of Decr2+Sox10+ cells and relative intensity of DECR2 expression in tissues of patients with melanoma: pretreatment or on-treatment with anti–PD-1. F, KD of Slc7a11 in Decr2-deficient tumor cells restores anti–PD-L1 efficacy. Control shRNA–infected tumors (in black), Decr2 single KD tumors (in red, labeled as Decr2 KD), and Decr2 Slc7a11 double KD (in blue, labeled as Decr2 Slc7a11 DKD). n ≥ 9 mice per group. G, The end timepoint of tumor area with or without anti–PD-L1 treatment. Control shRNA–infected tumors (in black), Decr2 single KD tumors (in red, labeled as Decr2 KD), Decr2 Slc7a11 double KD (in blue, labeled as Decr2 Slc7a11 DKD). P values are determined using the Mann–Whitney test (A), the two-tailed t test (C, E, G), and two-way ANOVA (F). *, P < 0.05; **, P < 0.01; ***, P < 0.001; ****, P < 0.0001; ns, not significant. CR, complete responder; PD, progressive disease; PR, partial responder; SD, stable disease.
Figure 7.
Figure 7.
Working model of how Decr2 facilitates ferroptosis in tumor cells.

References

    1. Farkona S, Diamandis EP, Blasutig IM. Cancer immunotherapy: the beginning of the end of cancer? BMC Med 2016;14:73. - PMC - PubMed
    1. Khalil DN, Smith EL, Brentjens RJ, Wolchok JD. The future of cancer treatment: immunomodulation, CARs and combination immunotherapy. Nat Rev Clin Oncol 2016;13:394. - PMC - PubMed
    1. Gajewski TF. Improved melanoma survival at last! Ipilimumab and a paradigm shift for immunotherapy. Pigment Cell Melanoma Res 2010;23:580–1. - PubMed
    1. Topalian SL, Hodi FS, Brahmer JR, Gettinger SN, Smith DC, McDermott DF, et al. Safety, activity, and immune correlates of anti-PD-1 antibody in cancer. N Engl J Med 2012;366:2443–54. - PMC - PubMed
    1. Spranger S, Bao R, Gajewski TF. Melanoma-intrinsic beta-catenin signalling prevents anti-tumour immunity. Nature 2015;523:231–5. - PubMed

Substances