. 2025 Jun 13;16(1):1088.
doi: 10.1007/s12672-025-02887-4.

Unraveling the interrelationship between breast cancer and endometriosis based on multi-omics analysis

Affiliations

Unraveling the interrelationship between breast cancer and endometriosis based on multi-omics analysis

Jie Yang et al. Discov Oncol. .

Abstract

Background: Endometriosis and breast cancer are significant global health burdens affecting women worldwide. Both conditions share notable characteristics including estrogen dependence, progressive growth patterns, recurrence tendencies, and metastatic potential. Despite these biological parallels, the molecular mechanisms connecting these conditions remain incompletely characterized. This study aimed to identify shared gene signatures and underlying molecular processes in breast cancer and endometriosis.

Methods: Expression matrices for both conditions were obtained from the Gene Expression Omnibus (GEO), UCSC Xena, and the Molecular Taxonomy of Breast Cancer International Consortium. Common differentially expressed genes (DEGs) were identified using the limma package. Comprehensive analyses included Gene Ontology (GO) and Kyoto Encyclopedia of Genes and Genomes (KEGG) pathway enrichment, machine learning-based diagnostic and prognostic model development, potential therapeutic compound screening, tumor immune microenvironment (TIME) characterization, and hub gene identification with subsequent validation.

Results: The analysis identified 47 common DEGs between breast cancer and endometriosis. Functional assessment of these genes revealed their involvement in critical biological processes including cell cycle regulation, oxidative stress response, and secretory granule and recycling endosome dynamics. Integration of comprehensive genomic and clinical data led to the development of a prognostic model for breast cancer and a diagnostic model for endometriosis.

Conclusion: This study provides molecular insights into shared pathogenic mechanisms underlying breast cancer and endometriosis, highlighting common physiological pathways and key regulatory genes. These findings offer novel perspectives for understanding disease pathogenesis and potential therapeutic interventions for both conditions.

Keywords: Breast cancer; Endometriosis; Hub genes; Machine learning; Multi-omics analysis.


Conflict of interest statement

Declarations. Competing interests: The authors declare no competing interests. Ethical approval: Ethics approval not required. Consent to participate: Not applicable. Consent to publish: Not applicable.

Figures
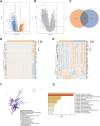
Fig. 1
Fig. 1
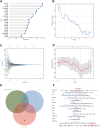
Differential expression analysis. A Volcano graph of the normal group and breast cancer group in differential analysis. B Volcano diagram for difference analysis of normal group and endometriosis. C Venn Figure for intersected genes in differentially expressed genes of breast cancer and endometriosis. D Heat map of differential analysis between breast cancer and normal group. E Heat map of differential analysis between endometriosis and normal group. F, G The GO terms and KEGG pathway enrichment analysis of common DEGs. GO, Gene Ontology; KEGG, Kyoto Encyclopedia of Genes and Genomes
Fig. 2
Fig. 2
Detection of diagnostic markers using machine-learning algorithms in endometriosis. A Based on RF algorithm to screen biomarkers. B Based on SVM-RFE to screen biomarkers. C, D LASSO logistic regression algorithm to screen diagnostic markers. E Venn diagram showed the intersection of diagnostic markers obtained by the three algorithms. F Nomogram is used to predict the occurrence of Endometriosis
Fig. 3
Fig. 3
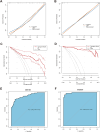
Verification of nomogram model for endometriosis. A, B Construction of the calibration curve for assessing the predictive efficiency of the nomogram model in both A GSE51981 and B GSE35287. C, D Decision curve analysis of risk prediction nomogram for endometriosis in both C GSE51981 and D GSE35287. E, F ROC curve validation of risk prediction nomogram for endometriosis in both E GSE51981 and F GSE35287
Fig. 4
Fig. 4
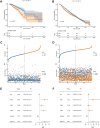
Construction and validation of a prognosis signature for breast cancer. A, B Overall survival in the low- and high-risk score group patients in A TCGA- breast cancer and B METABRIC. C, D Distribution of risk score according to the survival status and time in C TCGA- breast cancer and D METABRIC. E Univariate analysis for the clinicopathologic characteristics and risk score in TCGA- breast cancer. F Multivariate analysis for the clinicopathologic characteristics and risk score in TCGA- breast cancer. StepAIC: stepwise Akaike information criterion
Fig. 5
Fig. 5
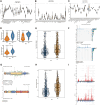
Dissection of tumor microenvironment based on prognosis signature. A The box plot of 28 infiltrated immune cell types was calculated by ssGSEA. B Box plot of expression levels of immune checkpoint-associated genes. C Box plot displaying the differences of 26 ssGSEA stemness scores between low risk and high-risk group. D Violin plot of significantly increased hypoxic score in high-risk patients. E Comparison of tumor mutation burden (TMB). F Oncoplot of mutation, deletion, insertion, and frameshift. G Comparison of different mutation sites of TP53 and PIK3CA. H The score of fraction of genome altered (FGA) in different risk groups. I Copy number variation (CNV) patterns in different risk cohorts. * p < 0.05; ** p < 0.01; *** p < 0.001; **** p < 0.0001
Fig. 6
Fig. 6
Efficacy of prognosis signature in predicting drug sensitivity. A Bubble plot of the relationship between drugs and model genes. Boxplots of the comparison of IC50 of drugs between high- and low-risk groups, and correlation between the IC50 and riskscore in TCGA- breast cancer cohort: B Lapatinib; C Temsirolimus; D Vinorelbine; E Cisplatin; F Paclitaxel; G Rapamycin
Fig. 7
Fig. 7
Biologic functions underlying the breast cancer prognostic model. A Volcano plot showed DEGs (FDR < 0.05 and |log2FC|> 1) between high risk and low-risk group. B PPI network of differentially expressed genes between high risk and low-risk group based on the Metascape website. C, D The GO terms and KEGG pathway enrichment analysis of differentially expressed genes. E Heatmap of GSVA analysis shows different biological functions between high risk and low-risk group. GO, Gene Ontology; KEGG, Kyoto Encyclopedia of Genes and Genomes
Fig. 8
Fig. 8
The expression of genes was verified by qRT-PCR and West-blotting. A The expression of SCHBP1 between breast cancer group and control group. B The expression of PMAIP1 between breast cancer group and control group. C The expression of LTF between breast cancer group and control group. D Protein expression levels of SCHBP1, PMAIP1 and LTF in breast cancer group 1 and control group. E Protein expression levels of SCHBP1, PMAIP1 and LTF in breast cancer group 2 and control group. * p < 0.05; ** p < 0.01; *** p < 0.001; **** p < 0.0001

Similar articles

References

    1. Zondervan KT, Becker CM, Koga K, Missmer SA, Taylor RN, Viganò P. Endometriosis. Nat Rev Dis Primers. 2018. 10.1038/s41572-018-0008-5. - PubMed
    1. Taylor HS, Kotlyar AM, Flores VA. Endometriosis is a chronic systemic disease: clinical challenges and novel innovations. Lancet. 2021;397(10276):839–52. 10.1016/s0140-6736(21)00389-5. - PubMed
    1. Geng R, Huang X, Li L, Guo X, Wang Q, Zheng Y, et al. Gene expression analysis in endometriosis: Immunopathology insights, transcription factors and therapeutic targets. Front Immunol. 2022. 10.3389/fimmu.2022.1037504. - PMC - PubMed
    1. Giudice LC, Endometriosis. N Engl J Med. 2010;362(25):2389–98. 10.1056/NEJMcp1000274. - PMC - PubMed
    1. Vercellini P, Viganò P, Somigliana E, Fedele L. Endometriosis: pathogenesis and treatment. Nat Reviews Endocrinol. 2013;10(5):261–75. 10.1038/nrendo.2013.255. - PubMed

LinkOut - more resources