. 2025 Jun 13;20(1):93.
doi: 10.1186/s11671-025-04276-w.

Nose to brain delivery of nanostructured lipid carriers loaded with rivastigmine and nilotinib for treating Alzheimer's disease: preparation, cell line study, and in vivo evaluation

Affiliations

Nose to brain delivery of nanostructured lipid carriers loaded with rivastigmine and nilotinib for treating Alzheimer's disease: preparation, cell line study, and in vivo evaluation

Saif Ahmad Khan et al. Discov Nano. .

Abstract

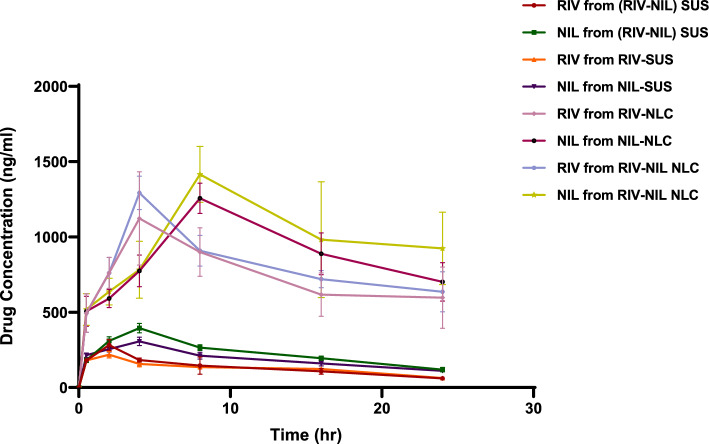
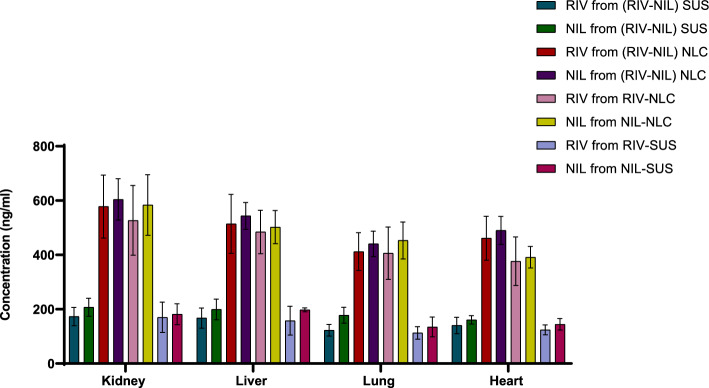
Alzheimer's disease (AD) is a complex neurodegenerative that affects over 55 million people worldwide, a number expected to double by 2050 due to aging populations. This growing prevalence imposes immense societal and economic burdens on healthcare systems and caregivers. AD is challenging to treat with monotherapy, making combination therapy a more effective approach. This study focuses on delivering Rivastigmine tartrate (RIV), and Nilotinib hydrochloride monohydrate (NIL), to the brain to achieve synergistic effects against AD. The optimal ratio of the drug combination was determined using the combination index that was performed using the Neuro2a cells line. It was found to be 1:1, emphasizing the synergistic effect against the cell lines. So, nanostructured lipid carriers (NLCs) were loaded with RIV and NIL, both individually and in combination, developed and optimized in this study. The developed formulations were thoroughly characterized for globule size, polydispersity index (PDI), and entrapment efficiency (EE) for each drug and the combination. The globule size was > 200 nm, PDI > 0.3; EE < 85% in all the developed formulations. On performing an in vitro cell availability study it was found that developed NLCs showed a 1.3 to 1.4-fold increase in the viability of the cells. On conducting an in vivo study, the concentration in the brain following administration of different formulations was in the order of RIV-NIL-NLC > NIL-NLC > RIV-NLC > RIV-NIL SUS > NIL-SUS > RIV-SUS. There was a 3.5 to 5-fold increase in the concentration of RIV and NIL in the brain when administered as RIV-NIL-NLC. So, it can be concluded that the NLCs with combined drugs showed promising results, enhancing drug permeability through the intranasal route, therefore could be used for treating AD.

Keywords: Alzheimer’s disease; Combination drugs; Nanostructured lipid carrier; Nilotinib hydrochloride monohydrate; Pharmacokinetic study; Rivastigmine tartrate.


Conflict of interest statement

Declarations. Competing interests: The authors declare no competing interests. Institutional review board statement: The animal study protocol was permitted by the Institutional Animal Ethical Committee (IAEC) (Jamia Hamdard, New Delhi, India).

Figures

Fig. 1
Fig. 1
Illustrates molecular docking between therapeutic molecules and the binding site of the receptor, wherein a dock pose of RIV at the binding site of Acetylcholine esterase (ACE) showing hydrogen bond interaction (red dotted line) with TYR 130 and ASP 172 and pi–pi interaction (turquoise dotted line) with TRP 84 and PHE 330 amino acid residues (PDB ID: 1ACJ, Docking scores: − 8.781 kcal/mol), b dock pose of NIL at the binding site of ACh esterase (ACE) showing pi–pi interaction (turquoise dotted line) with TRP 84, PHE 330, TYR 334, and TRP 279 amino acid residues (PDB ID: 1ACJ, Docking scores: − 8.890 kcal/mol), c dock pose of Tacrine (Cocrystal ligand) at the binding site of ACh esterase (AChE) showing hydrogen bond interaction (red dotted line) with HIS 440 and pi–pi interaction (turquoise dotted line) with TRP 84 and PHE 330 amino acid residues (PDB ID: 1ACJ, Docking scores: − 10.024 kcal/mol), and d the final structure alignment with favourable interaction or similar imitating interaction with tacrine co-crystal ligand shows the structure alignment with inhibitory effect towards the AChE. Superimposed dock poses of NIL with RIV and Tacrine at the binding site of AChE showing hydrogen bond interaction (red dotted line) and pi–pi interaction (turquoise dotted line)
Fig. 2
Fig. 2
Illustrates a 2D graph of % cell viability of N2a cell lines for a RIV, and b NIL performed for 24 h, wherein the curve between the concentration and mean (%) cell viability revealed the IC50 concentration of RIV and NIL at 125 µg/ml and 62.5 µg/ml. c 2D graph Dose effect Curve, and d 2D graph Combination index plot
Fig. 3
Fig. 3
Illustrates a the solubility of RIV and NIL in liquid lipids (medium-chain triglycerides and long-chain triglyceride) which showed that the maximum solubility of RIV and NIL was observed in Caproyl® PGMC of 52.62 ± 1.19 mg/ml and 54.47 ± 1.36 mg/ml. b The solubility of RIV and NIL in solid lipids which showed maximum solubility of RIV and NIL in Gelot®64 of 35.05 ± 2.55 mg/g and 36.40 ± 1.64 mg/g respectively and c Optimization of the compatible ratio of solid and liquid lipid using DSC thermograms d Sween 20 was determined to have the maximum transmittance i.e., 94.61 ± 2.08%.among the surfactants are chosen based on the emulsifier's emulsification capacity for the chosen BM
Fig. 3
Fig. 3
Illustrates a the solubility of RIV and NIL in liquid lipids (medium-chain triglycerides and long-chain triglyceride) which showed that the maximum solubility of RIV and NIL was observed in Caproyl® PGMC of 52.62 ± 1.19 mg/ml and 54.47 ± 1.36 mg/ml. b The solubility of RIV and NIL in solid lipids which showed maximum solubility of RIV and NIL in Gelot®64 of 35.05 ± 2.55 mg/g and 36.40 ± 1.64 mg/g respectively and c Optimization of the compatible ratio of solid and liquid lipid using DSC thermograms d Sween 20 was determined to have the maximum transmittance i.e., 94.61 ± 2.08%.among the surfactants are chosen based on the emulsifier's emulsification capacity for the chosen BM
Fig. 4
Fig. 4
Ishikawa diagram for the development of NLCs-RIV-NLC; NIL-NLC; and RIV-NIL NLC
Fig. 5
Fig. 5
Illustrates the effect of the combination of independent variables i.e., the concentration of lipidic mixture and surfactant, sonication time and concentration of the lipidic mixture, and lastly sonication time and concentration of the surfactant on the globule size, polydispersity index (PDI), % entrapment efficiency (%EE) of a RIV-NLC; b NIL-NLC and c RIV-NIL-NLC
Fig. 5
Fig. 5
Illustrates the effect of the combination of independent variables i.e., the concentration of lipidic mixture and surfactant, sonication time and concentration of the lipidic mixture, and lastly sonication time and concentration of the surfactant on the globule size, polydispersity index (PDI), % entrapment efficiency (%EE) of a RIV-NLC; b NIL-NLC and c RIV-NIL-NLC
Fig. 6
Fig. 6
Illustrates the a globule size and PDI of the optimized formulation of RIV-NIL-NLC showing that the size of RIV-NIL-NLC is within the desired range i.e., > 200 nm for the targeted delivery of the drug to the brain via intranasal route; however, the PDI indicates that the developed formulation was homogenous and stable, b Zeta Potential of the optimized formulation of RIV-NIL-NLC was found to be 0.814 mV which observed to be near 1 mV which must be due to the drug combination loaded in the NLC, and c transmission electron microscope of optimized RIV-NIL-NLC formulation showing the spherical-shaped globules appearing as dark, circular spots against a lighter background, possibly due to the differential scattering of electrons through the globule material
Fig. 6
Fig. 6
Illustrates the a globule size and PDI of the optimized formulation of RIV-NIL-NLC showing that the size of RIV-NIL-NLC is within the desired range i.e., > 200 nm for the targeted delivery of the drug to the brain via intranasal route; however, the PDI indicates that the developed formulation was homogenous and stable, b Zeta Potential of the optimized formulation of RIV-NIL-NLC was found to be 0.814 mV which observed to be near 1 mV which must be due to the drug combination loaded in the NLC, and c transmission electron microscope of optimized RIV-NIL-NLC formulation showing the spherical-shaped globules appearing as dark, circular spots against a lighter background, possibly due to the differential scattering of electrons through the globule material
Fig. 7
Fig. 7
DSC thermogram of a Placebo b RIV-NLC c NIL-NLC d RIV-NIL-NLC
Fig. 8
Fig. 8
FTIR spectra of a Placebo b RIV-NLC c NIL-NLC d RIV-NIL-NLC
Fig. 9
Fig. 9
Illustrates the %cell viability of drug suspension and NLCs against N2a cells, wherein %cell viability of RIV-NIL-NLC against N2a cells shows that the combination loaded NLC showed the highest %cell viability i.e., 66.53% at a concentration of 500.00 µg/ml in comparison to the RIV-NLC and NIL-NLC, which showed %cell viability of 65.76% and 63.53% respectively signifying the synergistic effect of the drug combination loaded NLC over the single drug loaded NLC and highlighting the least cytotoxicity of this combination
Fig. 10
Fig. 10
HPLC chromatogram for RIV and NIL simultaneous measurement with retention times of 2.28 min, and 3.39 min respectively
Fig. 11
Fig. 11
Illustrates the plasma drug concentration profile of RIV and NIL after intranasal administration of NLCs and suspension and the data are expressed as mean ± SD (n = 3) showing that the maximum amount of RIV and NIL was available from the NLCs at 4 h and 8 h, respectively. In contrast, the suspensions showed maximum concentrations of RIV and NIL were observed at 2 h and 4 h. ***p < 0.001, **p < 0.01, *p < 0.05 = Statistically significant compared to SUS
Fig. 12
Fig. 12
Illustrates the drug concentration profile of RIV and NIL in the brain after intranasal administration of NLCs and suspensions where the data are expressed as mean ± SD (n = 3) showing that the maximum amount of RIV and NIL released from the NLC at 4 h and 8 h, respectively. In contrast, in suspensions, the maximum concentrations of RIV and NIL were observed at 2 h and 4 h. ***p < 0.001, **p < 0.01, *p < 0.05 = Statistically significant compared to SUS
Fig. 13
Fig. 13
Illustrates the drug concentration profile of RIV and NIL in different organs after intranasal administration of RIV-SUS, NIL-SUS, RIV-NIL SUS, RIV-NLC, NIL-NLC, and RIV-NIL NLC in the rats. ***p < 0.001, **p < 0.01, *p < 0.05 = Statistically significant compared to SUS
Fig. 14
Fig. 14
Shows the in vitro hemolysis study presentation of the effect of positive, Triton X 1000, RIV-NLC, NIL-NLC, and RIV-NIL NLC

Similar articles

References

    1. Sheppard O, Coleman M. Alzheimer’s disease: etiology, neuropathology and pathogenesis. Alzheimer’s Disease Drug Discov. 2020. 10.36255/EXONPUBLICATIONS.ALZHEIMERSDISEASE.2020.CH1.
    1. Nichols E, Steinmetz JD, Vollset SE, et al. Estimation of the global prevalence of dementia in 2019 and forecasted prevalence in 2050: an analysis for the global burden of disease study 2019. Lancet Public Health. 2022;7:e105–25. 10.1016/S2468-2667(21)00249-8/ATTACHMENT/60E03FD1-38B2-4B40-A91D-9AFDDA22B45E/MMC1.PDF. - PMC - PubMed
    1. FDA approves treatment for adults with Alzheimer’s disease | FDA. https://www.fda.gov/drugs/news-events-human-drugs/fda-approves-treatment.... Accessed 8 Jan 2025
    1. Moreta MPG, Burgos-Alonso N, Torrecilla M, et al. Efficacy of acetylcholinesterase inhibitors on cognitive function in alzheimer’s disease. Rev Rev Biomed. 2021;9:1689. 10.3390/BIOMEDICINES9111689/S1. - PMC - PubMed
    1. Moura RP, Pacheco C, Pêgo AP, et al. Lipid nanocapsules to enhance drug bioavailability to the central nervous system. J Control Release. 2020;322:390–400. 10.1016/J.JCONREL.2020.03.042. - PubMed

LinkOut - more resources