. 2025 Jun 13;16(1):1089.
doi: 10.1007/s12672-025-02912-6.

A novel cuproptosis-associated LncRNA model predicting prognostic and immunotherapy response for glioma

Affiliations

A novel cuproptosis-associated LncRNA model predicting prognostic and immunotherapy response for glioma

Bo Lei et al. Discov Oncol. .

Abstract

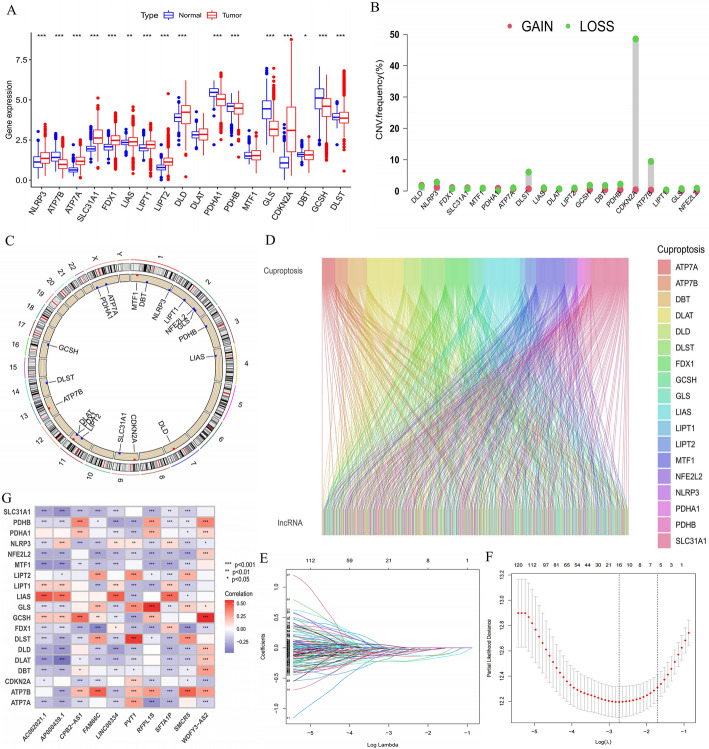
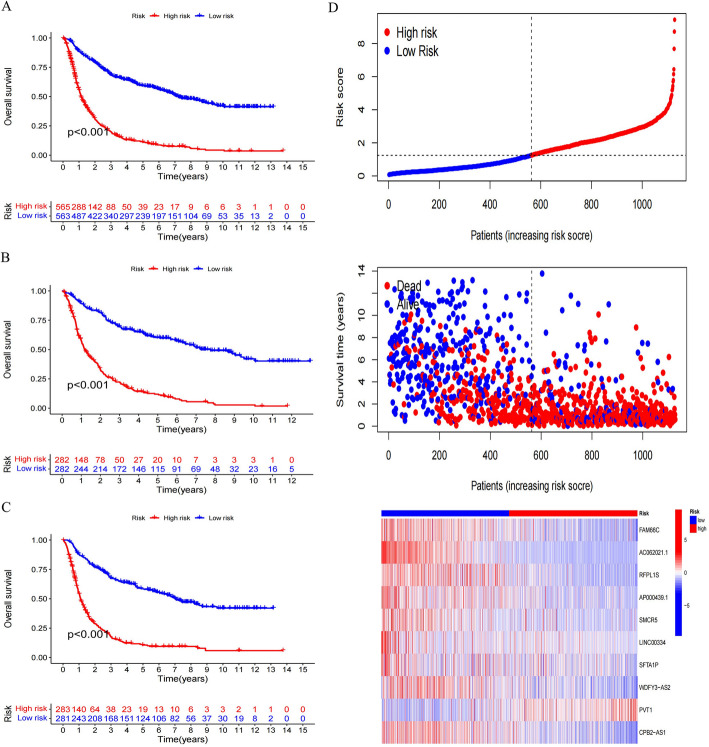
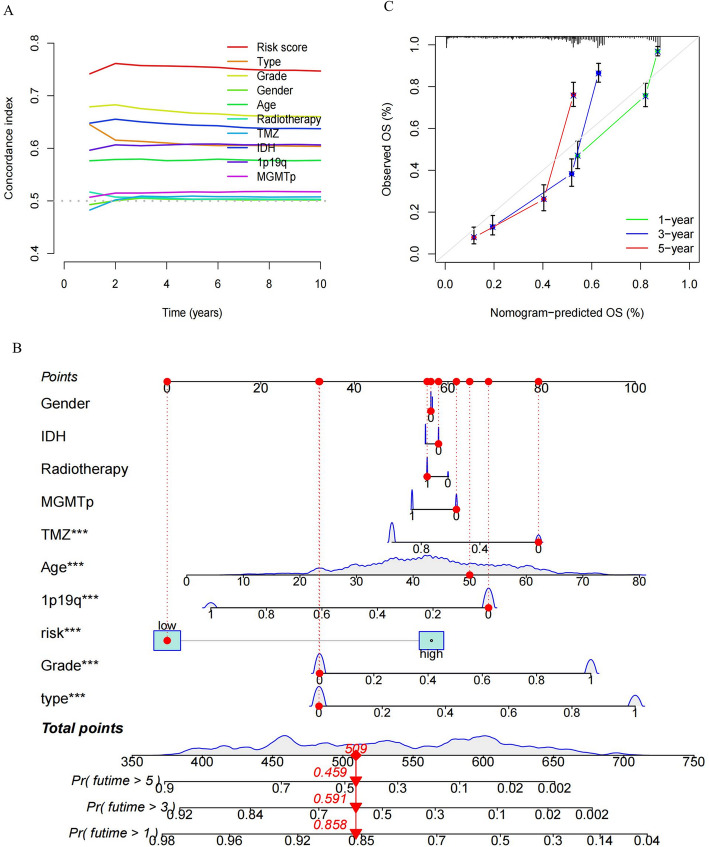
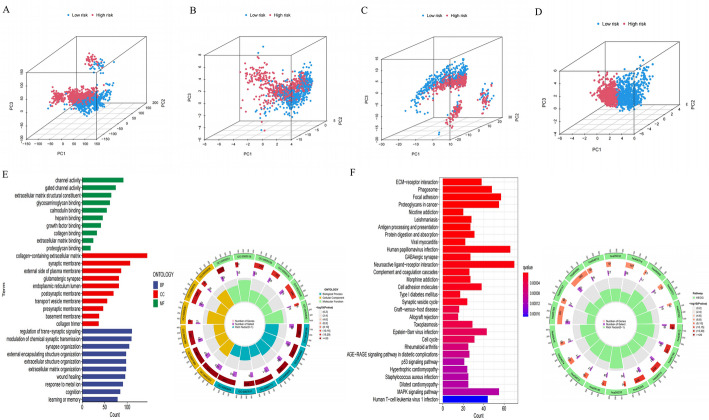
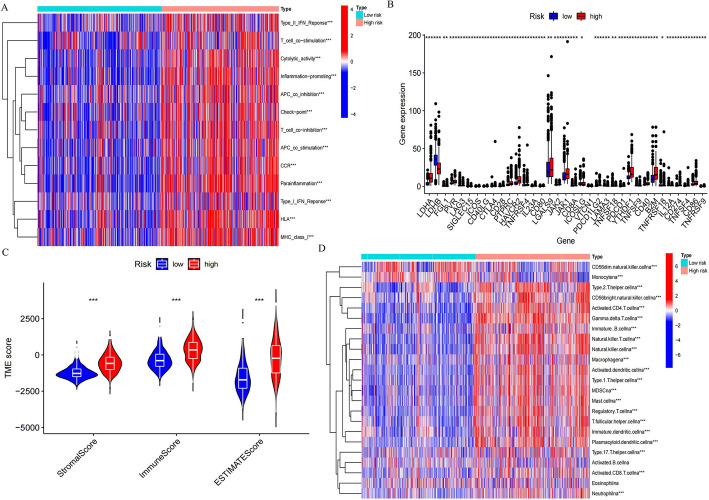
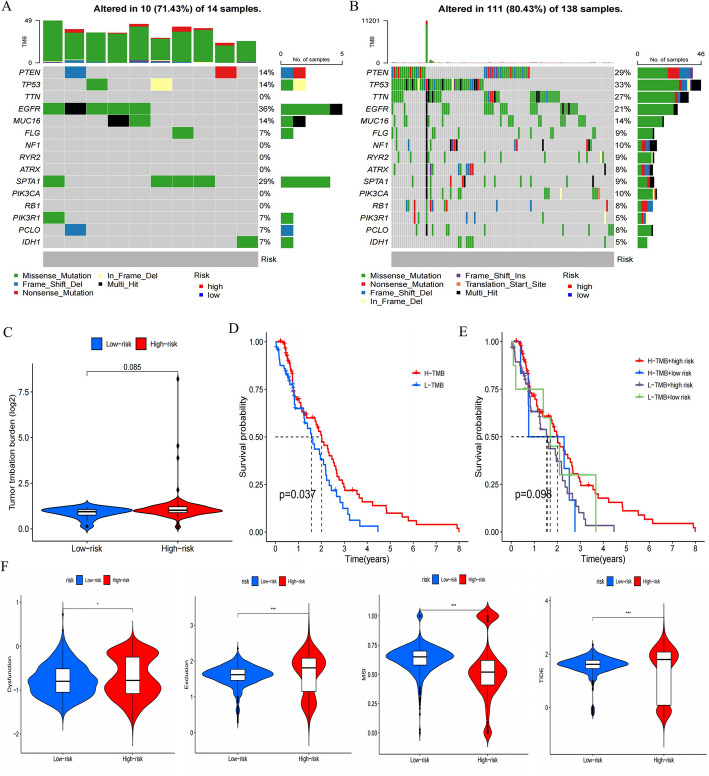
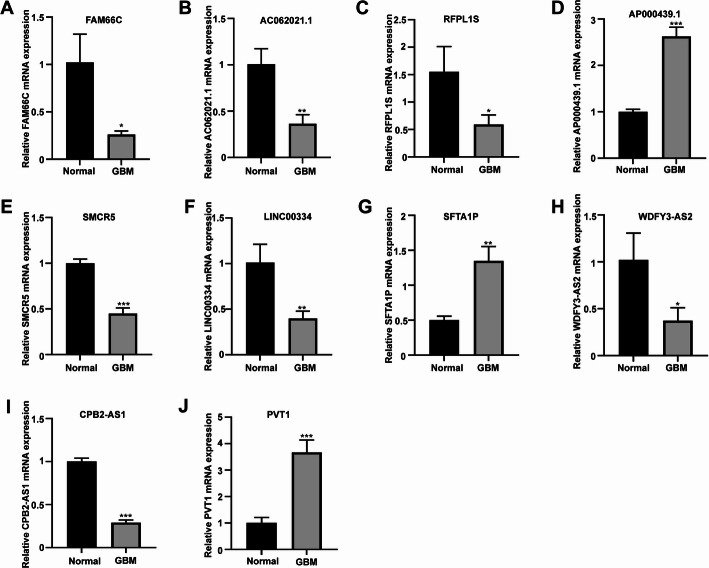
Recent studies have identified cuproptosis as a novel form of regulated cell death (RCD), and long non-coding RNAs (lncRNAs) have been implicated in glioma progression and prognosis. However, the role of cuproptosis-associated lncRNAs in gliomas has not been systematically assessed. In this study, data from the Cancer Genome Atlas (TCGA) and the Chinese Glioma Genome Atlas (CGGA) databases were used, and cuproptosis-related genes were obtained from previous research. Cuproptosis-associated lncRNAs were identified through co-expression network analysis, Cox regression, and Least Absolute Shrinkage and Selection Operator (LASSO). A total of 10 cuproptosis-associated lncRNAs were selected to construct a prognostic prediction model. The high-risk group was associated with poor overall survival (OS) and progression-free survival (PFS). Multivariate Cox regression, Receiver Operating Characteristic (ROC) curve analysis, C-index, and nomogram demonstrated the accuracy of the 10-lncRNA signature in predicting outcomes in glioma patients. Gene Ontology (GO), Kyoto Encyclopedia of Genes and Genomes (KEGG), and Gene Set Variation Analysis (GSVA) enrichment analyses revealed a strong association between the signature and immune response pathways. Immune cell infiltration and Single-Sample Gene Set Enrichment Analysis (ssGSEA) further confirmed that the signature is closely linked to immune responses in glioma patients. Further investigation revealed significant differences in tumor immune dysfunction and rejection (TIDE) scores and half-maximal inhibitory concentration (IC50) values for many drugs between low- and high-risk subgroups. This risk signature may serve as a prognostic tool and offer valuable insights into treatment strategies for glioma patients. Additionally, the expression levels of the 10 signature genes were validated by quantitative real-time polymerase chain reaction (qRT-PCR).

Supplementary Information: The online version contains supplementary material available at 10.1007/s12672-025-02912-6.

Keywords: Cuproptosis; Glioma; Immune microenvironment; LncRNA; Prognosis.


Conflict of interest statement

Declarations. Ethics approval and consent to participate: This study was approved by the Ethics Committee of Guizhou Provincial People’s Hospital. All procedures performed in this study involving human participants were in accordance with the ethical standards of the institutional research committee and with the 1964 Helsinki Declaration and its later amendments. Consent to publish: All patients provided consent for publication of anonymized data related to this study. Competing interests: The authors declare no competing interests. Informed consent: Written informed consent was obtained from all patients involved in the study.

Figures

Fig. 1
Fig. 1
Landscape of genetic and expression variation of cuproptosis-related genes in glioma and Establishment of Cuproptosis-associated lncRNA signatures. (A) Cuproptosis-related genes expressed in tumor and normal samples. (B) The frequency of CNV variation of Cuproptosis-related genes in TCGA-GBM and TCGA-LGG cohorts. green dot represented deletion frequency; red dot represented amplification frequency. (C) The location of CNV alteration of Cuproptosis-related genes on 23 chromosomes using TCGA-GBM and TCGA-LGG cohorts. (D) Sankey relationship diagram showed the co-expression of cuproptosis genes and cuproptosis-associated lncRNAs. (E) Partial likelihood deviance for each independent variable. (F) LASSO regression screened of cuproptosis-related lncRNAs. Dotted vertical lines were drawn at the optimal values by using the minimum criteria (G) Correlations between cuproptosis-related genes and cuproptosis-associated lncRNAs in our risk models using Spearman analysis. Blue represented negative correlation and positive correlation with red represented positive correlation. The asterisks represented the statistical p value (*P < 0.05; **P < 0.01; ***P < 0.001)
Fig. 2
Fig. 2
Kaplan–Meier survival analyses of patients and predicting the performance of characteristics. (A-C) Survival analyses for patients high risk and low risk groups in the all cohort (A), training cohort (B) and testing cohort (C) using Kaplan-Meier curves (P < 0.001, Log-rank test). (D) The risk score, survival status, and expression profile of 10 cuproptosis-related lncRNAs prognostic signature in each patients in all cohort
Fig. 3
Fig. 3
The prognostic value of the signature for glioma. (A, B) The forest figure for Univariate (A) or Multivariate (B) Cox regression analysis showed that the risk score was independently associated with OS. (C) 1-, 3-, and 5-year area under the ROC curve (AUC) of risk score in the all cohort. (D-F) Prediction of 1- (D), 3- (E), and 5- (F) years ROC curves for the riskscore compared with other clinical characteristics
Fig. 4
Fig. 4
Nomogram and clinical subgroups for predicting glioma outcomes. (A) C-index curve of the risk score compared with other clinical characteristics. (B) Prognostic nomogram combining clinical variables and risk scores predicts 1-, 3-, and 5-years OS in patients with glioma. (C) Calibration curves for 1, 3, and 5 years showed the agreement between actual and predicted outcomes at 1, 3, and 5 years
Fig. 5
Fig. 5
PCA in both groups of patients and GO and KEGG analysis. (A-D) PCA analysis depicted the distribution of patients based on all genes (A), cuproptosis (B), all cuproptosis-associated lncRNAs (C), and Cuproptosis-associated lncRNA signatures in our model (D). (E) Gene Ontology (GO) enrichment analysis of the different expressed genes between two risk groups demonstrated the richness of molecular biological processes (BP), cellular components (CC), and molecular functions (MF). (F) KEGG enrichment analysis of the different expressed genes between two risk groups
Fig. 6
Fig. 6
Differences in the tumor immune microenvironment between the low- and high-risk groups. (A) ssGSEA scores of Immune-related functions in the low- and high-risk groups. (B) Immune checkpoint genes and Chemokines expression in the low- and high-risk groups. (C) Violin plots comparing StromalScore, ImmuneScore and ESTIMATEScore between the low- and high-risk groups, respectively. (D) The infiltration of 28 immune cells between low- and high-risk groups. The asterisks represented the statistical p value (*P < 0.05; **P < 0.01; ***P < 0.001)
Fig. 7
Fig. 7
TMB, TIDE, and Chemotherapeutic Sensitivity. (A, B) Waterfall plots of top 15 mutation genes in glioma for the low-risk (A) and high-risk groups (B). (C) TMB between the low-risk and high-risk groups. (D) Survival curves between the high- and low-TMB groups. (E) Survival curves for the high-TMB and low-TMB groups in GBM and a combined risk score. (F) TIDE, Dysfunction, Exclusion and MSI scores between the low- and high-risk groups
Fig. 8
Fig. 8
q-PCR analysis of 10 lncRNAs in glioma tissues in GBM and normal brain tissues. (A) FAM66C expression was lower in GBM tissues (GBM) compared to brain tissues (Normal). (B) AC062021.1 expression was lower in GBM compared to Normal. (C) RFPL1S expression was lower in GBM compared to Normal. (D) AP000439.1 expression was lower in GBM compared to Normal. (E) SMCR5 expression was higher in GBM compared to Normal. (F) LINC00334 expression was higher in GBM compared to Normal. (G) SFTA1P expression was higher in GBM compared to Normal. (H) WDFY3-AS2 expression was higher in GBM compared to Normal. (I) CPB2-AS1 expression was higher in GBM compared to Normal. (J) PVT1 expression was higher in GBM compared to Normal. (* P < 0.05, ** P < 0.01, *** P < 0.001)

Similar articles

References

    1. Ostrom QT, Price M, Neff C, Cioffi G, Waite KA, Kruchko C, Barnholtz-Sloan JS. CBTRUS statistical report: primary brain and other central nervous system tumors diagnosed in the united States in 2015–2019. Neuro Oncol. 2022;24(Supplement5):v1–95. 10.1093/neuonc/noac202. PMID: 36196752; PMCID: PMC9533228. - PMC - PubMed
    1. Komori T. Grading of adult diffuse gliomas according to the 2021 WHO classification of tumors of the central nervous system. Lab Invest. 2022;102(2):126–33. 10.1038/s41374-021-00667-6. PMID: 34504304. - PubMed
    1. Chen J, Han P, Dahiya S. Glioblastoma: Changing concepts in the WHO CNS5 classification. Indian J Pathol Microbiol. 2022;65(Supplement):S24–32. 10.4103/ijpm.ijpm_1109_21. PMID: 35562131. - PubMed
    1. Louis DN, Perry A, Wesseling P, et al. The 2021 WHO classification of tumors of the central nervous system: a summary. Neuro Oncol. 2021;23(8):1231–51. 10.1093/neuonc/noab106. - PMC - PubMed
    1. Baumert BG, Hegi ME, van den Bent MJ, et al. Temozolomide chemotherapy versus radiotherapy in high-risk low-grade glioma (EORTC 22033–26033): a randomised, open-label, phase 3 intergroup study. Lancet Oncol. 2016;17(11):1521–32. 10.1016/S1470-2045(16)30313-8. - PMC - PubMed

LinkOut - more resources