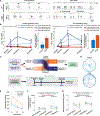
. 2025 Jun 24;44(6):115801.
doi: 10.1016/j.celrep.2025.115801. Epub 2025 Jun 11.

The amyloid precursor family of proteins in excitatory neurons are essential for regulating cortico-hippocampal circuit dynamics in vivo

Affiliations

The amyloid precursor family of proteins in excitatory neurons are essential for regulating cortico-hippocampal circuit dynamics in vivo

Samuel S Harris et al. Cell Rep. .

Abstract

The amyloid precursor protein (APP) family is ubiquitously expressed in the mammalian brain and implicated in Alzheimer's disease. APP family proteins participate in synaptic function and their absence impairs cognition. However, how these proteins regulate neural circuits and influence brain-behavior relationships remains unknown. Using in vivo two-photon Ca2+-imaging and Neuropixels, we show that APP family knockout (KO) in excitatory neocortical and hippocampal neurons suppresses neuronal dynamics across behavioral states, and results in an increased proportion of low-activity and silent neurons. Further, APP family KO leads to a reduction in synapses expressing the requisite N-methyl-D-aspartate receptor (NMDAR) subunit GluN1, with pharmacological enhancement of NMDAR function normalizing aberrant dynamics in low-activity neurons and rectifying behavioral impairments. Suppressing NMDAR function in control mice replicates the functional phenotype observed in APP family KOs. Our findings indicate a physiological role for the APP family in regulating and sustaining spontaneous neuronal activity in cortico-hippocampal circuits in vivo.

Keywords: Alzheimer’s disease; CP: Neuroscience; GluN1; NMDAR function; Neuropixels; amyloid precursor protein family; computational modeling; cortico-hippocampal circuits; slow-wave activity; spontaneous neuronal activity; two-photon Ca(2+)-imaging.


Conflict of interest statement

Declaration of interests B.T.H. owns stock in Novartis; he serves on the scientific advisory board of Dewpoint and has an option for stock. He serves on a scientific advisory board or is a consultant for AbbVie, Alexion, Ambagon, Aprinoia Therapeutics, Arvinas, Avrobio, AstraZeneca, Biogen, BMS, Cure Alz Fund, Cell Signaling, Dewpoint, Latus, Novartis, Pfizer, Sanofi, Sofinnova, Vigil, Violet, Voyager, and WaveBreak. His laboratory is supported in part by a sponsored research agreement from Abbvie. C.S.F. is currently employed by GSK.

Figures

Figure 1.
Figure 1.. Cortical neuron firing during awake rest is suppressed in the absence of the APP family
(A) Example in vivo two-photon fluorescence images of GCaMP8s-expressing layer 2/3 neurons in retrosplenial cortex of a control (left) and cTKO (right) mouse during awake rest. Right, spontaneous Ca2+ activity (dF/F) and deconvolved traces from five example neurons circled on the left for each genotype. Scale bar, 25 μm. (B) Probability distribution plot of single-neuron firing rates in layers 2/3 across genotypes (744 and 668 neurons from N = 4 control and 4 cTKO mice, respectively) highlighting a shift toward hypoactive firing rates in the cTKO condition. (C) Quantification of neuronal firing rates at the animal level revealing significantly reduced firing in cTKO mice relative to controls, t test, t(6) = −2.9, p = 0.03, each data point represents an individual animal, N = 4 mice per genotype. (D) Fraction of low-activity neurons, indicating increased prevalence of these neurons in cTKO mice versus controls, one-tailed t test, t(6) = 2.2, p = 0.035, each data point represents an individual animal, N = 4 mice per genotype. See also Figure S2 and Table S1.
Figure 2.
Figure 2.. Absence of the APP family attenuates neuronal dynamics in cortex and CA1 across awake behavioral states at the single neuron and population levels
(A) Left, schematic of Neuropixels implantation in awake animals alongside behavioral monitoring. Right, compound image of mesoSPIM light-sheet data, comprising DiI-labeled Neuropixels probe track (red) and brain structure, overlaid with spatially registered Allen CCF v3 atlas image and regions of interest (visual cortex and hippocampus CA1). (B) Example raster plots from all units in regions of interest during awake behavior in a control (top) and cTKO (bottom) mouse (sorted by average firing rate). (C) Units were classified into putative excitatory and inhibitory fast-spiking interneurons (FS INs) for each region of interest using Gaussian mixture modeling of spike waveform properties. Scale bar in insets, 0.5 ms. (D) Resting firing rates of excitatory high-activity neurons were reduced in cTKO mice versus controls in both cortex and CA1 (N = 8 controls, 6 cTKO). Data represent LME-model-derived estimates with standard errors, accounting for both fixed and random effects. Cortex, Control (from N = 8 mice): 43.4 ± 6.8 neurons/session/animal; cTKO (from N = 6 mice): 56.9 ± 14.1 neurons/session/animal. CA1, control (from N = 8 mice): 18 ± 3.5 neurons/session/animal; cTKO (from N = 6 mice): 23.3 ± 5.1 neurons/session/animal. (E) Significant difference in average locomotion speed between control and cTKO mice, Welch’s t test, t(5.3) = −3.44, p = 0.02, N = 7 control, N = 6 cTKO, one control mouse immobile during recordings. (F) Relationship between resting firing rates and firing rate modulation by locomotion (modulation index, MI), indicating that low-firing excitatory neurons in cortex and CA1 are particularly predisposed to relatively large changes in firing during locomotion. Each data-point represents an individual excitatory neuron from one example experimental session across animals (Cortex: n = 402 control neurons from 7 animals, n = 384 cTKO neurons from 6 animals, one control mouse immobile during recordings; CA1: n = 169 control neurons from 7 animals, n = 158 cTKO neurons from 6 animals) with the diameter of each marker indicating normalized locomotion speed. Horizontal lines indicate threshold for each resting state firing category (Low active, Normoactive and Highly active) and brain region. (G) The relationship between locomotion speed and neuronal firing rate modulation by locomotion (modulation index, MI) was significantly and consistently reduced in excitatory low-activity neurons of cTKO mice versus controls in both cortex and CA1. Data represent LME model estimates with standard errors, accounting for both fixed and random effects. Cortex, Control (from N = 7 mice, one animal immobile during recordings): 45.8 ± 7.4 neurons/session/animal; cTKO (from N = 6 mice): 57.6 ± 13.8 neurons/session/animal. CA1, Control (from N = 7 mice, one animal immobile during recordings): 19.1 ± 3.9 neurons/session/animal; cTKO (from N = 6 mice): 21.8 ± 5.3 neurons/session/animal. (H) Relative resting state LFP power in low-frequency (<30 Hz) and high-frequency (>30 Hz) bands were significantly decreased and increased, respectively, in cortex and CA1 of cTKO mice versus controls (each data point represents an individual animal). (D,G,H) p-values were obtained from LME models and provided as insets with statistical details provided in Tables S2–S4. See also Figure S2.
Figure 3.
Figure 3.. Neuronal firing impairments in cTKO mice are exacerbated during SWA with profound suppression and silencing of neurons
(A) Left, example in vivo two-photon fluorescence images of GCaMP6f-expressing layer 2/3 neurons in visual cortex of a control (left) and cTKO (right) mouse during SWA. (Right) Spontaneous Ca2+-activity (dF/F) from six example neurons circled on the left for each genotype. Scale bars, 10 μm. (B) Cumulative distribution plot displaying neuronal Ca2+-transient rates of individual neurons in layers 2/3 across genotypes (neurons from N = 4 control and N = 5 cTKO mice) and indicating a shift toward hypoactivity in the cTKO condition. (C) Quantification of neuronal Ca2+-transient rates at the animal level, showing neuronal hypoactivity in cTKO mice versus controls during SWA, N = 4 control, N = 5 cTKO, t test, t(7) = 9.7, p < 0.0001, each data point represents an individual animal. (D) Significant increase in the fraction of functionally silent neurons in cTKO mice compared with controls, N = 4 control, N = 5 cTKO, t test, t(7) = −7.6, p = 0.0001, each datapoint represents an individual animal. (E) Example raster plots of Neuropixels recordings from 40 randomly selected cortical (black) and CA1 (gray) units/neurons and cortical LFP traces in both hemispheres during SWA in a control mouse (left) and cTKO mouse (right). (F) Neuronal firing in excitatory neurons was significantly suppressed in cTKO mice versus controls in both cortex and CA1, each data-point represents an individual animal; N = 6 control, N = 4 cTKO; Cortex, t test, t(8) = 4.6, p = 0.002; CA1, t test, t(8) = 3.7, p = 0.006. (G) Significant attenuation of cross-hemispheric cortical mean phase coherence (MPC) in cTKO mice compared with controls (see also example in E, right panel; each data point represents an individual animal, N = 6 control, N = 4 cTKO, t test, t(8) = −5.51, p = 0.001). (H) The number of excitatory units/neurons identified across both hemispheres was significantly reduced in cTKO mice in cortex relative to controls, with a borderline reduction in CA1, each data point represents an individual animal, N = 6 control, N = 4 cTKO; Cortex: t test, t(8) = 3.6, p = 0.007; CA1: t test, t(8) = 2.2, p = 0.057. See also Figure S3.
Figure 4.
Figure 4.. Computational modeling implicates NMDAR deficits in cTKO mice
(A) (Left) Two-photon data (see Figures 3A–3C) from cortical layers 2/3 in control and cTKO mice were used to infer the fraction of NMDARs (rNMDA, model-derived activity rate of excitatory population given by ν¯E; see methods). (Right) cTKO mice were inferred to have a significantly smaller fraction of NMDARs, t test, t(7) = 3.5, p = 0.01. Each data point represents an individual animal (N = 4 controls, N = 5 cTKOs). (B and C) The theoretical excitatory kernel (see methods) was used to calculate the PSD for different ratios of NMDARs rNMDA. Reduced rNMDA, as inferred in cTKO mice, leads to a decrease in the relative band power at low frequencies and an increase at high frequencies, recapitulating that seen in empirical data from cTKO animals. See also Figure S4.
Figure 5.
Figure 5.. NMDARs support spontaneous neuronal activity in vivo, and NMDAR hypofunction induces functional phenotypes analogous to those observed in mice lacking the APP family
(A) Example raster plots from in vivo Neuropixels recordings of 40 randomly selected cortical (black) and CA1 (gray) units during SWA in a control mouse during baseline (no drug, left) and 45 min after administration of the NMDAR antagonist MK-801 (1 mg/kg, i.p., right). (B) Comparison of neuronal firing rates in individual cortical and CA1 neurons (N = 328 and N = 269, respectively, from 4 control mice) before and 45 min after MK-801 administration, indicating a widespread hypoactive effect by NMDAR antagonism. Each data point pair and bridge represents an individual unit with warmer colors indicating higher baseline firing rates. Top and bottom of boxplots indicate 75th and 25th percentiles, respectively. (C) (Top left) Example in vivo two-photon fluorescence images of jRCaMP1b-expressing layer 2/3 cortical neurons in visual area of WT mice during baseline (no drug, top middle) and at 45 min after administration of the NMDAR antagonist MK-801 (1 mg/kg, i.p., top right). Colored markers indicate mean levels of spontaneous Ca2+ activity in individual neurons with cool colors indicating hypoactivity. (Bottom) Spontaneous Ca2+ activity (dF/F) from three example neurons circled and numbered in top left panel, before (left) and after (right) MK-801 administration. (Right) Quantification of effect of MK-801 on spontaneous Ca2+ activity in layer 2/3, indicating a pronounced suppression and increase in silent neuron fraction by NMDAR antagonism (N = 143 neurons from four animals). Each data point pair and bridge indicates an individual neuron with warmer colors indicating higher baseline Ca2+-transient rates. Top and bottom of boxplots indicate 75th and 25th percentiles, respectively. (B and C) p values obtained from LME models and provided as insets with statistical details provided in Table S5. See also Figure S4.
Figure 6.
Figure 6.. Reduced synaptic GluN1 NMDAR subunit in cortex and CA1 of cTKO mice
(A) Immunofluorescence images showing PSD95 (green) and GluN1 (red) in cortex of control and cTKO mice. (B) Percentage of PSD95+ synapses that contain GluN1, indicating reduced synaptic GluN1 in cortex (retrosplenial and somatomotor) of cTKO mice compared with controls (each data point represents an individual animal, N = 4 control and N = 4 cTKO, error bars are SEM, t test, t(6) = 2.9, p = 0.029. (C) Immunofluorescence images showing PSD95 (green) and GluN1 (red) in medial CA1 of control and cTKO mice. (D) Percentage of PSD95+ synapses that contain GluN1, indicating reduced synaptic GluN1 in CA1 of cTKO mice versus controls (each data point represents an individual animal, N = 5 control, 4 cTKO, error bars are SEM, t test, t(7) = 2.4, p = 0.048. Scale bars, 10 μm. See also Figure S5.
Figure 7.
Figure 7.. NMDAR agonism ameliorates functional neuronal impairments and behavioral deficits associated with loss of the APP family
(A) Example raster plots from Neuropixels recordings of 40 randomly selected cortical (black) and CA1 (gray) units, and cortical LFP traces, in both hemispheres during SWA in a cTKO mouse under baseline conditions (no drug, left) and 20 min after the administration of the NMDA partial agonist DCS (30 mg/kg, i.p., right). (B) DCS treatment induced a significant and selective enhancement of firing rates in excitatory low-activity neurons of cTKO mice versus controls, in both cortex and CA1, with a distinctive non-linear treatment response that peaked at 20 min after DCS administration. Treatment response data over time represent mean normalized firing rates at the animal level (N = 3 control, N = 4 cTKO) with error bars as SEM. Inset bar graphs display LME model coefficient estimates, accounting for both fixed and random effects, with 95% confidence intervals (CIs) at 20 min after DCS (note no CI overlap between genotypes). Interaction p values obtained from LME models and provided as insets with full statistical details provided in Table S6. (C) Schematic describing open-field (OF) behavioral test protocol which incorporated a randomized, blinded, cross-over trial design to assess the impact of DCS on behavioral measures in control and cTKO mice (N = 6 per genotype). (D) Example movement paths of a control (top) and cTKO (bottom) mouse over 30 min within the circular OF arena. (E) Mean locomotor activity of cTKO mice in the OF arena over time was greater than control mice and normalized by DCS following a delay of approximately 10 min (i.e., 20 min following DCS administration). Error bars are SEM. (F and G) Quantification showing that DCS treatment specifically suppressed both locomotor hyperactivity and excessive stereotypy in cTKO mice relative to control animals and compared with the saline condition (each data point represents an individual animal, N = 6 control and N = 6 cTKO mice). Interaction p values obtained from LME models and provided as insets with full statistical details provided in Table S7. See also Figure S6.

References

    1. Kang J, Lemaire HG, Unterbeck A, Salbaum JM, Masters CL, Grzeschik KH, Multhaup G, Beyreuther K, and Müller-Hill B (1987). The precursor of Alzheimer’s disease amyloid A4 protein resembles a cell-surface receptor. Nature 325, 733–736. 10.1038/325733a0. - DOI - PubMed
    1. Goldgaber D, Lerman MI, McBride OW, Saffiotti U, and Gajdusek DC (1987). Characterization and chromosomal localization of a cDNA encoding brain amyloid of Alzheimer’s disease. Science (New York, N. Y.) 235, 877–880. 10.1126/science.3810169. - DOI - PubMed
    1. Tanzi RE, Gusella JF, Watkins PC, Bruns GA, St George-Hyslop P, Van Keuren ML, Patterson D, Pagan S, Kurnit DM, and Neve RL (1987). Amyloid beta protein gene: cDNA, mRNA distribution, and genetic linkage near the Alzheimer locus. Science (New York, N.Y.) 235, 880–884. 10.1126/science.2949367. - DOI - PubMed
    1. Glenner GG, and Wong CW (1984). Alzheimer’s disease: initial report of the purification and characterization of a novel cerebrovascular amyloid protein. Biochem. Biophys. Res. Commun 120, 885–890. 10.1016/s0006-291x(84)80190-4. - DOI - PubMed
    1. Sokol DK, Chen D, Farlow MR, Dunn DW, Maloney B, Zimmer JA, and Lahiri DK (2006). High levels of Alzheimer beta-amyloid precursor protein (APP) in children with severely autistic behavior and aggression. J. Child Neurol 21, 444–449. 10.1177/08830738060210062201. - DOI - PubMed

Substances

LinkOut - more resources