. 2025 Jun 24;44(6):115840.
doi: 10.1016/j.celrep.2025.115840. Epub 2025 Jun 12.

De-coupling immune parameters and toxicity associated with IL-12 agonism

Affiliations

De-coupling immune parameters and toxicity associated with IL-12 agonism

Zachary R Lanzar et al. Cell Rep. .

Abstract

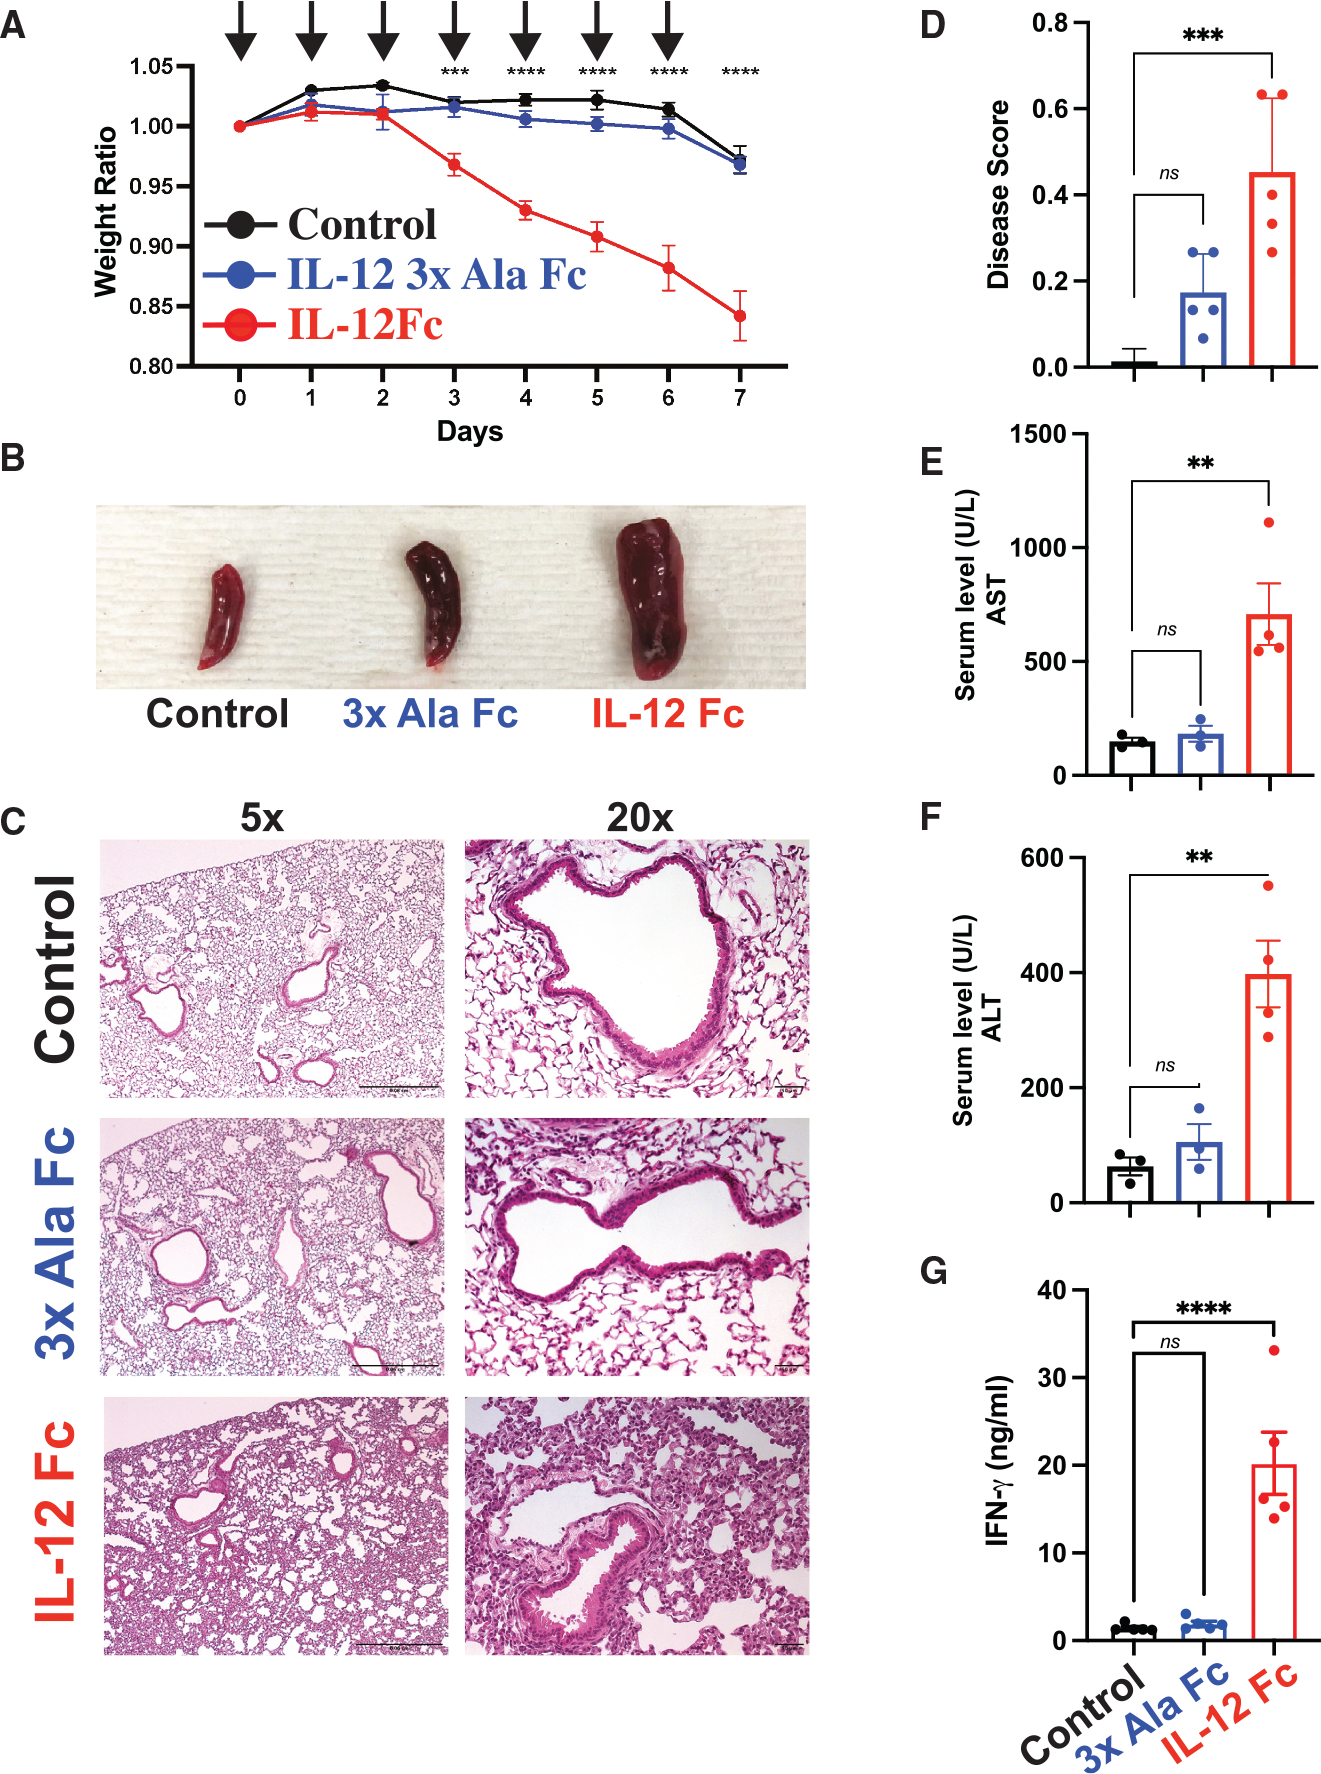
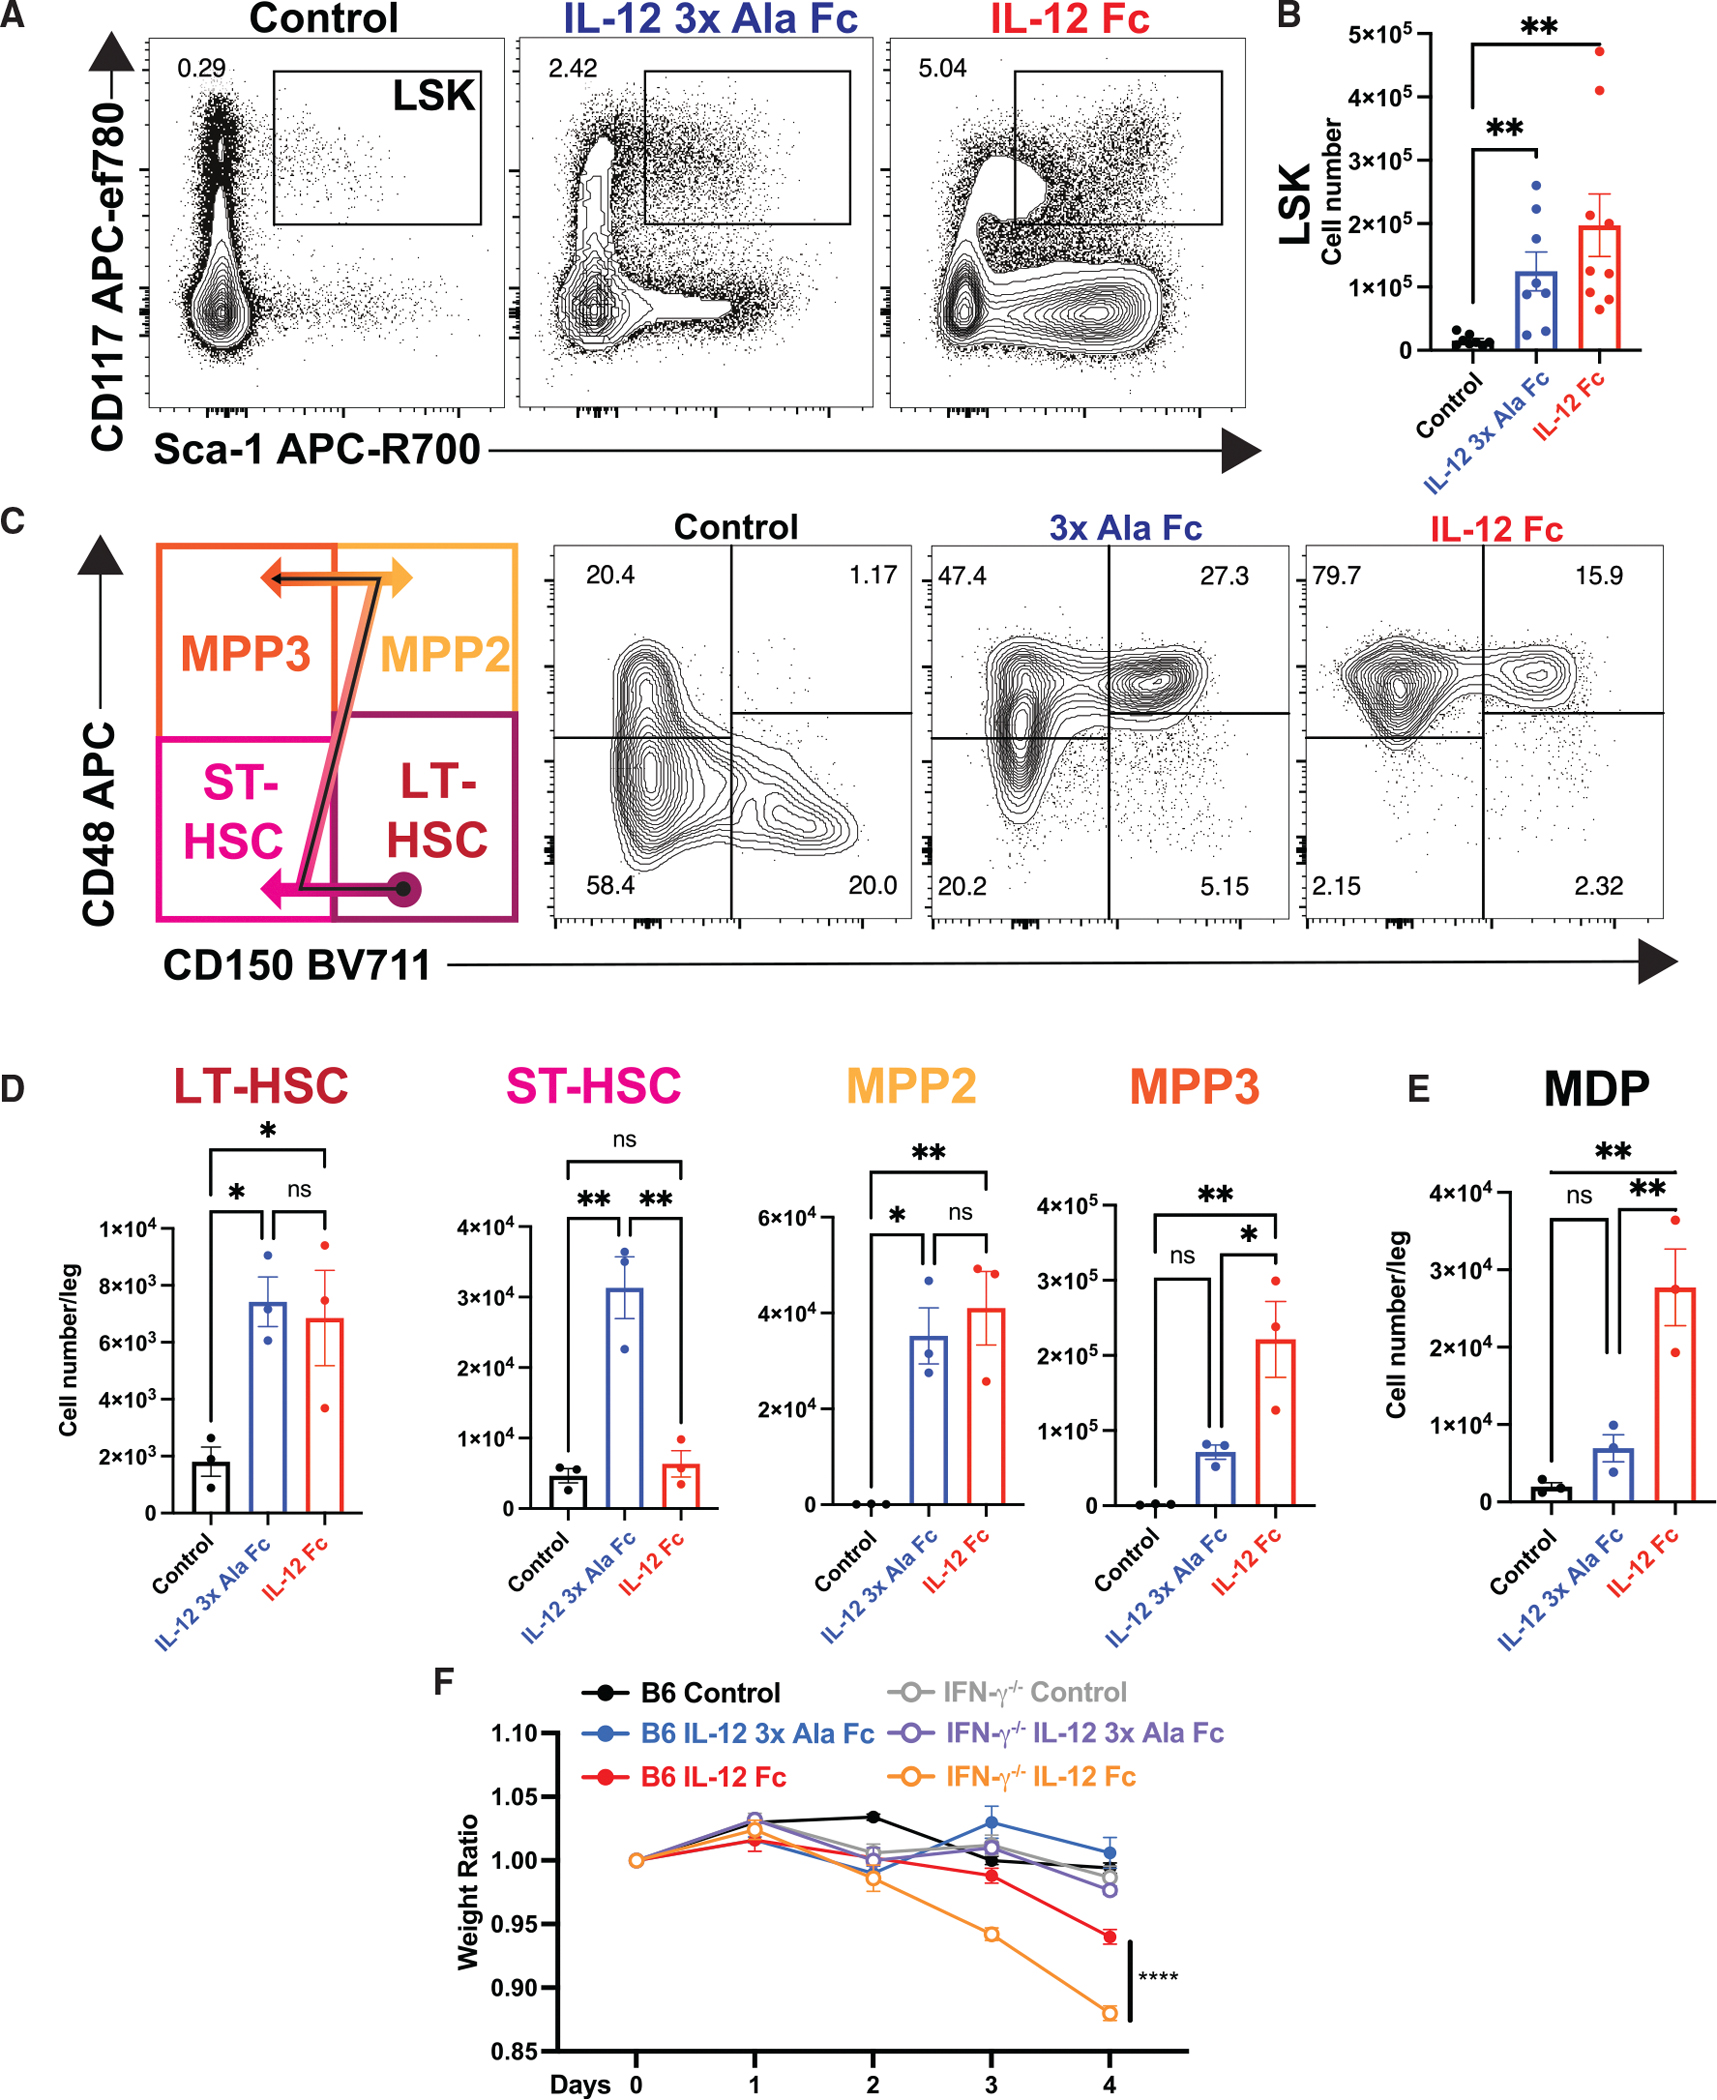
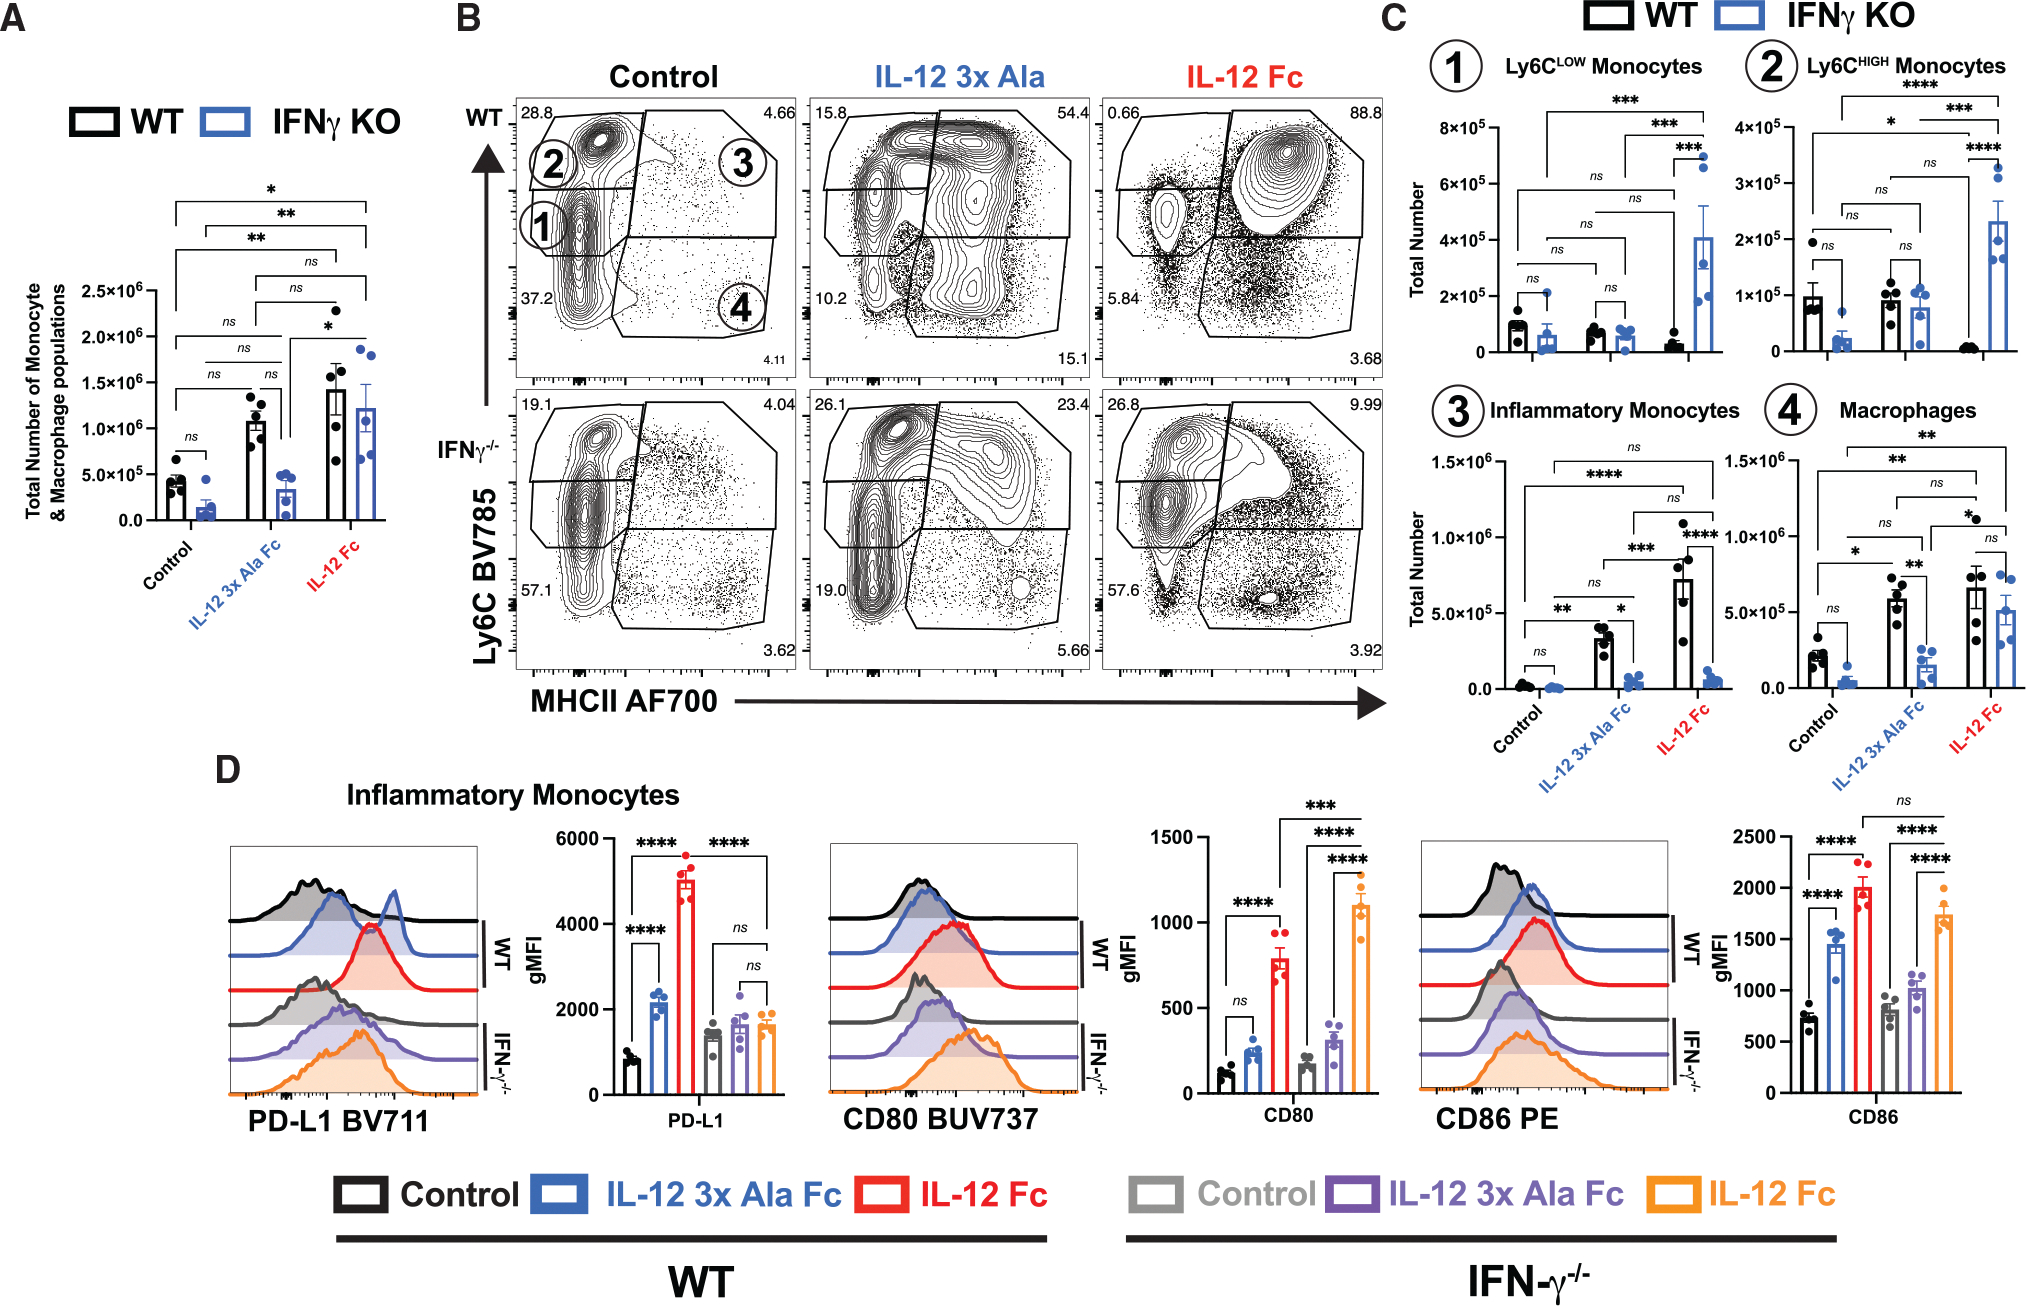
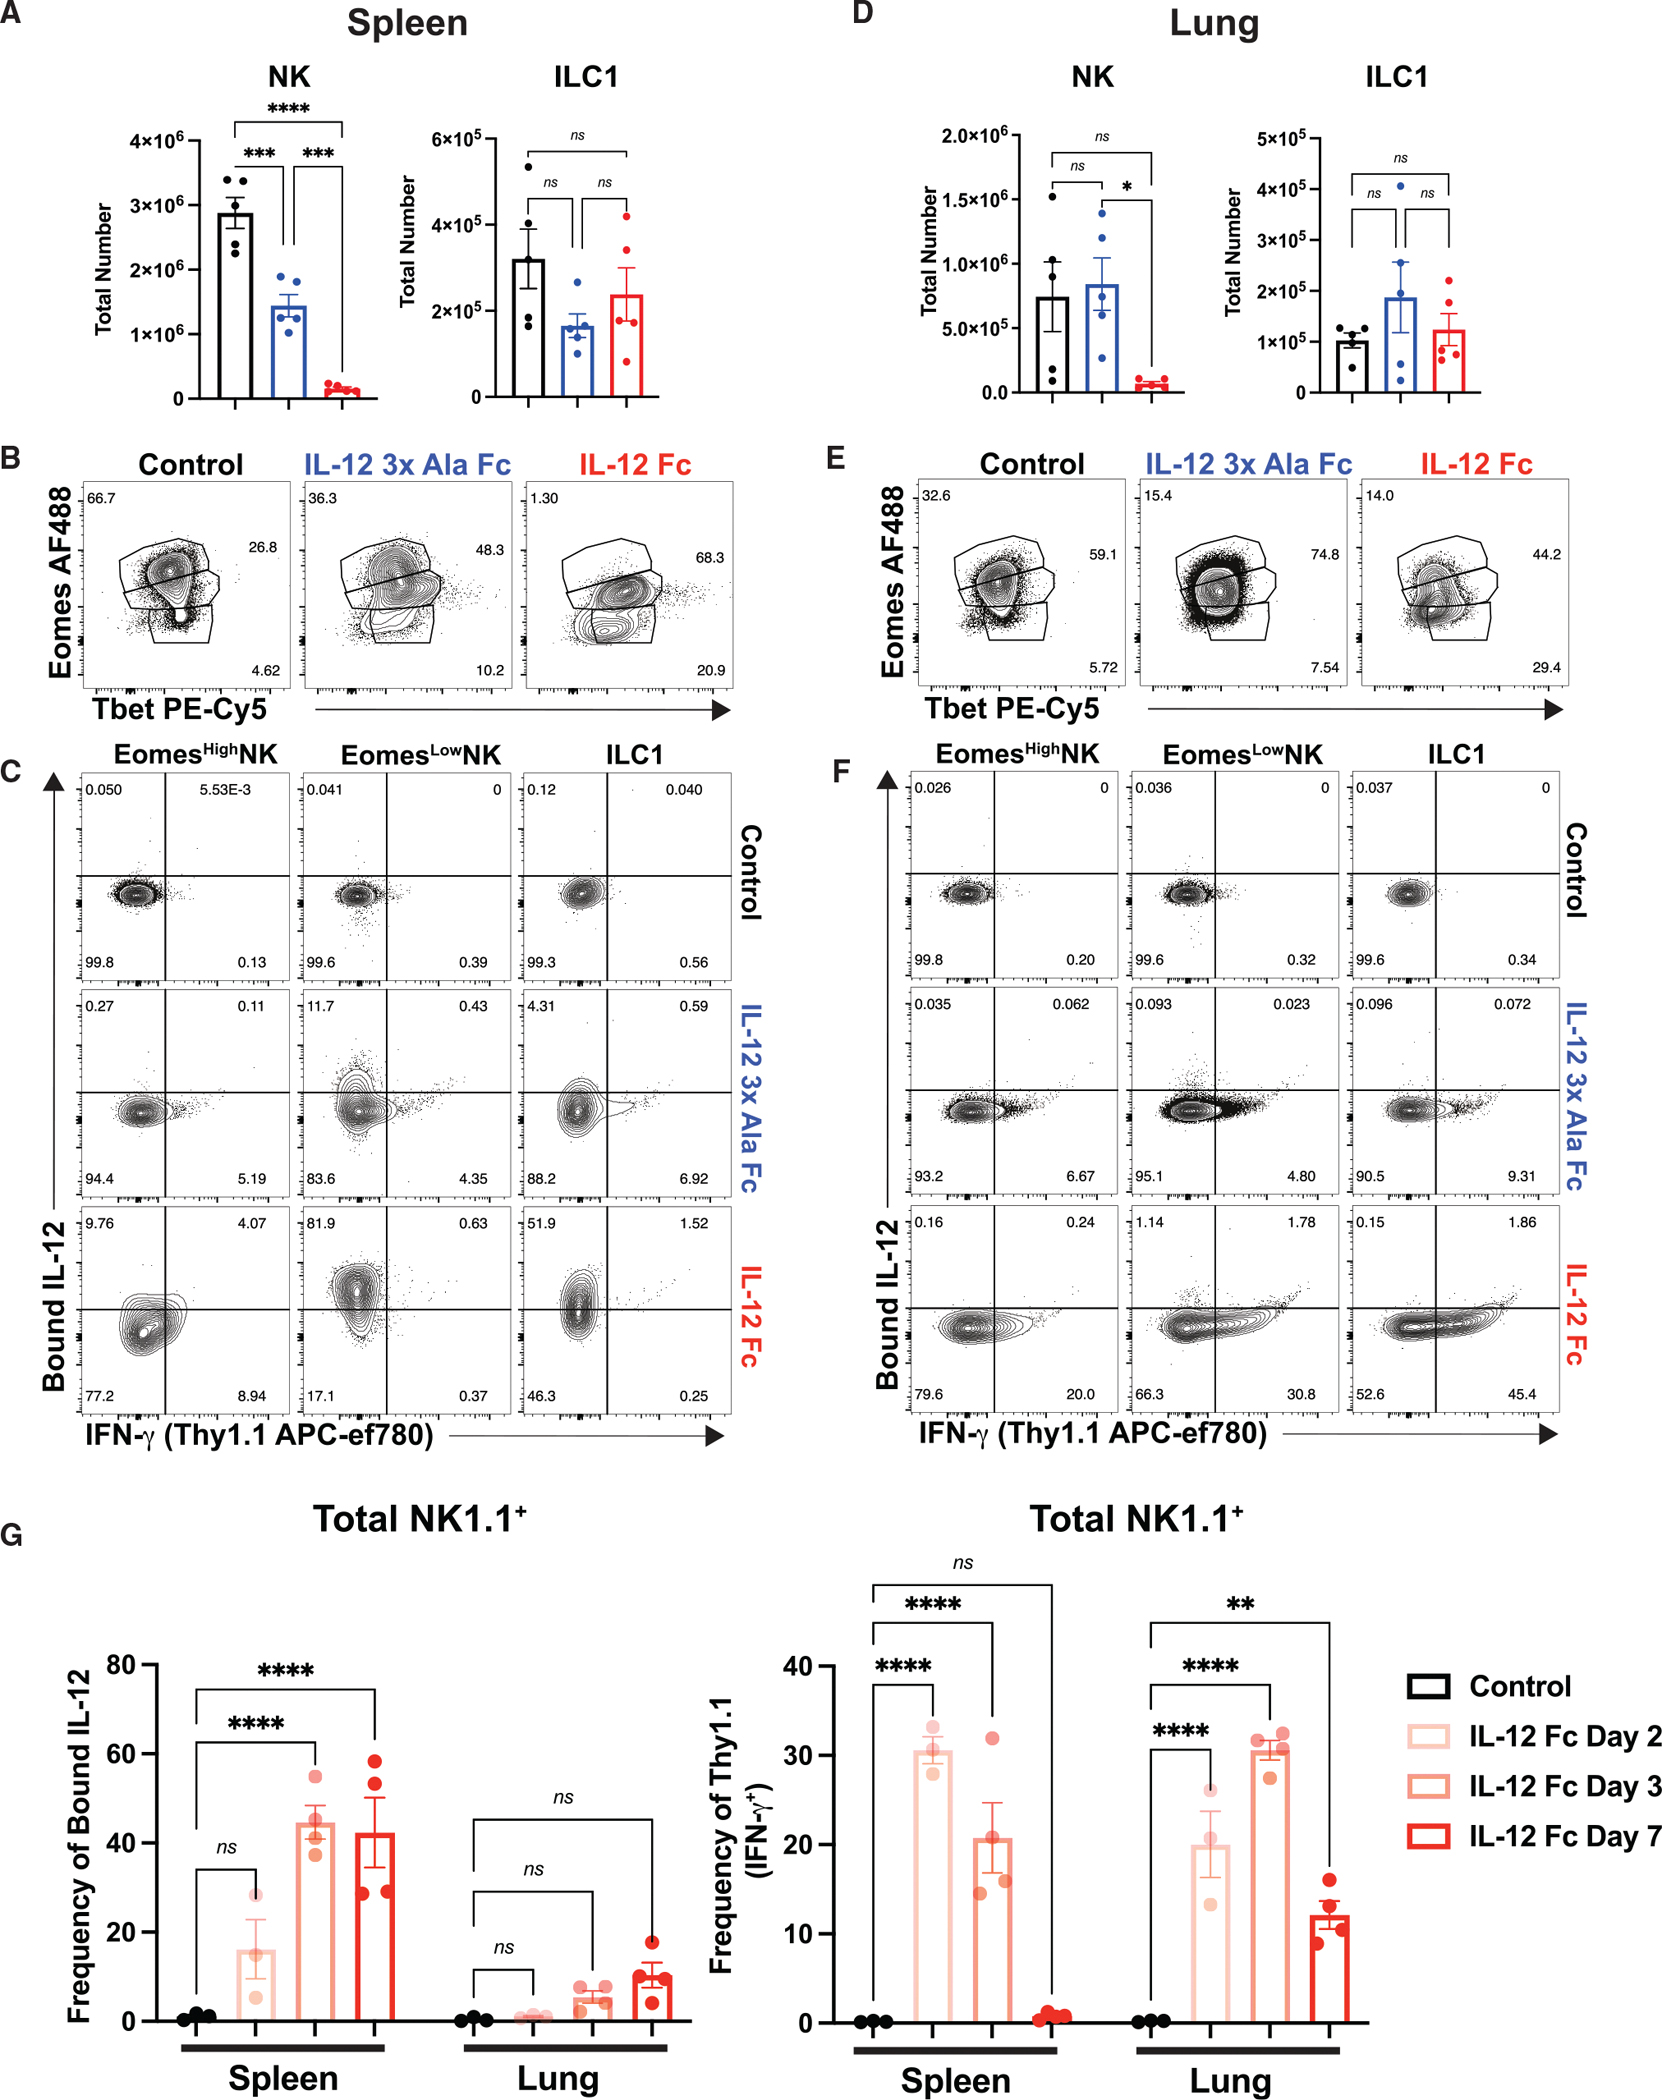
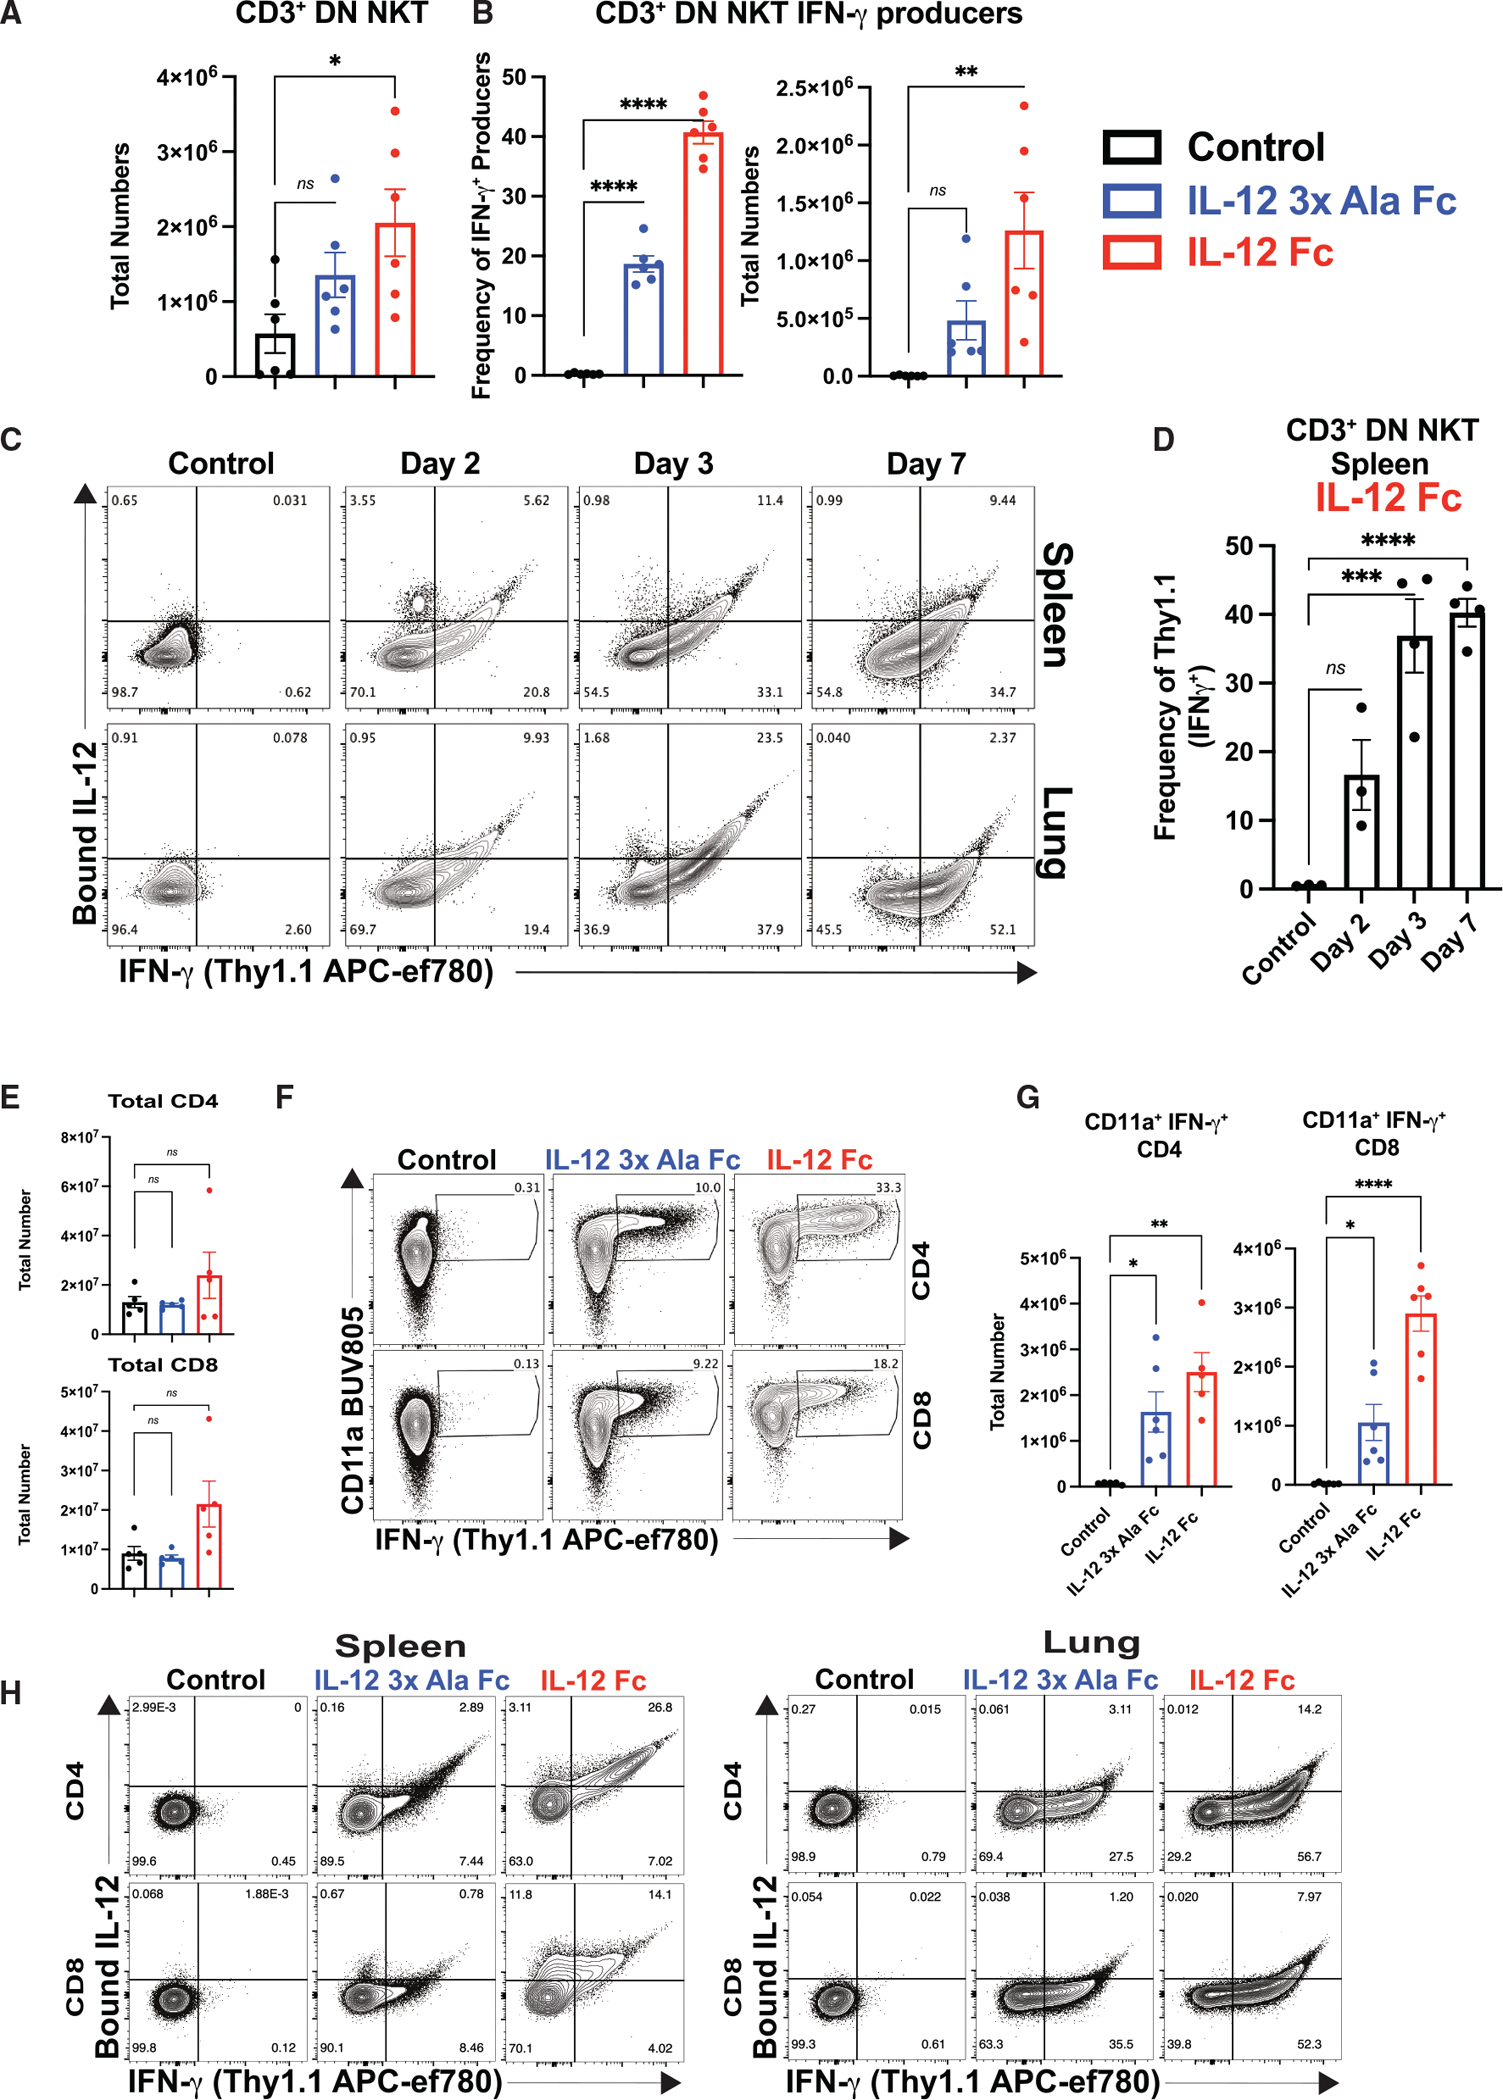
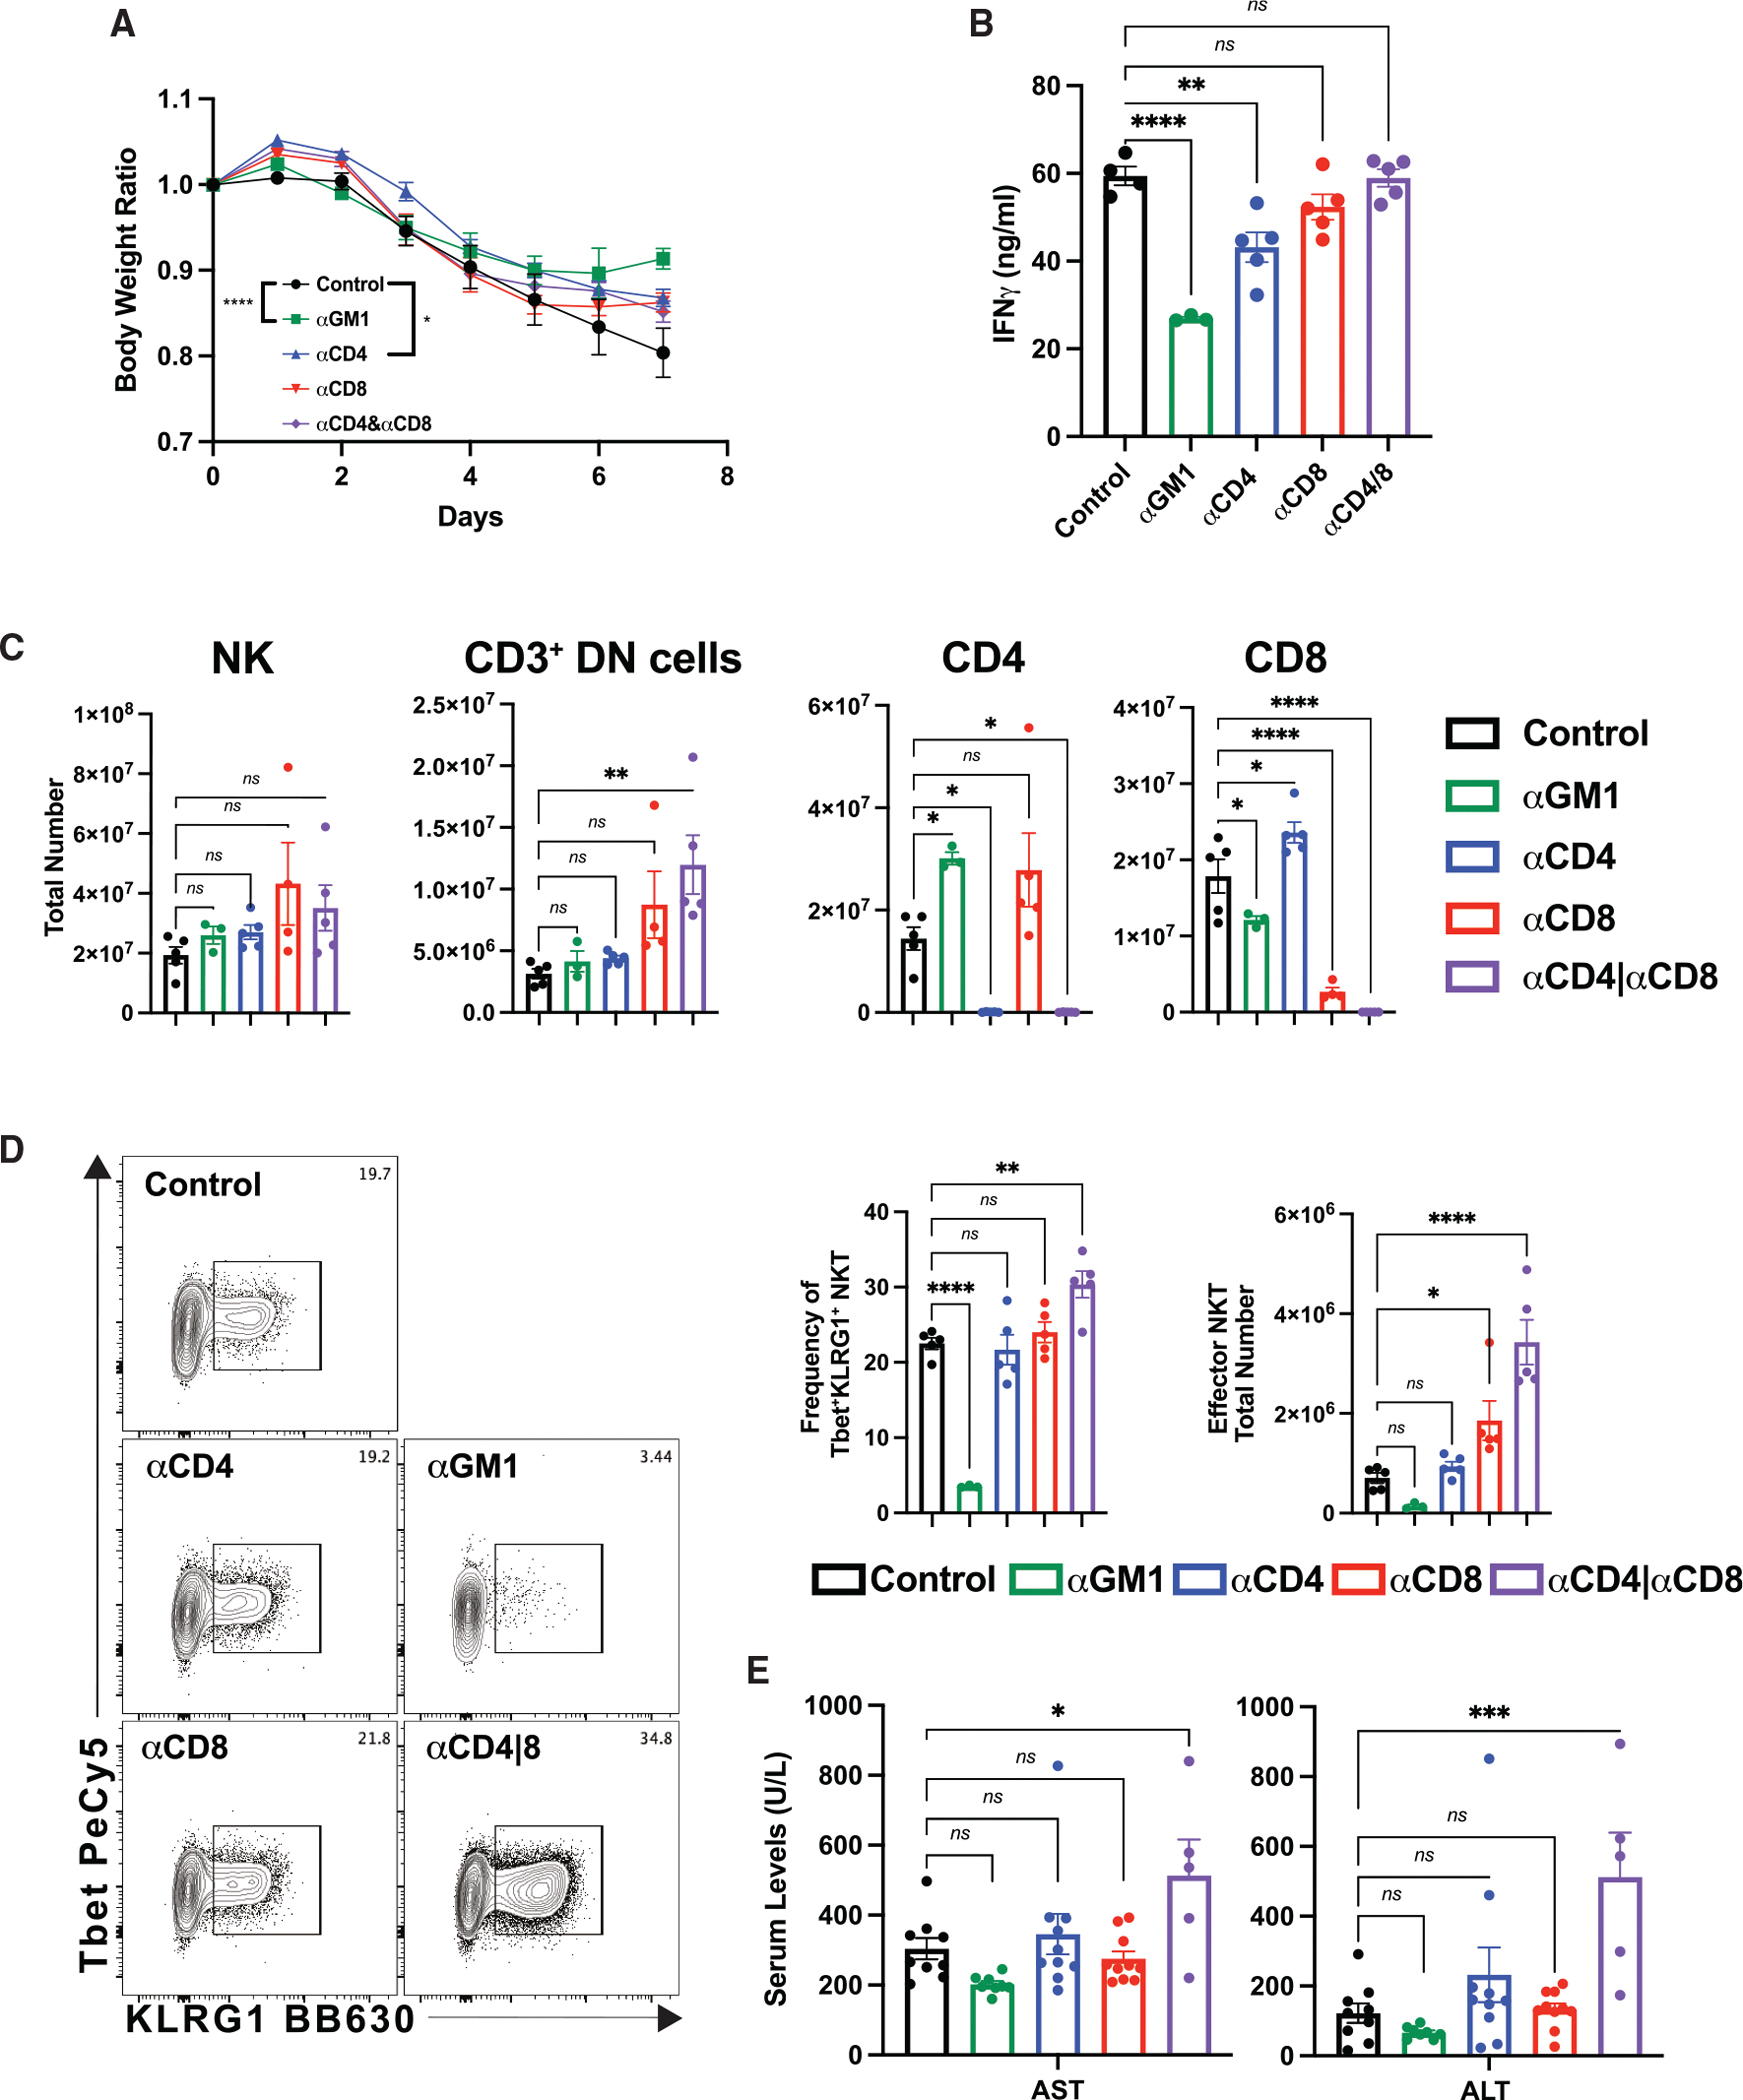
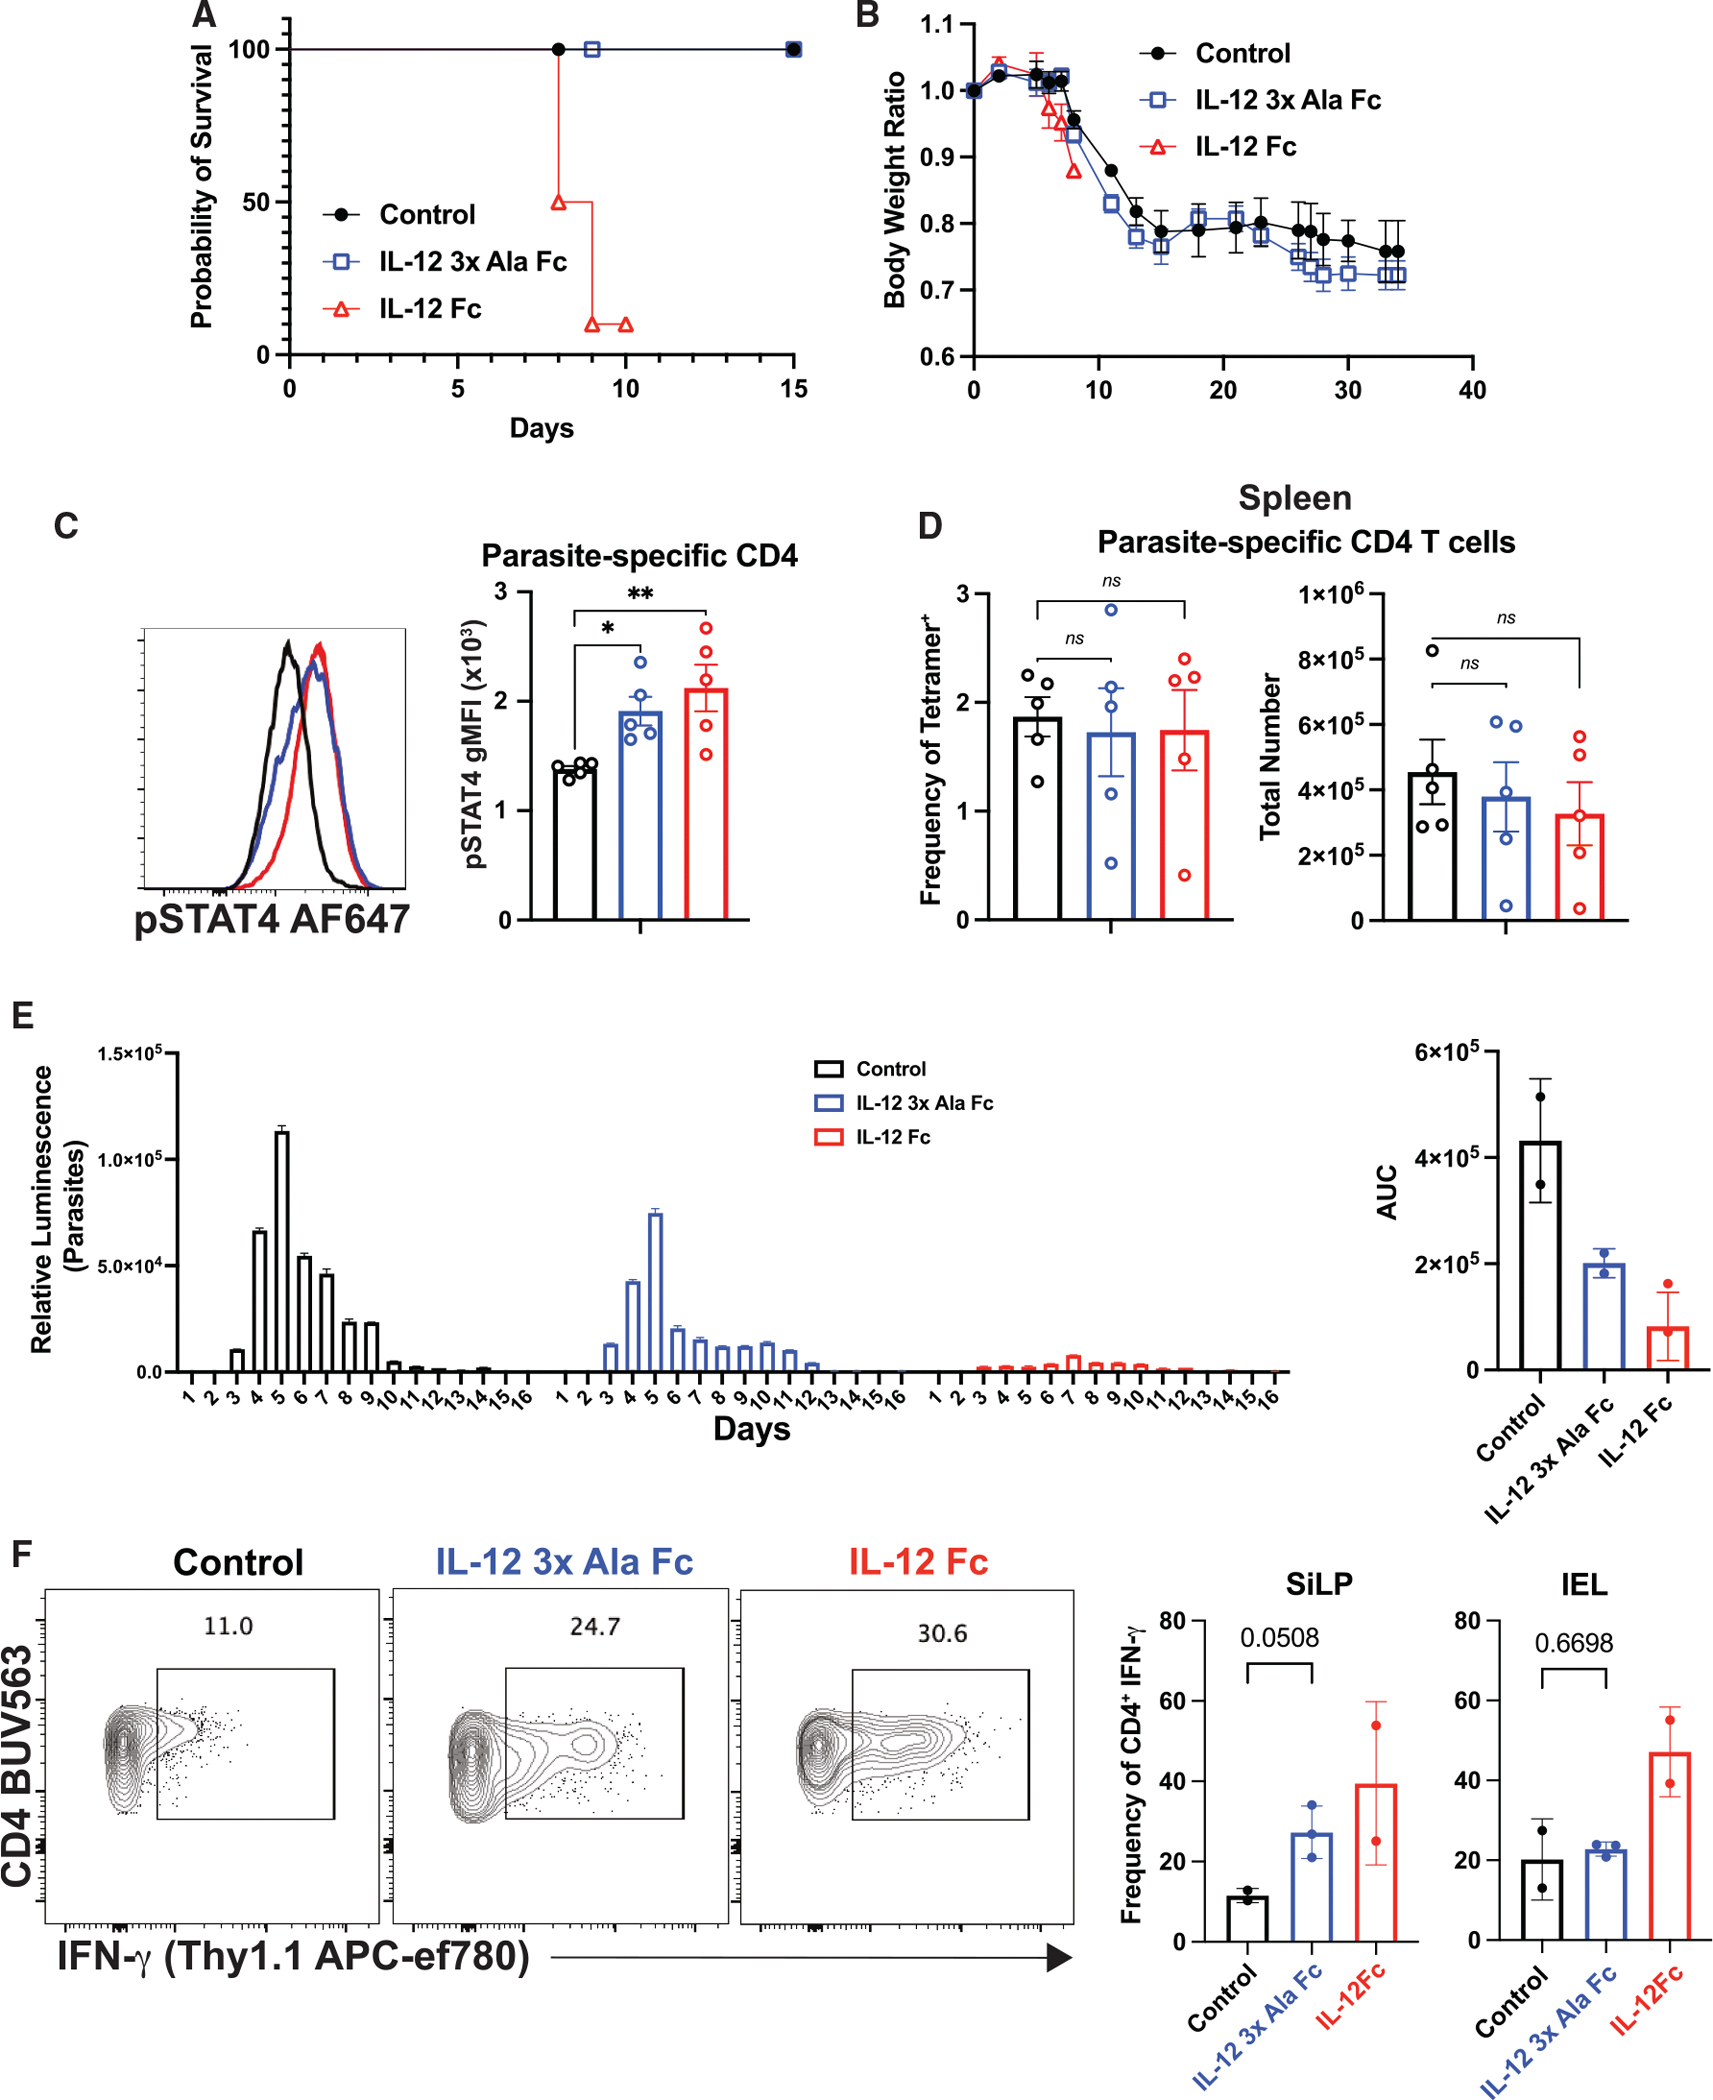
Interleukin-12 (IL-12) stimulates natural killer (NK) and T cell production of interferon gamma (IFN-γ), but adverse events from NK cell activation have limited its clinical use. This study shows the impact of half-life-extended, full (IL-12Fc) and partial (IL-12 3x AlaFc) IL-12 agonists on the immune system. In naive mice, serial treatment with IL-12Fc induces systemic IFN-γ, multi-organ pathology, and alterations in myelopoiesis. IL-12 Fc stimulates NK cell production of IFN-γ but also activates CD4+, CD8+ T, and NKT cells. IL-12 Fc's ability to enhance the production of IFN-γ facilitates myelopoiesis, but IFN-γ is not required for the development of systemic toxicity. In contrast, IL-12 3x Ala Fc avoids overt disease, activates CD4+ and CD8+ T cells, and induces myelopoiesis. These differential activities were harnessed to enhance resistance to infection, indicating that a threshold of IL-12 signaling is tolerated under steady-state conditions and that fine-tuning IL-12 agonism can bolster resistance without triggering pathology.

Keywords: CP: Immunology; hematopoeisis; infection; innate and adaptive immunity; interleukin-12; toxicity.


Conflict of interest statement

Declaration of interests B.J. and P.L. are current employees and shareholders of Synthekine, Inc., and C.A. Hunter is on the scientific advisory board of Synthekine, Inc.

Figures

Figure 1.
Figure 1.. IL-12 partial agonist abrogates toxicity associated with repetitive IL-12 dosing at steady state
(A) Groups of C57BL/6 (WT, n = 5) mice received daily intraperitoneal injections (as indicated by arrows) of IL-12 Fc (0.8 μg per dose), IL-12 3x Ala Fc (48 μg), or an IgG2a Fc fragment (48 μg) as a control, and daily body weight was recorded for 7 days. Data shown are representative of 3 experiments, with statistical significance determined by two-way ANOVA and Tukey’s multiple correction; ***p < 0.001 and ****p < 0.0001. (B) Representative image of spleens from treated mice on day 7. (C) Representative H&E sections of lungs from individual mice treated as described above. Scale bars shown represent 0.06 cm and 50 μm for the 5× and 20× images, respectively. (D) Cumulative disease scores for lungs from the different experimental groups from a single experiment (n = 5 mice/group) with data presented as x±SEM. Statistical significance was determined by one-way ANOVA and Dunn’s multiple correction test; ns (not significant) p > 0.05 and ***p < 0.001. (E–G) Serum was collected from treated mice on day 7, aspartate and alanine aminotransferase enzyme levels and IFN-γ were measured as described in the STAR Methods, and data are displayed as x±SEM. Data shown are from a representative experiment for ALT and AST (n = 4) or IFN-γ (n = 3) with 3–5 mice per experimental group. Statistical significance was determined by one-way ANOVA and Tukey’s multiple correction. AST: **p = 0.0084, ALT: **p = 0.0020, and IFN-γ: ****p < 0.0001.
Figure 2.
Figure 2.. IL-12 agonism induces hematopoietic stem cell mobilization and biases bone marrow progenitors toward a myeloid fate
(A–E) C57BL/6 (WT) mice received daily i.p. injections of IL-12 Fc, IL-12 3x Ala Fc, or an IgG2a Fc, and mice were euthanized on day 7. Bone marrow was harvested, and hematopoietic stem cell types were identified as described in Figure S2. Data shown are from representative experiments and are displayed as x±SEM with 3–5 mice per group (A) Representative flow plots of analysis of LSK cells are shown. (B) Quantification of LSK cell numbers per femur, and data are pooled from 2 independent experiments. Statistical significance was determined by one-way ANOVA and Sidak multiple correction. **p = 0.0053. (C) Analysis of long-term hematopoietic stem cells (LT-HSCs), short-term hematopoietic stem cells (ST-HSCs), multi-potent progenitor 2 (MPP2), and MPP3. The gating strategy and representative flow plots are presented. (D) Quantification of LT-HSC, ST-HSC, MPP2, and MPP3 cell types. Statistical significance was determined by one-way ANOVA and Sidak multiple correction (*p < 0.05 and **p < 0.005). (E) Quantification of monocyte-dendritic progenitor (MDP) cells. Statistical significance was determined by one-way ANOVA and Sidak multiple correction (**p < 0.0069). (F) C57BL/6 (WT) and IFN-γ−/− mice (n = 5 per group) received daily i.p. injections of IL-12 Fc, IL-12 3x Ala Fc, or an IgG2a Fc fragment as a control and mice were weighed every day, with data presented as x±SEM (****p < 0.0001).
Figure 3.
Figure 3.. Enhanced inflammatory monocyte response upon IL-12 agonism is mediated by IFN-γ
(A–C) C57BL/6 (WT) and IFN-γ−/− mice (n = 5 mice/group) received daily i.p. injections of IL-12 Fc, IL-12 3x Ala Fc, or an IgG2a Fc as a control and mice were euthanized on day 4 and lungs harvested for analysis of myeloid cells (CD3, Ly6G, B220, Sirtpa+, CD11c) by flow cytometry. (A) Quantification of total monocyte and macrophage cells in the lung for 1 representative experiment of 3 performed. Data are presented as x±SEM with statistical significance determined by two-way ANOVA and Tukey’s multiple correction (*p < 0.05 and **p < 0.005). (B) Representative flow plot of macrophage and monocyte populations depicting (1) Ly6Clow, (2) Ly6Chigh, and (3) MHCII+ inflammatory monocytes, and (4) Ly6CMHCII+ macrophages. (C) Total numbers (x±SEM) of Ly6Clow, Ly6Chigh, and Ly6C+MHCII+ inflammatory monocytes and Ly6CMHCII+ macrophages, with statistical significance determined by two-way ANOVA and Tukey’s multiple correction (*p < 0.05, **p < 0.005, ***p < 0.001, and ****p < 0.0001). (D) Representative histograms of PD-L1, CD80, and CD86 on inflammatory monocytes (Ly6C+MHCII+) with quantification of the geometric mean fluorescence intensity. Data are presented as x±SEM from a single experiment with n = 5 per group, and similar results were seen in a repeat experiment. Statistical significance was determined by one-way ANOVA and Tukey’s multiple correction (***p < 0.001 and ****p < 0.0001).
Figure 4.
Figure 4.. Detection of IL-12-responding innate NK/ILC1 cells in vivo
IFN-γ Thy1.1 reporter mice received daily i.p. injections of IL-12 Fc, IL-12 3x Ala Fc, or an IgG2a Fc fragment as a control and were euthanized after 7 days, and the spleen and liver were analyzed to characterize the natural killer (NK) and innate-like cell 1 (ILC1) response. (A) Quantification of the total splenic NK and ILC1 cell populations (n = 5 per group, x±SEM). NK cells are defined as live, singlets, CD3, NK1.1+Tbet+Eomes+ and ILC1s are defined as live, singlets, CD3, NK1.1+Tbet+Eomes. Data shown are representative of 3 experiments performed. Statistical significance was determined by one-way ANOVA and Tukey’s multiple correction; (***p < 0.001 and ****p < 0.0001). (B and E) Representative flow plots depicting splenic and lung NK cells (defined as Eomeshigh and Eomeslow populations) and splenic ILC1 cells after gating down to live, singlets, CD3, NK1.1+. (C and F) Representative flow plot depicting bound IL-12 agonist x Thy1.1 expression for each subset of splenic NK cells (defined as Eomeshigh and Eomeslow populations) and ILC1 cells. (D) Quantification of the number of NK and ILC1 cells in the lung (n = 3–4 per group, x±SEM), representative of 3 experiments performed. Statistical significance was determined by one-way ANOVA and Tukey’s multiple correction (*p < 0.05). (G) Frequency of total NK1.1+IL-12Fc+ and Thy1.1+ cells at the indicated time points in the spleen and lung of IFN-γ reporter mice (n = 3–4 per group, x±SEM). Statistical significance was determined by one-way ANOVA and Tukey’s multiple correction (**p < 0.005, ***p < 0.001, and ****p < 0.0001).
Figure 5.
Figure 5.. Analysis of T cell responses to IL-12 agonism between subsets and across tissues
IFN-γ Thy1.1 reporter mice received daily i.p. injections of IL-12 Fc, IL-12 3x Ala Fc, or an IgG2a Fc fragment, and spleen and lung were harvested on day 7 for analysis. (A) Quantification of the total number of CD3+(CD4CD8) DN NKT cells in the spleen (n = 6 group, pooled data from 2 independent experiments, x±SEM). Statistical significance was determined by one-way ANOVA and Tukey’s multiple correction (*p < 0.05). (B) Frequency of splenic Thy1.1+CD3+(CD4CD8) DN NKT cells (n = 6 group, pooled data from 2 independent experiments, x±SEM). Statistical significance was determined by one-way ANOVA and Tukey’s multiple correction (**p < 0.005 and ****p < 0.0001). (C) Representative flow plot depicting bound IL-12 agonist x Thy1.1 expression for CD3+(CD4CD8) DN NKT cells from the spleen and lung. (D) Impact of IL-12 Fc on the frequency of Thy1.1+ splenic CD3+(CD4CD8) DN NKT cells at the indicated time points (n = 3–4 mice/group, x±SEM). Statistical significance was determined by one-way ANOVA and Tukey’s multiple correction (***p < 0.001 and ****p < 0.0001). Data are from a representative experiment of 2–3 per time point. (E) Quantification of splenic CD3+ CD4+ or CD8+ T cells on day 7. n = 5 per group. Data shown are representative of 2 experiments performed, with statistical significance determined by one-way ANOVA and Tukey’s multiple correction. (F) Representative flow plot depicting CD11aexpression x Thy1.1 expression to identify splenic effector CD4+ and CD8+ T cells. (G) Quantification of the number of splenic Thy1.1+CD4+ or CD8+ T cells on day 7. Data are pooled from 2 independent experiments with n = 3/group, and statistical significance was determined by one-way ANOVA and Tukey’s multiple correction (*p < 0.05, **p < 0.005, and ****p < 0.0001). (H) Representative flow plot depicting bound IL-12 agonist x Thy1.1 expression by CD4+ and CD8+ T cells from the spleen and lung on day 7.
Figure 6.
Figure 6.. Impact of immune cell depletion on IL-12 toxicity
C57BL/6 (WT) mice received an i.p. injection of 200 μg/mouse of depleting antibody (Ab). After 24 h, they received daily i.p. injections of IL-12 Fc, and body weight was monitored. Mice were euthanized on day 7. All data are from 1 of 2 experiments performed with n = 3–5/group. Data are presented as x±SEM. (A) Body weight was measured daily and statistical significance determined by one-way ANOVA and Tukey’s multiple correction. (*p < 0.05 and ****p < 0.0001). (B) Blood was collected on day 7 and IFN-γ levels measured by ELISA. Statistical significance was determined by one-way ANOVA and Tukey’s multiple correction (**p < 0.005 and ****p < 0.0001). (C) Quantification of the number of splenic CD3NK1.1+ NK cells, CD3+CD4CD8 DN NKT cells, and CD3+CD4+ and CD3+CD8+ T cells on day 7. Statistical significance was determined by one-way ANOVA and Tukey multiple correction. (*p < 0.05, **p < 0.005, and ****p < 0.0001). (D) Representative flow plot depicting Tbetx KLRG1 expression after pre-gating on CD3+CD4CD8 DN NKT cells. Frequency and total number of Tbet+KLRG1+CD3+CD4CD8 DN NKT cells. Statistical significance was determined by one-way ANOVA and Tukey’s multiple correction (*p < 0.05, **p < 0.005, and ****p < 0.0001). (E) Serum levels of aspartate and alanine aminotransferase on day 7. Data presented are pooled from 2 independent experiments with n = 5–10/group. Statistical significance was determined by one-way ANOVA and Tukey’s multiple correction (*p < 0.05 and ***p < 0.001).
Figure 7.
Figure 7.. Differential effects of IL-12 treatment during infection
(A and B) C57BL/6 (WT) mice were infected i.p. with 20 ME49 T. gondii cysts and treated with IL-12 variants on days 5, 7, and 9, and survival and body weight was monitored for each cohort. Data presented are from a representative experiment of 2 performed. Due to enhanced susceptibility upon IL-12 Fc treatment, infected mice received treatment on days 5 and 7 and were analyzed on day 8. (C) Representative histogram and bar graph illustrate pSTAT4 levels from parasite-specific CD4 T cells upon IL-12 agonism on day 8. n = 5 per group, with 1 representative experiment of 2 performed. Statistical significance was determined by one-way ANOVA and Tukey’s multiple correction (*p < 0.05 and **p < 0.005). (D) Quantification of the frequency and total number of CD11a+tetramer+CD4 T cells from the spleen on day 8 after IL-12 treatment. n = 5 per group. Data presented are x±SEM and are representative of 2 experiments performed. Statistical significance was determined by one-way ANOVA and Tukey’s multiple correction (ns [not significant] p > 0.05). (E) C57BL/6 (WT) mice were infected with 50,000 mouse-adapted (ma)-C. parvum cysts by oral gavage and received IL-12 variants i.p. on day 1 and every other day until day 15. Parasite burden was quantified by luminescence in feces collected daily from individual cages with n = 3/cage. Data are from 1 representative experiment shown of 2 performed. (F) IFN-γ Thy1.1 reporter mice were infected with ma-C. parvum and treated with IL-12 agonists on days 1 and 3, and the small intestine lamina propria (SiLP) and intra-epithelial layer (IEL) were harvested on day 4. CD4+IFN-γ T cells were assessed by flow cytometry. The flow cytometry plot is based on the use of concatenated samples from 2–3 mice/group and are representative of 2 experiments performed. Statistical significance was determined by one-way ANOVA and Tukey’s multiple correction.

Similar articles

References

    1. Trinchieri G (2003). Interleukin-12 and the regulation of innate resistance and adaptive immunity. Nat. Rev. Immunol. 3, 133–146. 10.1038/nri1001. - DOI - PubMed
    1. Tait Wojno ED, Hunter CA, and Stumhofer JS (2019). The Immunobiology of the Interleukin-12 Family: Room for Discovery. Immunity 50, 851–870. 10.1016/j.immuni.2019.03.011. - DOI - PMC - PubMed
    1. Gazzinelli RT, Hieny S, Wynn TA, Wolf S, and Sher A (1993). Interleukin 12 is required for the T-lymphocyte-independent induction of interferon gamma by an intracellular parasite and induces resistance in T-cell-deficient hosts. Proc. Natl. Acad. Sci. USA 90, 6115–6119. 10.1073/pnas.90.13.6115. - DOI - PMC - PubMed
    1. Trinchieri G, and Scott P (1994). The role of interleukin 12 in the immune response, disease and therapy. Immunol. Today 15, 460–463. 10.1016/0167-5699(94)90189-9. - DOI - PubMed
    1. Romani L, Puccetti P, and Bistoni F (1997). Interleukin-12 in infectious diseases. Clin. Microbiol. Rev. 10, 611–636. 10.1128/cmr.10.4.611. - DOI - PMC - PubMed

MeSH terms

LinkOut - more resources