. 2025 Jun 24;44(6):115797.
doi: 10.1016/j.celrep.2025.115797. Epub 2025 Jun 11.

Aberrant phase separation of two PKA RIβ neurological disorder mutants leads to mechanistically distinct signaling deficits

Affiliations

Aberrant phase separation of two PKA RIβ neurological disorder mutants leads to mechanistically distinct signaling deficits

Emily H Pool et al. Cell Rep. .

Abstract

Spatiotemporal regulation of key-node signaling molecules, such as 3',5'-cyclic adenosine monophosphate (cAMP)-dependent protein kinase (PKA), is critical for normal cell physiology and susceptible to dysregulation in disease. Liquid-liquid phase separation (LLPS) is broadly recognized as a fundamental component of signal regulation, yet the connections between physiological and disease-linked biomolecular condensates are not well understood. Here, we show that an understudied, brain-specific PKA regulatory subunit, RIβ, forms biomolecular condensates with distinct features from the ubiquitous isoform, RIα. We demonstrate that two RIβ mutants linked to neurodegenerative (L50R) or neurodevelopmental (R335W) pathologies produce aberrant condensates that trap the PKA catalytic subunit within a gel-like matrix or cAMP-insensitive holoenzyme complex, respectively. RIβL50R condensates, in particular, lead to disrupted spatiotemporal control of PKA signaling and diminished PKA activity, resulting in phenotypic hallmarks of neurodegeneration. Our work highlights the functional importance of biomolecular condensates and the critical link between dysregulated LLPS and neurological disorders.

Keywords: CP: Molecular biology; CP: Neuroscience; biomolecular condensates; cAMP; neurodegeneration; neurodevelopment; protein kinase; signaling compartmentation.


Conflict of interest statement

Declaration of interests The authors declare no competing interests.

Figures

Figure 1.
Figure 1.. RIβ undergoes liquid-liquid phase separation
(A) Representative immunofluorescence images of endogenous RIβ puncta in PC12 cells pre(−) and post(+) 30-min Fsk/IBMX treatment. (B) Quantification of endogenous puncta per cell in immunofluorescence experiments. n − Fsk/IBMX = 622, n +Fsk/IBMX = 778 cells; ****p < 1 × 10⁻¹⁵, Welch’s unpaired t test. (C) Representative image of a HEK293T cell overexpressing RIβ-GFP2 showing punctate assemblies. (D) In vitro phase separation assays of purified RIβ suggest a 4 μM threshold concentration for assembly formation. Contrast in 4 μM image enhanced for clarity. (E) Representative recovery of photobleached RIβ-GFP2. (F) Representative images of HEK293T cells co-expressing RIβ-GFP2 and Cα-mCherry pre(−) and post(+) 20-min cAMP stimulation, showing formation of co-localized puncta. (G) Quantification of RIβ-GFP2 puncta from (F). n = 70 cells; ****p = 2.07 × 10⁻⁶. (H) Representative time-lapse showing fusion of newly formed RIβ puncta (experiment as in F). (I) Partition coefficients of RIβ-GFP2 and Cα-mCherry in puncta. (J) smAKAP recruitment inhibits RIβ condensates. ****p < 1 × 10⁻¹⁵; nsmAKAP = 20, nL2P2 = 19 whole images from three independent experiments. Scale bars, 10 μm; insets in (H), 3 μm. In (A), (D), and (H), puncta are indicated with yellow arrowheads; dashed lines in (F) mark cell borders. Dot plots in (B), (G), and (I) show median ± 95% CI and significance determined by Wilcoxon test, and in (J), mean ± 95% CI, Welch’s unpaired t test. See also Figure S1.
Figure 2.
Figure 2.. Domain deletions reveal RIβ-specific characteristics for phase separation
(A) Domain architecture of RIβ. (B) Puncta quantification of GFP2-tagged RIβ domain deletion mutants co-expressed in HEK293T with Cα-mCherry ± cAMP stimulation. Representative post-stimulation images shown. Statistical significance is ±Fsk/IBMX (asterisks, paired Student’s t tests) or vs. wild-type of the same condition (daggers, Mann-Whitney test). ††††pΔD/D−cAMP = 2.04 × 10⁻¹², ††††pΔD/D+cAMP < 1 × 10⁻¹⁵, †††pΔLinker−cAMP = 9.12 × 10⁻⁴, ††††pΔLinker+cAMP < 1 × 10⁻¹⁵, ****pΔLinker < 1 × 10⁻¹⁵, †pΔN3A-A− cAMP = 0.0331, ††††pΔN3A-A+cAMP = 4.44 × 10⁻⁷, pΔN3A-A±cAMP = 0.531, ††††pΔCNBs−cAMP = 4.66 × 10⁻¹³, ††††pΔCNBs +cAMP < 1 × 10⁻¹⁵, ††††pΔD/D+L−cAMP = 1.25 × 10⁻¹⁰, ††††pΔD/D+L+cAMP = 2 × 10⁻¹⁵. Dot plots show median ± 95% CI. (C) Structural model showing increased disorder of the linker region when not bound to Cα. RIβ ribbon shown in tan with the most disordered residues in magenta and IS showing side chains, Cα shown in green ribbon with space-fill. Top: 4DIN, bottom: AlphaFold2 structural prediction of full-length human RIβ. (D) Representative slice and 3D reconstruction of singly expressed RIβΔLinker-GFP2 (top) and representative maximum intensity projections of co-expressed RIβΔLinker-GFP2 and Cα-mCherry (bottom) in RIα KO HEK293T cells. Brightness automatically adjusted for 3D reconstruction and Cα-mCherry final projection for visual clarity. (E) Recovery curves of photobleached RIβΔLinker condensates. For (B) and (E), WT data reproduced from Figure 1. Scale bars in (B) and (D), 10 μm. Dashed lines indicate cell borders. See also Figure S2.
Figure 3.
Figure 3.. The RIβR335W neurodevelopmental mutation abolishes cAMP-stimulated LLPS
(A) Critical residues in the CNB cassettes. (B) Structure of the CNB-B cAMP binding cassette using the cAMP-bound RIα structure PDB: 4MX3. (C) Representative recovery curve of photobleached RIβR335W condensates. (D) Representative image of HEK293T cells singly expressing RIβ R335W-GFP2. (E) Representative images of cells co-expressing RIβR335W-GFP2 with Cα-mCherry before (−) and 20 min after (+) cAMP stimulation. Dashed line indicates cell borders. (F and G) Puncta quantification (F) and partition coefficients (G) from cells as in (E), compared with wild-type. Puncta quantification: n R335W = 150 cells, pR335W±cAMP = 0.623; Wilcoxon test. pWT/R335W+cAMP = 0.475; Mann-Whitney test. Partition coefficients: nR335W = 72 cells, 95% CIR335W−cAMP = 0.0107–0.0650, 95% CIR335W+cAMP = 0.0115–0.0457, *p = 0.0300, 95% CICα−cAMP = 0.000–0.00313, 95% CICα+cAMP = 0.00235–0.0337, p = 0.148; paired Wilcoxon tests. WT data in (C), (F), and (G) reproduced from Figure 1. Scale bars in (D) and (E), 10 μm. Dot plots, median ± 95% CI. Overexpression conducted in HEK293T cells. See also Figure S3.
Figure 4.
Figure 4.. The Marbach-Schaaf R335W mutation is dominant negative and dysregulates PKA signaling by sequestering the catalytic subunit
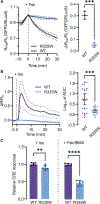
(A) Loss of R:C BRET emission ratios upon 50 μM forskolin stimulation in cells overexpressing RIβWT - or RIβR335W -RLuc8 and GFP2-Cα. ***p = 0.000340. (B) PKA activity response curves and area under the curve following stimulation with 5 μM Iso in cells overexpressing ExRai-AKAR2 and RIβ-mRuby2. n WT = 23, nR335W = 30 cells, ***p = 2.26 × 10⁻⁴. (C) Normalized CRE transcription in cAMP-stimulated cells expressing RIβWT - or RIβ R335W -mRuby2. **pIso = 0.00814 and ****pFsk/IBMX = 1.60 × 10⁻⁸. Experiments conducted in RIα KO HEK293T and compared by unpaired Student’s or Welch’s t tests. Data in (A), mean ± SD, others, mean ± 95% CI. See also Figure S4.
Figure 5.
Figure 5.. Neurodegenerative L50R disease mutation leads to aberrant condensate formation
(A) Domain architecture of RIβ indicating L50. (B) Representative images of RIβWT - and RIβL50R-V5 assemblies in primary cortical/hippocampal neurons and (C) quantification of the number and average size of assemblies/neuron. n = 17 (RIβWT ), 40 neurons (RIβL50R ). pnumber = 0.339; ****psize = 2.11 × 10⁻⁸, unpaired Student’s t test. (D) Representative recovery curve and mobile fractions of photobleached WT- and RIβL50R-GFP2 puncta. nWT = 36, nL50R = 23 puncta plus 11 with no measurable recovery (DNR) over 5 min. ****p = 1 × 10⁻¹⁵, Welch’s t test. (E) Representative co-immunoprecipitation blot showing RIβL50R-V5-LgBiT pulls down RIβL50R-FLAG, but not RIβWT-FLAG. Representative of four independent blots. (F and G) Images, Pearson’s correlations, and co-immunoprecipitation showing smAKAP does not recruit RIβL50R. ****p < 1 × 10⁻¹⁵, n = 20 whole images. Representative of three independent experiments each. (H) Quantification of puncta per cell and representative images from RIβL50R-GFP2 expressing cells before (−Fsk/IBMX) and after (+Fsk/IBMX) cAMP stimulation. 95% CIbasal = 1− 1, 95% CIcAMP = 7−9 puncta, n = 114 cells, pWT/L50R basal = 0.205, ****pWT/L50R+Fsk/IBMX < 1 × 10⁻¹⁵, Welch’s t tests. (I) Partition coefficients of RIβ into condensates in cells co-expressing Cα-mCherry. nRIβ = 101, nL50R = 86 cells, pL50R±Fsk/IBMX = 0.0722, ****pWT/L50R−cAMP = 1 × 10⁻¹⁵, ****pWT/L50R+cAMP = 1 × 10⁻¹⁵, Mann-Whitney unpaired or Wilcoxon paired t tests. (J) Time-lapse images of Fsk/IBMX-stimulated cells co-expressing RIβL50R-GFP2 and Cα-mCherry, showing RIβL50R puncta fusion. (K) Partition coefficients of Cα in RIβL50R condensates. pL50R±Fsk/IBMX = 0.861, ****pWT/L50R < 1 × 10⁻¹⁵, ****p WT/L50R+Fsk/IBMX = 4.31 × 10⁻⁹, Mann-Whitney unpaired or Wilcoxon paired t tests. nRIβ = 101, nL50R = 86 cells. (L) Mobile fractions of photobleached Cα-GFP2 in RIβ-mRuby2 condensates with 20 min cAMP stimulation. Recovery of singly expressed Cα-GFP2 shown as a control (gray), n = 31 ROIs. For RIβWT, n = 33, 34, 31; for RIβL50R, n = 28 plus 4 DNR, 30, 32 (left to right). ****pWT/L50R basal < 1 × 10⁻¹⁵, ****pL50R±Iso = 1.71 × 10⁻⁹, **pL50R Iso/Fsk+IBMX = 0.00118, Brown-Forsythe and Welch ANOVA with Dunnett’s multiple comparisons test. (H), (I), (K) and (L), median ± 95% CI; (C), (D), and (F), mean ± 95% CI. All experiments except (B) and (C) were conducted in HEK293T. Some WT data reproduced from Figures 1 and S1, Cα-GFP2 FRAP reproduced from Figure S3. Scale bars, 10 μm; insets, 5 μm. See also Figure S5.
Figure 6.
Figure 6.. Dementia-linked L50R mutation is associated with cell death and reduced neurite outgrowth
(A) Graphic illustrating assay to measure smAKAP-proximal PKA activity, using smAKAP ΔPKA as a control. (B and C) PKA activity curves and log 10 transform of total activity (area under the curve). **psmAKAP/ΔPKA = 0.00130, ****pWT/L50R = 7.38 × 10⁻⁷, *pΔPKA/L50R = 0.0193 by Dunnett’s T3 multiple comparison test; nWT = 50, nL50R = 36, nΔPKA = 34 cells. (D) Cells expressing RIβL50R show substantial deficits in cytosolic PKA signal in response to 5 μM Iso. nWT = 23, nL50R = 18 cells; WT data reproduced from Figure 4. (E) Heat maps showing representative apoptosis- and cell stress-related gene set enrichment profiles. (F) RT-PCR validation of differentially expressed genes. ****pDUSP1 = 4.84 × 10⁻⁵, *pNKRF = 0.0135, ***pSMURF2 = 5.35 × 10⁻⁴, **pCOX8A = 0.00707, *pATF4 = 0.0215, *pSURF1 = 0.0459, unpaired t tests. (G) Percentage of RIβ, RIβL50R, or mRuby2-expressing cells staining for Annexin V after 48 h transfection, measured by flow cytometry. **p = 0.00182, unpaired t test. (H) Measurements of dendritic arbors of mixed primary hippocampal and cortical neurons from neonate mice co-transfected with RIβ or RIβL50R and LCK-GFP, normalized to the mean wild-type arbor length of each independent experiment. Scale bars, 15 μm; n = 96 (RIβWT ), 115 neurons (RIβL50R ), ***p = 0.000640, Mann-Whitney test. Experiments in (A)–(G) conducted in RIα KO HEK293T. Plots are mean ± 95% CI (B)–(D), mean ± SD (F) and (G), or median ± 95% CI (H). All data are from at least three independent experiments. See also Figure S6.
Figure 7.
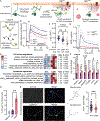
Figure 7.. Graphical summary of physiological PKA RIβ LLPS compared to aberrant phase separation in two distinct neurological diseases leading to dysregulated PKA signaling and other functional outcomes
Graphic indicates relative changes in condensate properties, response to cAMP stimulation, and functional consequences leading to the R335W-driven MASNS and L50R-driven NLPD-PKA disease states, respectively.

References

    1. Kandel ER (2012). The molecular biology of memory: cAMP, PKA, CRE, CREB-1, CREB-2, and CPEB. Mol. Brain 5, 14. 10.1186/1756-6606-5-14. - DOI - PMC - PubMed
    1. Glebov-McCloud AGP, Saide WS, Gaine ME, and Strack S. (2024). Protein Kinase A in neurological disorders. J. Neurodev. Disord. 16, 9. 10.1186/s11689-024-09525-0. - DOI - PMC - PubMed
    1. Abel T, Nguyen PV, Barad M, Deuel TA, Kandel ER, and Bourtchouladze R. (1997). Genetic demonstration of a role for PKA in the late phase of LTP and in hippocampus-based long-term memory. Cell 88, 615–626. 10.1016/s0092-8674(00)81904-2. - DOI - PubMed
    1. Esteban JA, Shi S-H, Wilson C, Nuriya M, Huganir RL, and Ma- linow R. (2003). PKA phosphorylation of AMPA receptor subunits controls synaptic trafficking underlying plasticity. Nat. Neurosci. 6, 136–143. 10.1038/nn997. - DOI - PubMed
    1. Carlyle BC, Nairn AC, Wang M, Yang Y, Jin LE, Simen AA, Ramos BP, Bordner KA, Craft GE, Davies P, et al. (2014). cAMP-PKA phosphorylation of tau confers risk for degeneration in aging association cortex. Proc. Natl. Acad. Sci. 111, 5036–5041. 10.1073/pnas.1322360111. - DOI - PMC - PubMed

MeSH terms

Substances