. 2025 Jun 13;20(6):e0325155.
doi: 10.1371/journal.pone.0325155. eCollection 2025.

Fast photostable expansion microscopy using QDots and deconvolution

Affiliations

Fast photostable expansion microscopy using QDots and deconvolution

Loku Gunawardhana et al. PLoS One. .

Abstract

Expansion microscopy (ExM) enables sub-diffraction imaging by physically expanding labeled tissue samples. This increases the tissue volume relative to the instrument point spread function (PSF), thereby improving the effective resolution by reported factors of 4 - 20X. However, this volume increase dilutes the fluorescence signal, reducing both signal-to-noise ratio (SNR) and acquisition speed. This paper proposes and validates a method for mitigating these challenges. We overcame the limitations of ExM by developing a fast photo-stable protocol to enable scalable widefield three-dimensional imaging with ExM. We combined widefield imaging with quantum dots (QDots). Widefield imaging provides a significantly faster acquisition of a single field-of-view (FOV). However, the uncontrolled incoherent illumination induces photobleaching. We mitigated this challenge using QDots, which exhibit a long fluorescence lifetime and improved photostability. First, we developed a protocol for QDot labeling. Next, we utilized widefield imaging to obtain 3D image stacks and applied deconvolution, which is feasible due to reduced scattering in ExM samples. We show that increased transparency, which is a side-effect of ExM, enables widefield deconvolution, dramatically reducing the acquisition time for three-dimensional images compared to laser scanning microscopy. The proposed QDot labeling protocol is compatible with ExM and provides enhanced photostability compared to traditional fluorescent dyes. Widefield imaging significantly improves SNR and acquisition speed compared to conventional confocal microscopy. Combining widefield imaging with QDot labeling and deconvolution has the potential to be applied to ExM for faster imaging of large three-dimensional samples with improved SNR.


Conflict of interest statement

Jason Eriksen and David Mayerich have an ownership stake in SwiftFront, LLC. Wilna Moree is an employee of SwiftFront, LLC and was provided salary support. This does not alter our adherence to PLOS ONE policies on sharing data and materials.

Figures

Fig 1
Fig 1. Pre-expansion (a-h) images of triple-stained mouse brain tissue imaged using a widefield fluorescence microscope.
The tissue was successively stained for GFAP-positive astrocytes (QDot 585, yellow) (a), MBP-positive myelin (QDot 655, red) (b), Hoechst 34580 (blue) (c) and imaged using a 4X (0.13NA) and 40x water dipping objective (0.8NA) (e-g) respectively. Triple stained tissue (d) with 4X (0.13NA) and 40x water dipping objective (0.8NA) (h). Post-expansion (i-l) images of GFAP-positive astrocytes (QDot 585, yellow) (i), MBP-positive myelin (QDot 655, red) (j), Hoechst (blue) (k) and triple imaging (l) using the same 40x objective shows the preservation of all labels. The scale bar represents 50 μm (physical size) to allow comparison with the pre-expansion image (h). However, expansion microscopy physically magnified the sample 4.1X, so the 50 μm scale represents 12.2 μm structurally.
Fig 2
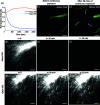
Fig 2. Photostability comparison of Alexa 594 and QDot 655.
Both labels target MBP. Timelapse measurements were taken for 35 min at 10 s intervals using a 40x water immersion objective (0.8NA). (a) The normalized intensity is plotted over time. Low-magnification images of Alexa 594 samples were obtained at 10X (0.45NA) both before (b) and after (c) 30 minutes of exposure showing the bleached region (arrows) (scale bar 200 μm). Alexa 594 time points were taken at 0 min (d), 10 min (e), 15 min (f), and QDot 655 time points were taken at 0 min (g), 30 min (h), and 50 min (i) (scale bar 50 μm).
Fig 3
Fig 3. Post-expansion photostability tests with Hoechst 34580 and QDots show complete loss of signal for Hoechst 34580, while minimal photobleaching is observed for QDots.
The 8.7% loss of intensity for QDots suggests that ExM protocols have some effect on their photostability. Timelapse measurements were taken for 5 min at 10 s intervals using a 40x water immersion objective (0.8NA). One-minute intervals were shown for Hoechst 34580 (a–f) and QDot 585 (g–l). Scale bar for the post-expansion images represents 20 μm (physical size) and 4.8 μm (structural size). The SNR (in dB) is given below each image.
Fig 4
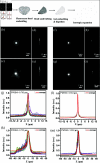
Fig 4. Comparison of radial and axial point spread functions before and after expansion.
(a) Schematic illustration of the fluorescent phantom constructed by folding microbeads (1μm) within a 10μm thick tissue section. Image stacks were obtained with a 40x water dipping objective (0.8NA) at a physical interval of 0.8μm with a wide-field fluorescence microscope. Pre-expansion profiles show a wide variability of scattering due to depth and tissue density: (b [lateral], d [axial]) minimal scattering and (c [lateral], e [axial]) significant scattering. Corresponding images after expansion are shown (f-i), demonstrating reduced scattering and a more consistent PSF. Average lateral and axial intensity profiles are shown for 15 different beads before (j, k) and after (l, m) expansion.
Fig 5
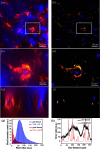
Fig 5. Pre- and post-deconvolution images of the expanded brain tissue showing GFAP (QDot 585, yellow), MBP (QDot 655, red), nuclei (Hoechst 34580, blue).
A 3D image stack was obtained from the hippocampus at a physical interval of 0.8μm using a 40x water-immersion objective (0.8NA). Maximum intensity projections are shown for raw (a, c) and deconvolved (b, d) images. Close-up images (c, d) show an astrocyte cell body. X-Z cross-sections are also shown for raw (e) and deconvolved (f) images. The intensity profile of (a,b) for the Hoechst 34580 channel is plotted as a histogram in (g). To emphasize the pattern, the zeroth intensity value is compressed in the post-decon plot. The intensity of a line drawn across (a,b) for the Hoechst 34580 channel before and after deconvolution is shown in (h).
Fig 6
Fig 6. Widefield deconvolved image comparisons of the expanded brain tissue with confocal microscopy image.
The tissue was first labeled with Hoechst-positive nuclei and then subjected to physical expansion. A 3D image stack was obtained at a physical interval of 0.6μm and deconvolution was performed. A 40x objective (0.6NA) was used for both confocal and wide-field imaging. Single focal plane images are shown for the (a) confocal and (b) wide-field deconvolved images. An x-z intensity cross-section of a selected spot is also shown for (c) confocal and (d) wide-field deconvolved images.
Fig 7
Fig 7. Widefield image comparisons of the unexpanded brain tissue with expanded tissue after deconvolution.
The tissue was first labeled with GFAP-positive astrocytes and then subjected to physical expansion. 3D image stacks were obtained with a 40x water immersion objective (0.8NA). Single images are shown before (a) and after (b) expansion, with boxed insets showing maximum intensity projections of the entire stack. X-Z intensity cross-sections are also shown before (c) and after (d) expansion.
Fig 8
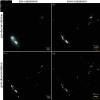
Fig 8. Comparison of GFAP-labeled astrocytes both before and after expansion (a, b) and deconvolution (c, d).
Maximum intensity projections of wide-field image stacks in both native (a) and expanded (b) samples are shown. Both image stacks were obtained with a 40x water-immersion objective (0.8NA) at regular z-axis intervals of 0.8μm. Maximum intensity projections of the deconvolved stacks are shown for both the native (c) and expanded cases. Expansion microscopy physically magnifies the sample 4.1X, and the scale bar for the post-expansion image represents the physical size (white) and structural size (yellow).
Fig 9
Fig 9. Comparison of pre- (a–c) vs. post (d–f) expansion images of GFAP-positive astrocytes imaged with a widefield fluorescence microscope with a 40x water-immersion objective (0.8NA) and deconvolved with Huygens Software (Scientific Volume Imaging).
Expansion microscopy physically magnifies the sample 4.0–4.5X. The scale bar for the post-expansion image represents physical size (white) and structural size (yellow).

Update of

References

    1. Chen F, Tillberg PW, Boyden ES. Optical imaging. Expansion microscopy. Science. 2015;347(6221):543–8. doi: 10.1126/science.1260088 - DOI - PMC - PubMed
    1. Chozinski TJ, Halpern AR, Okawa H, Kim H-J, Tremel GJ, Wong ROL, et al. Expansion microscopy with conventional antibodies and fluorescent proteins. Nat Methods. 2016;13(6):485–8. doi: 10.1038/nmeth.3833 - DOI - PMC - PubMed
    1. Ku T, Swaney J, Park J-Y, Albanese A, Murray E, Cho JH, et al. Multiplexed and scalable super-resolution imaging of three-dimensional protein localization in size-adjustable tissues. Nat Biotechnol. 2016;34(9):973–81. doi: 10.1038/nbt.3641 - DOI - PMC - PubMed
    1. Chang J-B, Chen F, Yoon Y-G, Jung EE, Babcock H, Kang JS, et al. Iterative expansion microscopy. Nat Methods. 2017;14(6):593–9. doi: 10.1038/nmeth.4261 - DOI - PMC - PubMed
    1. Tillberg PW, Chen F, Piatkevich KD, Zhao Y, Yu C-CJ, English BP, et al. Protein-retention expansion microscopy of cells and tissues labeled using standard fluorescent proteins and antibodies. Nat Biotechnol. 2016;34(9):987–92. doi: 10.1038/nbt.3625 - DOI - PMC - PubMed

LinkOut - more resources