. 2025 Jun 13;11(24):eadt2842.
doi: 10.1126/sciadv.adt2842. Epub 2025 Jun 13.

Abscisic acid enhances DNA damage response through the nuclear shuttling of clathrin light chain 2 in plant cells

Affiliations

Abscisic acid enhances DNA damage response through the nuclear shuttling of clathrin light chain 2 in plant cells

Jieming Jiang et al. Sci Adv. .

Abstract

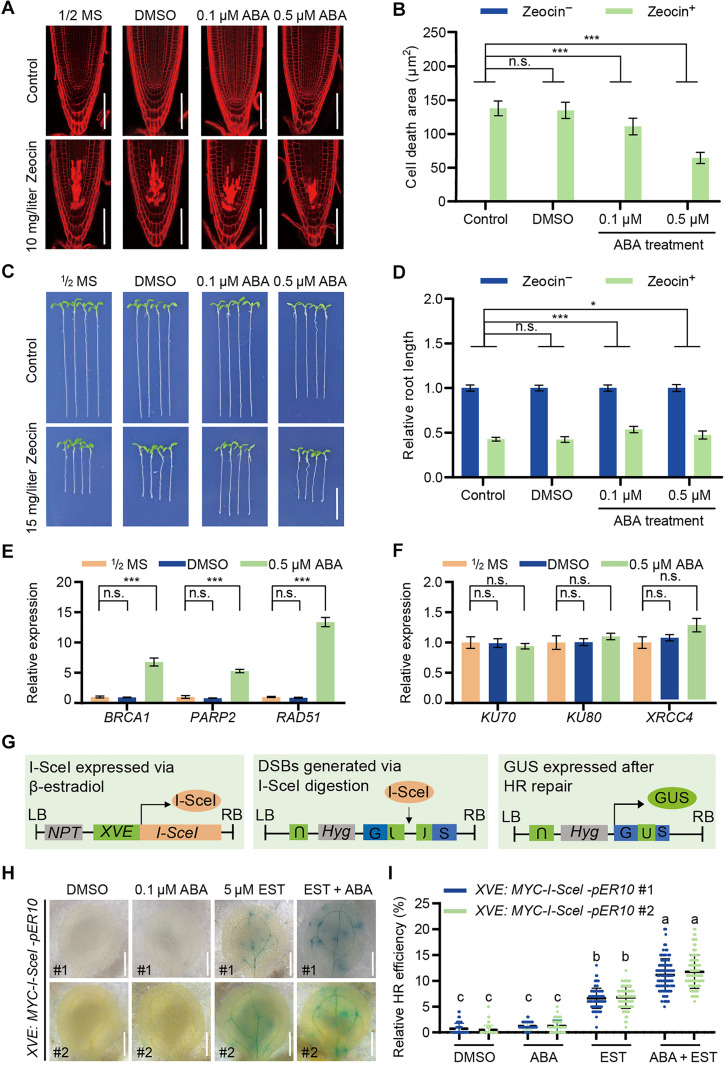
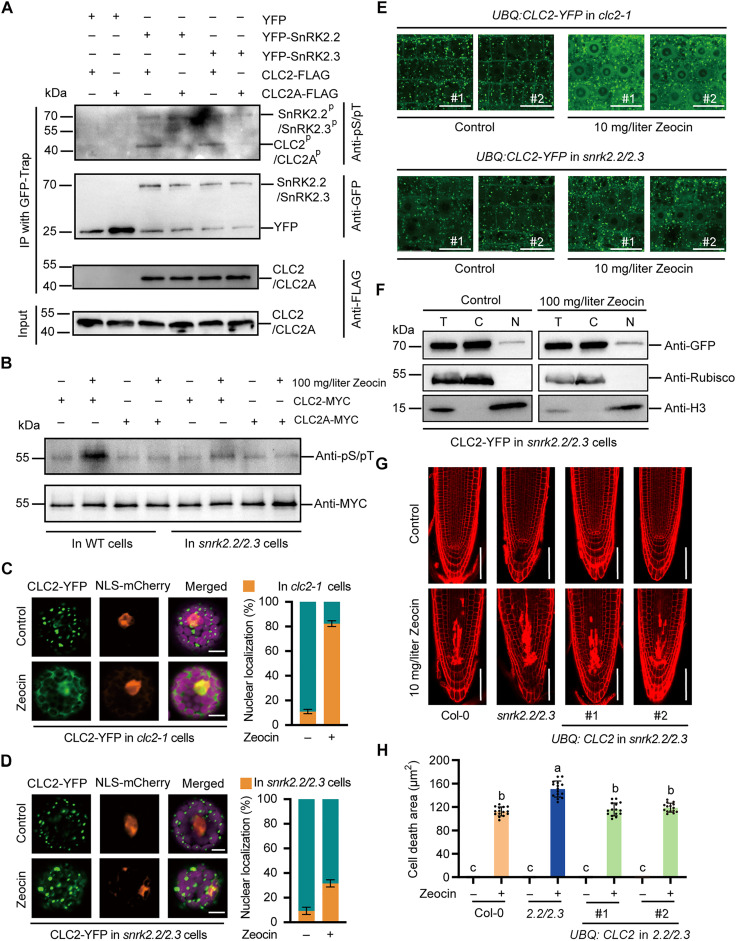
DNA damage arises from various environmental stresses, and ABA is well known for its roles in plant stress resistance. However, its function in plant DNA damage tolerance remains unclear. In this study, we showed that ABA supplementation significantly enhances plant tolerance to DNA-damaging treatments. SnRK2.2 and SnRK2.3 kinases in the ABA signaling pathway are pivotal in this process. These kinases interact with clathrin light chain 2 (CLC2), facilitating its phosphorylation and nuclear translocation in response to Zeocin and ABA treatment. In the nucleus, CLC2 interacts with ADA2b, an adaptor protein crucial for recruiting SMC5/6 complex to the double-strand break (DSB) sites. The enhanced nuclear localization of CLC2 is essential for the accurate localization of ADA2b at DSB sites. Collectively, our study uncovers that ABA enhances plant DNA damage tolerance with a distinct function of CLC2 in genomic stability maintaining, thereby improving our understanding of DNA damage tolerance mechanisms in plants.


Figures

Fig. 1.
Fig. 1.. ABA enhances plant resistance to DNA damage.
(A and B) Effects of ABA on root meristems upon DNA damage in wild-type seedlings. Five-day-old seedlings were transferred to ABA treatment for 8 hours before further treated with or without indicated ABA and Zeocin for 12 hours. Representative images from three biologically independent experiments are shown in (A) by PI staining. Scale bars, 50 μm. The quantitative data shown in (B) are means ± SD. Significant differences are indicated using two-way analysis of variance (ANOVA) analysis (Dunnett’s multiple comparisons test, n = 15). ***P < 0.001; n.s., no significance. (C and D) Effects of ABA on primary root growth upon DNA damage in wild-type seedlings. Five-day-old seedlings were transferred to ABA treatment for 8 hours before further treated with ABA and Zeocin for another 48 hours. Representative images from are shown in (C). The quantitative data shown in (D) are means ± SD. Scale bar, 1 cm. Significant differences were determined using two-way ANOVA test (Dunnett’s multiple comparisons test, n = 15). ***P < 0.001 and *P < 0.05. (E and F) Transcriptional analysis of DNA repair genes via quantitative reverse transcription polymerase chain reaction in 7-day-old seedlings treated with ABA for 12 hours. The presented data are means ± SD from three technical replicates. Student’s t test. ***P < 0.001. (G) Schematic representation of HR reporter system. The reporter line contains an I-SceI site within the GUS gene and a donor sequence (U). β-Estradiol induces I-SceI expression, creating a DSB. HR repair restores the functional GUS gene. LB, left border; RB, right border. (H and I) Representative GUS staining images of cotyledons (H) and quantification of relative HR efficiency (I) are shown. Scale bars, 0.5 cm. The number of blue sectors was counted, and the data are presented as means ± SD (n = 100). Statistical significance was determined using one-way ANOVA (Tukey’s multiple comparisons test) with different letters indicated above the columns, P < 0.001. DMSO, dimethyl sulfoxide.
Fig. 2.
Fig. 2.. ABA signaling pathway is involved in Zeocin-induced response.
(A and B) Detection of Zeocin sensitivity in abi1-2/abi2-2 mutant plants. Four-week-old leaves were transferred to 1/2 MS medium with or without Zeocin for 36 hours and then subjected to trypan blue staining. Images shown in (A) are representative results from three biologically independent experiments. Scale bars, 0.5 mm. The cell death areas are shown in (B). The data are means ± SD from three leaves with significant differences between Columbia-0 (Col-0) and mutant seedlings determined using one-way ANOVA test (Tukey’s multiple comparisons test). P < 0.001. (C and D) Detection of cell death in the abi1-2/abi2-2 mutant in ABA-mediated DNA damage tolerance. (C) The 5-day-old seedlings were transferred to medium with or without ABA for 8 hours and then incubated in medium with or without ABA and Zeocin for 12 hours. Scale bars, 50 μm. (D) Cell death areas were analyzed. Statistical data with significant differences (means ± SD; n = 15) are shown using one-way ANOVA analysis (Tukey’s multiple comparisons test). Significant differences are indicated with different letters above the columns. P < 0.001. (E and F) Detection of Zeocin sensitivity in snrk2.2/snrk2.3 mutant plants. Four-week-old leaves were transferred to 1/2 MS medium containing or lacking Zeocin for 36 hours. Representative results were shown in (E). Scale bars, 0.5 mm. The cell death areas were quantified in (F). The data are presented (means ± SD; n = 3) with significant differences determined using a one-way ANOVA (Tukey’s multiple comparisons test). P < 0.001. (G and H) Detection of cell death in the snrk2.2/snrk2.3 mutant in ABA-mediated DNA damage tolerance. Representative images shown in (G) were from three biologically independent experiments. Scale bars, 50 μm. Statistical data for the cell death areas (means ± SD; n = 15) were shown in (H). Significant differences are indicated using one-way ANOVA analysis (Tukey’s multiple comparisons test) and marked with different letters above the columns. P < 0.001.
Fig. 3.
Fig. 3.. SnRK2s interacts with CLC2 Zeocin-induced response.
(A) The interaction between SnRK2s and CLC2 was detected using yeast two-hybrid assay. SnRK2s were fused with activation domain (AD), and CLC2 was fused with binding domain (BD). The interaction was determined on SD-L-W-H medium containing 30 mM 3-amino-1,2,4-triazole (3-AT). (B) In vitro pull-down assay was used to detected the interaction of SnRK2s and CLC2. SnRK2s were fused with FLAG tag, while CLC2 was fused with GST tag. SnRK2s precipitated with GST-CLC2 and free GST (negative control) were detected using an anti-FLAG antibody. (C) Interaction of nYFP-SnRK2s and CLC2-cYFP in protoplasts via BiFC assay. Vectors were cotransformed into wild-type protoplasts obtained from 3-week-old seedlings and incubated for 24 hours before recording in a confocal microscope. Scale bars, 10 μm. (D) The association of SnRK2s and CLC2 was measured using coimmunoprecipitation assay in plant cells. CLC2-MYC was coexpressed with YFP-tagged SnRK2s or free YFP (negative control) in protoplasts. Immunoprecipitations (IP) were conducted using anti-GFP agarose and total protein. The input and IP protein signals were obtained using anti-GFP and anti-MYC antibodies, respectively. IB, immunoblotting. (E and F) Detection of ABA-mediated DNA repair in clc2-1 mutant plants. (E) Before transferred to medium with or without 0.5 μM ABA for 8 hours, the indicated seedlings were vertically grown in 1/2 MS for 5 days. Then, the seedlings were further transferred to medium with or without 0.5 μM ABA and Zeocin (10 mg/liter) for 12 hours. The experiment used DMSO as negative controls. PI staining was used to observe the cell death areas in the root meristems. Scale bars, 50 μm. (F) Cell death areas were quantified by ImageJ software (means ± SD; n = 15). One-way ANOVA analysis was used to estimate the significant differences between the control and treatments (Tukey’s multiple comparisons test). Significant differences are indicated by the different letters marked above the columns. P < 0.001.
Fig. 4.
Fig. 4.. Phosphorylation facilitates nuclear shuttling of CLC2.
(A) Localization of CLC2-YFP in wild-type (WT) cells with and without DNA damage. Representative images were shown. Scale bars, 10 μm. Percentages (means ± SD, n = 100) of cells with and without nucleus signals are from three independent experiments. (B) The distribution of CLC2-YFP is determined. Protoplasts expressing CLC2-YFP were incubated with or without Zeocin for 24 hours. The CLC2-YFP was detected by an anti-GFP antibody. Anti-Rubisco and anti-H3 antibodies were used for marking the cytoplasmic and nucleus fractions, respectively. T, Total; N, Nucleus; C, Cytoplasm. (C) The localization of CLC2-YFP and YFP-SnRK2s in intact roots of transgenic wild-type seedlings. Five-day-old seedlings were treated with or without Zeocin for 12 hours before recorded. Representative results from three independent experiments are shown. Scale bars, 15 μm. (D) Phosphorylation levels of CLC2-YFP upon DNA damage. Protoplasts expressing CLC2-YFP were incubated with or without Zeocin for 24 hours before phosphorylation detection. (E) Detection of phosphorylation sites of CLC2-YFP upon DNA damage. Protoplasts expressing CLC2-YFP or its mutated forms were incubated with or without Zeocin for 24 hours. The samples were precipitated using anti-GFP agarose from total protein. YFP and phosphorylation signals were obtained using anti-GFP and anti-phosphoserine/threonine antibodies, respectively. (F and G) Subcellar localization of CLC2A-YFP and CLC2D-YFP in wild-type cells with and without DNA damage. Representative images were shown. Scale bars, 10 μm. Percentages (means ± SD, n = 100) of cells with and without nucleus signals are from three independent experiments. (H and I) Phenotypes of CLC2A and CLC2D supplementary lines. Seedlings were grown with or without Zeocin for 7 days before recording. Representative images from three biologically independent experiments are shown in (H). Scale bars, 1 cm. Quantitative data of root length in (I) are presented as the means ± SD (n = 15). Significant differences are indicated with different letters above the columns. P < 0.001, Tukey’s multiple comparisons test.
Fig. 5.
Fig. 5.. SnRK2s enhances phosphorylation of CLC2.
(A) In vitro phosphorylation of CLC2 via SnRK2s. The YFP-SnRK2.2 and YFP-SnRK2.3 proteins were immunoprecipitated and incubated with the CLC2-FLAG or CLC2A-FLAG supernatant in kinase buffer for 2 hours. Samples were detected with anti-FLAG, anti-GFP, and anti- phosphoserine/threonine antibodies, respectively. (B) In vivo phosphorylation of CLC2 via SnRK2s under DNA damage conditions. CLC2-MYC and CLC2A-MYC were expressed in wild-type or snrk2.2/2.3 protoplasts with or without Zeocin for 24 hours. The results were detected with anti-GFP and anti-phosphoserine/threonine antibodies, respectively. (C and D) Localization of CLC2-YFP in clc2-1 (C) and snrk2.2/2.3 (D) cells with and without DNA damage. Scale bars, 10 μm. Percentages (means ± SD; n = 100) of cells with and without nucleus localization are from three independent experiments. (E) The localization of CLC2-YFP in intact clc2-1 (E) and snrk2.2/2.3 roots. Five-day-old seedlings are incubated in medium with or without Zeocin for 12 hours before recorded. The images are representative results from three biologically independent experiments. Scale bars, 15 μm. (F) The distribution of CLC2-YFP in snrk2.2/2.3 cells. The vector expressing CLC2-YFP was incubated with or without Zeocin for 24 hours. The CLC2-YFP was detected by an anti-GFP antibody. Anti-Rubisco and anti-H3 antibodies were used for marking the cytoplasmic and nucleus fractions, respectively. (G and H) The effect of CLC2 overexpression on cell death in root meristems of snrk2.2/snrk2.3 mutant. (G) Seeds were sown on 1/2 MS medium for 5 days before subjected with Zeocin for 12 hours. The root meristems were observed using PI staining. Three biologically independent experiments were conducted, and representative images are shown. Scale bars, 50 μm. (H) Cell death areas were quantified (means ± SD; n = 15). Significant differences were indicated using different letters above the columns. The data are means ± SD from triplicated experiments. P < 0.001, Tukey’s multiple comparisons test.
Fig. 6.
Fig. 6.. CLC2 is essential for precise DSB localization of ADA2b.
(A) Interaction between CLC2 (fused with BD) and ADA2b (fused with AD) in yeast two-hybrid assay. The interaction was determined on SD-L-W-H medium containing 30 mM 3-AT. (B) Coimmunoprecipitation assay was used to measure the association of CLC2 and ADA2b in plant cells. CLC2-MYC, coexpressed with YFP-ADA2b or free YFP (negative control), was treated with ABA for 12 hours. Total proteins were purified using anti-GFP agarose. Both input and IP proteins were subjected with SDS-PAGE, and the signals were detected using anti-GFP and anti-MYC antibodies, respectively. (C and D) Subcellar localization of YFP-ADA2b in wild-type (C) and CLC2 mutant (D) cells with and without DNA damage. Representative images of YFP (green), mCherry (orange), and merged signals are shown in the left-hand graphs. Scale bars, 5 μm. The percentage of cells with (orange) and without (green) YFP foci signals are shown as means ± SD (n = 100) from three independent experiments in the right-hand graphs. (E and F) Cell death area of YFP-ADA2b overexpression lines on clc2-1 mutant under normal and DNA damage conditions. Five-day-old seedlings were transferred to Zeocin for 12 hours. Three biologically independent experiments were conducted, and the representative results stained by PI are shown in (E). Scale bars, 1 cm. The cell death area was presented as means ± SD (n = 15) in (F). Letters above the columns indicate the significant differences. P < 0.001, Dunnett’s multiple comparisons test. (G) A proposed model for ABA-mediated DNA damage response in plant cells. DNA damage up-regulated the ABA and ROS levels in cells, which activates SnRK2s in the ABA signaling pathway for the phosphorylation and nuclear recruitment of CLC2. CLC2 interacted with ADA2b in the nucleus and possibly regulated its chromatin disassociation for further recruitment at DSBs.

Similar articles

References

    1. Hakem R., DNA-damage repair; the good, the bad, and the ugly. EMBO J. 27, 589–605 (2008). - PMC - PubMed
    1. Huang R., Zhou P. K., DNA damage repair: Historical perspectives, mechanistic pathways and clinical translation for targeted cancer therapy. Signal Transduct. Target. Ther. 6, 254 (2021). - PMC - PubMed
    1. Todorova T., Miteva D., Chankova S., DNA damaging effect of zeocin and methyl methanesulfonate in saccharomyces cerevisiae measured by CFGE. C. R. Acad. Bulg. Sci. 68, 71–78 (2015).
    1. Pedroza-Garcia J. A., Xiang Y., De Veylder L., Cell cycle checkpoint control in response to DNA damage by environmental stresses. Plant J. 109, 490–507 (2022). - PubMed
    1. Moorhead G. B. G., Trinkle-Mulcahy L., Ulke-Lemée A., Emerging roles of nuclear protein phosphatases. Nat. Rev. Mol. Cell Biol. 8, 234–244 (2007). - PubMed

MeSH terms

LinkOut - more resources