. 2025 Jun 13;11(24):eadu1823.
doi: 10.1126/sciadv.adu1823. Epub 2025 Jun 13.

AbEpiTope-1.0: Improved antibody target prediction by use of AlphaFold and inverse folding

Affiliations

AbEpiTope-1.0: Improved antibody target prediction by use of AlphaFold and inverse folding

Joakim Nøddeskov Clifford et al. Sci Adv. .

Abstract

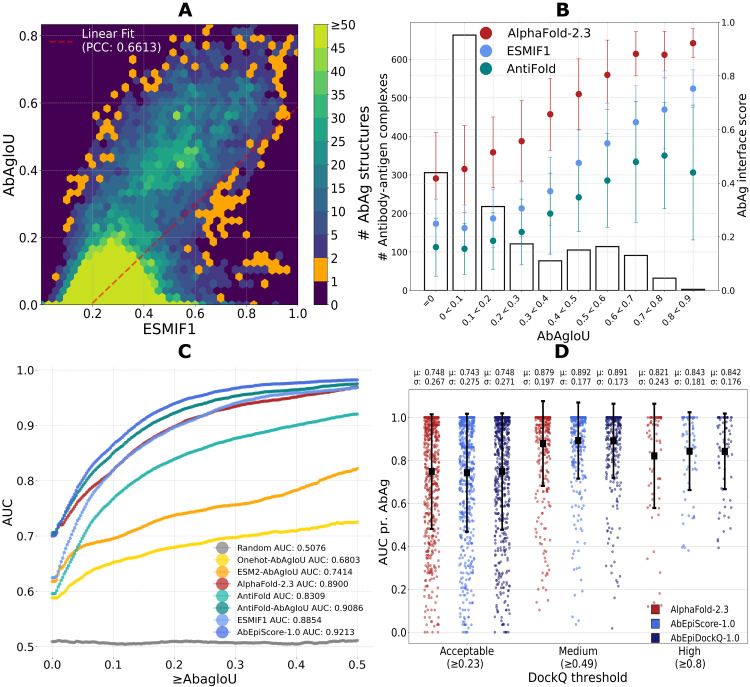
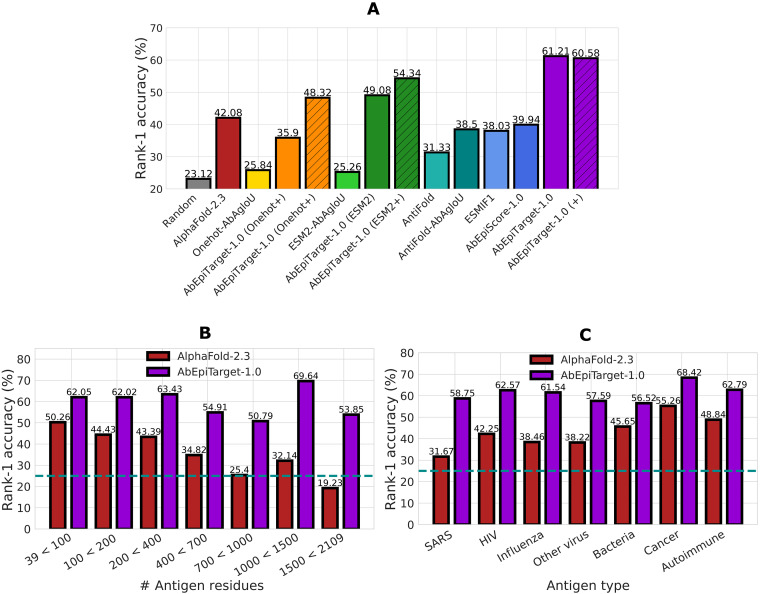
B cell epitope prediction tools are crucial for designing vaccines and disease diagnostics. However, predicting which antigens a specific antibody binds to and their exact binding sites (epitopes) remains challenging. Here, we present AbEpiTope-1.0, a tool for antibody-specific B cell epitope prediction, using AlphaFold for structural modeling and inverse folding for machine learning models. On a dataset of 1730 antibody-antigen complexes, AbEpiTope-1.0 outperforms AlphaFold in predicting modeled antibody-antigen interface accuracy. By creating swapped antibody-antigen complex structures for each antibody-antigen complex using incorrect antibodies, we show that predicted accuracies are sensitive to antibody input. Furthermore, a model variant optimized for antibody target prediction-differentiating true from swapped complexes-achieved an accuracy of 61.21% in correctly identifying antibody-antigen pairs. The tool evaluates hundreds of structures in minutes, providing researchers with a resource for screening antibodies targeting specific antigens. AbEpiTope-1.0 is freely available as a web server and software.


Figures

Fig. 1.
Fig. 1.. We measure the ability of AbAg interface scoring models to predict and classify accurately modeled AbAg structures.
(A) Min-max–scaled ESMIF1 scores (x axis) and AbAgIoU values (y axis) for 51,900 structures from 1730 AbAgs are placed into 2D hexagonal bins. A color scale capped at 50 structures shows the structure count per bin, and orange indicates bins containing a single structure. A red dashed line indicates a linear fit computed across all structures. (B) The best of 30 modeled structures (based on the highest AbAgIoU) for each AbAg is binned by AbAgIoU (x axis). The left y axis shows the number of AbAgs per bin, and the right y axis shows the average and SD of interface scores (AlphaFold-2.3, ESMIF1, and AntiFold) within each bin. (C) AUC values across 205 AbAgIoU accuracy thresholds (0.0 to 0.5) (x axis) compare the model performance of random, AlphaFold, AntiFold, ESMIF1, AbEpiScore, and AbAgIoU models (y axis). (D) Box plot of AUC scores per AbAg (y axis) compares AlphaFold, AbEpiScore-1.0, and AbEpiDockQ-1.0 at classifying CAPRI standard accuracy bin (defined by DockQ) structures (x axis): acceptable (≥0.23), medium (≥0.49), and high (≥0.8), containing 604, 359, and 72 AbAgs, respectively.
Fig. 2.
Fig. 2.. We compare AbEpiScore-1.0 and AlphaFold-2.3 at scoring modeled structures of an antibody targeting insulin-like growth factor 2.
Crystal of insulin-like growth factor 2 (black) bound to an antibody (gray) (PDB: 3KR3). Modeled antibody structures have been colored from low (blue) to high (red) according to AbEpiScore-1.0 (left; PCC, 0.8010) and AlphaFold-2.3 (right; PCC, 0.2231).
Fig. 3.
Fig. 3.. We measure the model’s ability to identify AbAg structures modeled with the correct antibody and antigen from those modeled with the incorrect antibody.
(A) Rank-1 accuracy (%) for 1730 groups of true and swapped AbAgs modeled with the same antigen. The x axis shows the model score used, with (+) indicating models incorporating AbEpiScore-1.0 as an additional feature. (B) The groups were categorized by antigen sizes based on residue count (x axis), and the rank-1 accuracy for AlphaFold-2.3 and AbEpiTarget-1.0 computed (y axis). There were 195, 682, 484, 224, 63, 56, and 26 antigen groups in these categories from left to right. A dashed line indicates random performance (25%). (C) The groups were categorized by antigen type (x axis) and the rank-1 accuracy for AlphaFold-2.3 and AbEpiTarget-1.0 computed (y axis). The antigen types and number of groups in each category were SARS (240), HIV (187), influenza (117), other virus (191), bacteria (46), cancer (114), and autoimmune (43). “Other virus” includes malaria, dengue, Zika, hepatitis, and herpes viruses.
Fig. 4.
Fig. 4.. We compare the AbEpiTarget-1.0 scores and ground truth epitope accuracy of AbAg structures modeled with the correct antibody and antigen (true AbAg) against those of structures modeled with an incorrect antibody (swapped AbAg).
(A) Min-max–scaled AbEpiTarget-1.0 scores (x axis) for 51,900 true and (B) 155,570 swapped AbAg structures were plotted against corresponding AgIoU values (y axis) in hexagonal bins. Color scales capped at 50 structures show the structure count per bin, and orange indicates single structure bins. Red dashed lines indicate linear fits computed across all true or swapped AbAg structures. All true (C) and swapped (D) AbAg structures were placed into 25 square bins indicated by the black boundaries based on AbEpiTarget-1.0 scores and AgIoU values, with percentages and color scale indicating the distribution. (E) We compute a percentage score, TrueΔSwap (see Eq. 2 in Materials and Methods), indicating which bins the true or swapped AbAg structures are overrepresented. This score ranges from −100% (only swapped structures were counted) to 100% (only true structures were counted).
Fig. 5.
Fig. 5.. Performance evaluation of AlphaFold-2.3 and AbEpiTarget-1.0 on AbAg subsets released before and after AlphaFold-2.3’s training date (Before and After).
(A) A violin scatter plot comparing model performance in classifying structures with DockQ ≥ 0.23 per AbAg. AUC scores were computed for 547 of 1529 (Before) and 52 of 109 (After) AbAgs (y axis). (B) Rank-1 accuracy (%) (y axis) for both subsets comparing AlphaFold-2.3 and AbEpiTarget-1.0, with a dashed line indicating random performance (25%). (C) Before antigen groups were ranked from highest to lowest based on their maximum score, whether from the true AbAg or one of three swapped AbAgs. True rank scores (0 = worst ranking, 1 = perfect ranking; see Eq. 3) were computed for all antigen groups. Then, average true rank scores were computed (y axis) as more antigen groups were included in this average along the x axis. (D) The same analysis as in (C) but for the After data.
Fig. 6.
Fig. 6.. Screenshots of the input and output pages for AbEpiTope-1.0 web server.
The input page allows users to upload a single AbAg complex in PDB or Crystallographic Information File (CIF) file format as well as multiple complexes in a .zip file, with example .zip files provided for SARS, HIV, Pseudomonas aeruginosa, PD-1 receptor, grass pollen, and a SARS antigen with four modeled antibodies (one experimentally confirmed to target SARS and three others targeting different antigens). Each .zip file contains 30 structures made with AlphaFold-2.3. Users can also set the angstrom distance to define AbAg interfaces (default, 4 Å). The output page provides a downloadable .zip file of all results and a table that can be sorted by AbEpiScore-1.0 or AbEpiTarget-1.0 scores and exported as a .csv file.

Similar articles

References

    1. Roe S. K., Felter B., Zheng B., Ram S., Wetzler L. M., Garges E., Zhu T., Genco C. A., Massari P., In vitro pre-clinical evaluation of a gonococcal trivalent candidate vaccine identified by transcriptomics. Vaccines 11, 1846 (2023). - PMC - PubMed
    1. Liu T., Gao C., Wang J., Song J., Chen X., Chen H., Zhao X., Tang H., Gu D., Peptide aptamer-based time-resolved fluoroimmunoassay for CHIKV diagnosis. Virol. J. 20, 166 (2023). - PMC - PubMed
    1. Kozlova E. E. G., Cerf L., Schneider F. S., Viart B. T., Nguyen C., Steiner B. T., de Almeida Lima S., Molina F., Duarte C. G., Felicori L., Chávez-Olórtegui C., Machado-de-Ávila R. A., Computational B-cell epitope identification and production of neutralizing murine antibodies against Atroxlysin-I. Sci. Rep. 8, 14904 (2018). - PMC - PubMed
    1. Larsen J. E., Lund O., Nielsen M., Improved method for predicting linear B-cell epitopes. Immunome. Res. 2, 2 (2006). - PMC - PubMed
    1. Jespersen M. C., Peters B., Nielsen M., Marcatili P., BepiPred-2.0: Improving sequence-based B-cell epitope prediction using conformational epitopes. Nucleic Acids Res. 45, W24–W29 (2017). - PMC - PubMed

LinkOut - more resources