. 2025 Jun 13;11(24):eadt7046.
doi: 10.1126/sciadv.adt7046. Epub 2025 Jun 13.

Regulation of PIEZO1 channel force sensitivity by interblade handshaking

Affiliations

Regulation of PIEZO1 channel force sensitivity by interblade handshaking

Katie A Smith et al. Sci Adv. .

Abstract

PIEZOs form trimeric calcium-permeable nonselective cationic channels that serve mechanical sensing needs across eukaryotic biology. Forces act on the channels by causing their curved blades to flatten and decompact, leading to an activated state, but it is unclear how this is regulated to enable the channels to adapt to different contexts. To identify potential mechanisms, we performed coarse-grained and all-atom molecular dynamics simulations on human PIEZO1. We observed an interblade handshake interaction mediated by basic amino acid residues in two flexible helices coordinated with regulated anionic lipid phosphatidylinositol 4,5-bisphosphate. The interaction determined the resting configuration of the channel, blade curvature, compactness, and ion pore structure. In experiments, disruption of the handshake by neutralization of helix amino acids or phosphatidylinositol 4,5-bisphosphate depletion increased the channel's sensitivity to membrane tension. Structural and amino acid sequence analysis for multiple PIEZOs predicted helix amino acid arrangements for varied handshaking intensity. We suggest a dynamic interaction in PIEZO channels that regulates force sensitivity.


Figures
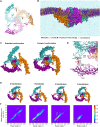
Fig. 1.
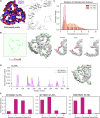
Fig. 1.. Interblade handshake in a computer model of hPIEZO1 channel.
(A) Full-length structural model of hPIEZO1 channel shown in a cartoon representation with chains (one chain per one hPIEZO1 protein) in orange, purple, and cyan shown from above. Regions resolved in cryo-EM studies of mPIEZO1 channel are shown in light color, and unresolved regions modeled are shown in darker color (see Materials and Methods). (B) Snapshot taken from a trajectory for the hPIEZO1 channel simulated in an endothelial model membrane at coarse-grained resolution. hPIEZO1 backbone is shown in QuickSurf representation. Bilayer lipids are shown in Van der Waals representation: phosphatidylcholine (POPC; blue), phosphatidylethanolamine (POPE; yellow), phosphatidylserine (POPS; red), PIP2 (green), sphingomyelin (SM; dark green), and cholesterol (pink). Water molecules (light blue) and ions (Na+, Cl, and Ca2+; black) are shown in points representation. (C) hPIEZO1 structures extracted from simulation trajectories adopting extended (left) and compact (right) conformations. hPIEZO1 is shown in QuickSurf representation. hPIEZO1 chains are shown in orange, magenta, and cyan. (D) Site of handshake interaction between two blades, highlighting two helices that are part of this interaction. hPIEZO1 chains are shown in dynamic bonds representation. Amino acid residues involved in the interaction when the handshake is formed, identified by protein contact analysis, are shown as red beads. (E) hPIEZO1 structures extracted from the simulation trajectory in which 0, 1, 2, and 3 handshake interactions are formed. (F) 2D histogram of the distance between the N-terminal THU1 and the pore (blade distance from the pore) and the angle formed by the blade. Histograms were calculated separately for frames in which hPIEZO1 forms 0, 1, 2, and 3 handshakes [aligned to images in (E)].
Fig. 2.
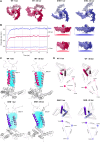
Fig. 2.. Involvement of PIP2 in the handshake.
(A) Electrostatic profile of hPIEZO1 mapped onto hPIEZO1 structure (left). Arginine residues on the handshake helices (right). (B) PIP2 density averaged across five repeat simulations (left). PIP2 contacts mapped onto PIEZO1 structure (right). PIEZO1 backbone is colored according to the number of PIP2 contacts with no contacts shown in white and high number of contacts in green. (C) Histogram of distances between the final residue of each helix which forms the handshake interaction for hPIEZO1 simulated in an endothelial membrane containing 5% PIP2 (pink) and 0% PIP2 (orange) (top). Example structures were extracted corresponding to helix tip separation distances of 1.5, 4, and 8 nm with helices in red (bottom). (D) PIP2 contacts with the SH of the handshake for wild-type (WT) hPIEZO1 (pink) and the SH mutant (SHM; purple) simulated in an endothelial membrane containing 5% PIP2. PIP2 contacts were mapped to the SHM structure with no contacts shown in white and high number of contacts shown in green. PIP2 contacts are abolished on the SH, where the mutations were made, compared to the LH and the WT channel shown in (B) (right). (E) Frequency of the 0, 1, 2, and 3 handshake conformations for WT hPIEZO1 simulated in the presence of PIP2 (left) or absence of PIP2 (center) and SHM hPIEZO1 simulated in the presence of PIP2 (right).
Fig. 3.
Fig. 3.. Handshaking occurs in modes that depend on PIP2 distribution.
The handshake distance (between the final residues of each helix involved in the handshake interaction) and the number of PIP2 lipids within 2.5 nm of the SH of the interaction were plotted over simulation time. On the left, example plots characteristic of stable handshaking (A), handshake release (B), and unstable handshaking (C). On the right, snapshots associated with the distinct stages of each handshake mode. The backbone of hPIEZO1 is shown in surface representation in white. The handshake helices are pink. Each green bead corresponds to the headgroup of one PIP2 lipid. These plots are examples that were identified from the plots of the complete simulations shown in figs. S9 to S13.
Fig. 4.
Fig. 4.. Effect of interblade handshaking on PIEZO1 conformational changes in response to applied tension.
A snapshot from CG-MD simulations of WT and SHM hPIEZO1 simulated in a model endothelial membrane containing 5% PIP2 was converted to AT resolution and simulated in the presence of (−30 bar) and the absence of (+1 bar) tension. (A) Final snapshots following AT simulations under each condition are shown for WT (pink) and SHM (purple) hPIEZO1 from the top view. Backbones of the channels are shown in surface representation. Each chain is shown in a different shade of pink for WT and purple for SHM. (B) Projected area of the channel was calculated over simulation time WT (pink) and SHM (purple) hPIEZO1 (left). Data for 1- and −30-bar simulations are shown in light (1 bar) and dark (−30 bar) colors. Final snapshots of WT and SHM hPIEZO1 are shown from side view and include depictions of the projected area under each condition at 50 ns (right). (C and D) Characterization of the inner cavity of the pore for WT (pink) and SHM (purple) hPIEZO1 following AT simulation for 50 ns at 1 and −30 bar. Residues 2424 to 2521 are shown in cartoon representation. The inner pore helix residues (residues 2438 to 2458) are colored in shades of pink for WT and purple for SHM. Regions which do not form the inner helix are white and transparent. (C) The pore is shown from the side view. Volume of the pore was calculated using trjcavity and is shown in cyan. (D) The pore is shown from the top view. The area of the triangle formed by residue Y2444 in each chain is depicted below each snapshot.
Fig. 5.
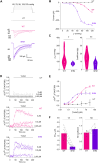
Fig. 5.. SHM enhances mechanical and agonist sensitivities.
Outside-out patch electrophysiology (A to C) and intracellular Ca2+ measurements (D to F) in HEK293 cells expressing WT hPIEZO1, SHM hPIEZO1, or neither (UT). (A) Example current traces with pressure pulses are shown at the top. (B) Peak inward current amplitudes for the experiments of (A) plotted against pressure (p) and fitted using the Boltzmann function. (C) Boltzmann function parameters for all experiments of the type illustrated in (B), showing the p for 50% activation (p50) (left) and the Boltzmann coefficient (right). Data are represented as violin plots with individual data points superimposed (WT n = 15 and SHM n = 13 independent patch recordings). Statistical test (unpaired t test not assuming equal variance) probability (P) results were *P < 0.05 (P = 0.02006) and **P < 0.01 (P = 0.00151). Values for WT are estimates because the currents did not saturate. (D) Example UT, WT, and SHM data showing change (Δ) in intracellular Ca2+ in response to Yoda2 indicated by the Fura-2 fluorescence (F) ratio F340/F380. Data are means ± SEM for three wells (technical replicates) in a 96-well plate (one independent experiment each). (E) Peak ΔCa2+ amplitudes for the experiments of (D) plotted against Yoda2 concentration and fitted using the Hill function. (F) Hill function parameters for all experiments of the type illustrated in (E), showing the concentration of Yoda2 for 50% effect (EC50) (left) and the Hill coefficient (right). Data are means ± SD with individual data points superimposed (WT n = 5 and SHM n = 5 independent experiments). Dashed lines join the data points for each paired comparison of WT and SHM. Statistical test (paired t test) probability (P) results were **P < 0.01 (P = 0.0074) and NS (not significant, P = 0.15494).
Fig. 6.
Fig. 6.. PIP2 depletion enhances mechanical sensitivity of WT but not SHM hPIEZO1.
Outside-out patch data for HEK293 cells expressing WT or SHM hPIEZO1. (A) Example current traces with pressure pulses shown at the top. (B) Peak inward currents for experiments of the type shown in (A). WT (n = 15), WT PIP2 depleted (n = 15 except n = 11 for 60 mmHg), and WT PIP2 depleted + diC8 PIP2 (n = 20 except n = 19 for 60 mmHg) data. The statistical test was one-way analysis of variance (ANOVA) with Tukey analysis and the probability (P) results were NS (not significantly different, P > 0.05) or *(P < 0.05): 30 mmHg WT versus WT depleted P = 0.02; WT depleted versus WT depleted + diC8 P = 0.03; 45 mmHg WT versus WT depleted P = 0.02; WT depleted versus WT depleted + diC8 P = 0.04; 60 mmHg WT versus WT depleted P = 0.049; WT depleted versus WT depleted + diC8 P = 0.15. (C) Boltzmann function parameters showing the pressure (p) for 50% activation (p50) (left) and Boltzmann coefficient (right) for the experiments of (B). Data are means ± SD with individual data points superimposed (WT depleted n = 9 and WT PIP2 depleted + diC8 n = 6 independent patch recordings). Statistical test (unpaired t test not assuming equal variance) probability (P) results were ***(P = 6.17 × 10⁻⁵) and NS (not significantly different). (D) Similar to (B) but for SHM (n = 13), SHM PIP2 depleted (n = 16), and SHM PIP2 depleted + diC8 PIP2 (n = 22) data. The statistical test was two-sample t test, unpaired, unequal variance, and the probability results all indicated NS (not significantly different).
Fig. 7.
Fig. 7.. Summary of the handshake concept.
An interblade handshake interaction regulates the dynamic motion of the blade domains and the depth of the membrane footprint. This interaction is facilitated by PIP2 lipids (green) which interact with basic amino acid residues (red crosses) in the handshake helices, allowing them to come together. Stochastic or regulated dispersion of PIP2 leads to loss of neutralization of the positive charge, leading to repulsion of the helices (handshake release), driving PIEZO1 to more extended states that are less compact and the ion pore region is more dilated (pore not shown). These states require less tension in the membrane to move to a flat active state. The C-terminal extracellular domain (CED) and the PIEZO1 ion pore region are also shown.

References

    1. Coste B., Mathur J., Schmidt M., Earley T. J., Ranade S., Petrus M. J., Dubin A. E., Patapoutian A., Piezo1 and Piezo2 are essential components of distinct mechanically activated cation channels. Science 330, 55–60 (2010). - PMC - PubMed
    1. Coste B., Xiao B., Santos J. S., Syeda R., Grandl J., Spencer K. S., Kim S. E., Schmidt M., Mathur J., Dubin A. E., Montal M., Patapoutian A., Piezo proteins are pore-forming subunits of mechanically activated channels. Nature 483, 176–181 (2012). - PMC - PubMed
    1. Syeda R., Florendo M. N., Cox C. D., Kefauver J. M., Santos J. S., Martinac B., Patapoutian A., Piezo1 channels are inherently mechanosensitive. Cell Rep. 17, 1739–1746 (2016). - PMC - PubMed
    1. Li J., Hou B., Tumova S., Muraki K., Bruns A., Ludlow M. J., Sedo A., Hyman A. J., McKeown L., Young R. S., Yuldasheva N. Y., Majeed Y., Wilson L. A., Rode B., Bailey M. A., Kim H. R., Fu Z., Carter D. A. L., Bilton J., Imrie H., Ajuh P., Dear T. N., Cubbon R. M., Kearney M. T., Prasad K. R., Evans P. C., Ainscough J. F. X., Beech D. J., Piezo1 integration of vascular architecture with physiological force. Nature 515, 279–282 (2014). - PMC - PubMed
    1. Duchemin A. L., Vignes H., Vermot J., Mechanically activated piezo channels modulate outflow tract valve development through the Yap1 and Klf2-Notch signaling axis. eLife 8, e44706 (2019). - PMC - PubMed

MeSH terms

Substances

LinkOut - more resources