

Published Erratum
. 2025 Jul 7;222(7):e2020141606022025c.
doi: 10.1084/jem.2020141606022025c.
Epub 2025 Jun 13.
Correction: Mitophagy-mediated adipose inflammation contributes to type 2 diabetes with hepatic insulin resistance
- PMID: 40513072
- PMCID: PMC12164727
- DOI: 10.1084/jem.2020141606022025c
Item in Clipboard
Published Erratum
Correction: Mitophagy-mediated adipose inflammation contributes to type 2 diabetes with hepatic insulin resistance
J Exp Med.
.
No abstract available
Figures

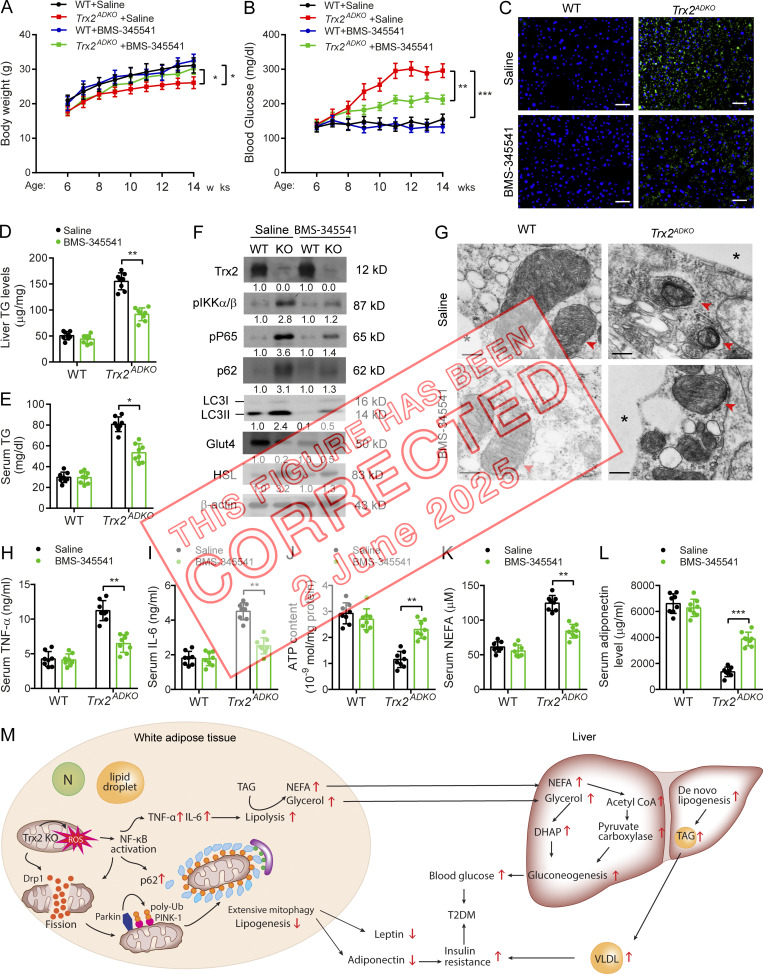
Inhibition of NF-κB activity ameliorates T2DM in Trx2
ADKO
mice. 6-wk-old male Trx2ADKO and WT mice were treated with 60 mg/kg BMS-345541 by i.p. injection once every 2 d for 8 wk. (A and B) Body weight (A) and fasting blood glucose levels (B) in WT and Trx2ADKO mice with or without BMS-345541 treatment (n = 8) at the indicated ages. (C) Representative images of BODIPY staining showing liver lipid deposition of mice at 14 wk of age. Scale bars, 50 µm. (D and E) Liver TG content and serum TG level were measured. n = 6. (F) Immunoblot analysis of eWAT tissues from mice at 14 wk of age. Protein levels were quantified and presented as fold changes by taking WT as 1.0. n = 3 mice for each group. (G) Representative transmission electron micrographs of eWAT sections from mice at 14 wk of age (six images/mouse, n = 3 mice/group). Asterisks indicate LDs. Arrowheads indicate mitochondria. Scale bars, 0.5 µm. (H and I) Serum cytokines TNF-α and IL-6 proteins were measured by ELISA kits (n = 8). (J) ATP content of mitochondria isolated from eWAT of mice at 14 wk of age (n = 8). (K and L) Serum levels of NEFA (K) and adiponectin (L) of 14-wk-old mice (n = 8). Quantitative data are presented as mean ± SEM. *, P < 0.05; **, P < 0.01; ***, P < 0.001 versus the indicated comparisons. Significance was assessed by one-way ANOVA followed by Tukey’s post hoc test. (M) A schematic diagram summarizing our findings that Trx2 deficiency promotes severe mitophagy via mitochondrial ROS/NF-κB/p62 signaling, which contributes to hepatic insulin resistance related T2DM (see text for details). N, nucleus; DHAP, dihydroxyacetonephosphate. TAG, triacylglycerol; VLDL, very low-density lipoprotein.

Trx2
ADKO
mice develop T2DM-related end-organ damage. (A–E)
Trx2-KO mice exhibit decreased insulin content and increased β cell apoptosis. (A) Representative hematoxylin and eosin–stained pancreas sections showing pancreatic islets of WT and Trx2ADKO mice at the indicated ages. Scale bars, 20 µm. (B) Nuclei density of six randomly selected pancreatic islets (n = 6 mice). (C) Detection of β cell apoptosis by costaining of TUNEL (green) and insulin (red). Representative images from WT and Trx2ADKO mice at the indicated ages. Scale bars, 20 µm. (D) Quantification of TUNEL-positive β cells (right panel; n = 6 mice). (E) Representative transmission electron micrographs of pancreas tissue from WT and Trx2ADKO mice (three images/mouse, n = 3 mice/group). Squares correspond to the magnified areas (bottom panel). Scale bars, 1 µm. M, mitochondria. Arrowheads indicate empty granules. (F) Quantification of insulin granules per µm2 islet. (G) Representative transmission electron micrographs of kidney tissue from WT and Trx2ADKO mice (n = 3). White squares correspond to the magnified areas (bottom panel). Red arrowhead indicates podocyte foot process fusion. Scale bars, 1 µm. (H–L) Quantitative analysis of de novo lipogenesis and hepatic gluconeogenic genes. (H) Relative mRNA expression of lipogenesis genes in liver in 14-wk-old male WT and Trx2ADKO mice (n = 6). (I and J) Relative mRNA expression of hepatic gluconeogenic genes in liver of 14-wk-old male WT and Trx2ADKO mice (n = 8). (K) Relative mRNA expression of the indicated de novo lipogenesis genes in eWAT of 14-wk-old male WT and Trx2ADKO mice (n = 8). (L) Relative mRNA expression of lipolysis genes in eWAT in 14-wk-old male WT and Trx2ADKO mice (n = 6). Quantitative data represent the mean ± SEM. ns, not significant; **, P < 0.01; ***, P < 0.001 compared with WT controls (two-tailed Student’s t test). Acc, acetyl-CoA carboxylase 1; Atgl, adipose TG lipase; Fasn, fatty acid synthase; G6p, glucose 6-phosphatase; Gck, glucokinase; Gys2, glycogen synthase 2; Hsl, hormone-sensitive lipase; Lpl, lipoprotein lipase; Pc, pyruvate carboxylase. (M–P) TEM analysis of brown adipose mitochondria. (M) Representative transmission electron micrographs of interscapular BAT (iBAT) sections from WT and Trx2ADKO mice at the indicated ages. Asterisks indicate LDs. Squares correspond to the magnified areas (bottom panel). Arrowheads indicate mitochondria. Scale bars, 0.5 µm. (N–P) Number of mitochondria, number of damaged mitochondria, and cristae surface area/outer membrane (OM) surface area (six images/mouse; n = 3 mice/group). Quantitative data represent the mean ± SEM. ns, not significant; *, P < 0.05; **, P < 0.01; ***, P < 0.001 versus WT (two-tailed Student’s t test). w, weeks.

Erratum for
-
Mitophagy-mediated adipose inflammation contributes to type 2 diabetes with hepatic insulin resistance.J Exp Med. 2021 Mar 1;218(3):e20201416. doi: 10.1084/jem.20201416. J Exp Med. 2021. PMID: 33315085 Free PMC article.
Publication types
LinkOut - more resources
Full Text Sources
