. 2025 Oct 15;232(4):790-795.
doi: 10.1093/infdis/jiaf321.

The Oral Microbiome and All-Cause Mortality in a US Population-Representative Prospective Cohort

Affiliations

The Oral Microbiome and All-Cause Mortality in a US Population-Representative Prospective Cohort

Emily Vogtmann et al. J Infect Dis. .

Abstract

No large studies have evaluated whether the human oral microbiome is directly associated with mortality. We evaluated prospective associations between the oral microbiome, measured using 16S ribosomal RNA gene sequencing, from participants aged 20-69 years in the 2009-2012 cycles of the National Health and Nutrition Examination Survey (NHANES) and all-cause mortality (N = 7721, representing ∼194 million individuals). Alpha diversity was inversely associated with mortality, and some significant associations were observed with the beta diversity matrices. Higher relative abundances of Granulicatella and Lactobacillus were associated with increased risk, while Bacteroides was associated with decreased all-cause mortality at the genus level. Results suggest that oral bacterial communities may be important contributors to health and disease.

Keywords: NHANES; bacteria; human oral microbiome; mortality; population-representative sample.


Conflict of interest statement

Potential conflicts of interest. The authors: No reported conflicts of interest. All authors have submitted the ICMJE Form for Disclosure of Potential Conflicts of Interest. Conflicts that the editors consider relevant to the content of the manuscript have been disclosed.

Figures
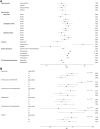
Figure 1.
Figure 1.
A, Forest plot of the estimated hazard ratios (HRs) with 95% confidence intervals (CIs) and P values for the associations of alpha diversity (ie, observed amplicon sequence variants, Faith phylogenetic diversity [PD], Shannon-Weiner, and Simpson indices), beta diversity (ie, Bray-Curtis, unweighted UniFrac, and weighted UniFrac) principal coordinate analysis (PCoA) vectors, and specific genera with all-cause mortality in the linked oral microbiome and mortality National Health and Nutrition Examination Survey (NHANES) files, 2009–2012. The Cox proportional hazards models included adjustment for age, age splines, sex, self-reported race and ethnicity as categorized by NHANES, education, marital status, income-to-poverty ratio, body mass index category, detailed smoking history, alcohol consumption, periodontal disease/edentulism, prevalent diabetes or hypertension, and use of prescription medications for antibiotics, anti-lipidemic drugs, inhaled respiratory drugs, and drugs for treatment of gastroesophageal reflux disease. Alpha diversity, beta diversity, relative abundance, and centered log-ratio (CLR) transformed abundance associations were modeled as the per standard deviation change in the estimate. For the presence analysis, no genera were significantly associated with all-cause mortality at a Bonferroni-adjusted P value (P < .05/133 = .0004), but genera with a P < .01 are presented. All of the calculated genus-level presence associations are included in Supplementary Table 2. For the relative abundance analysis, 2 genera were statistically significant at the Bonferroni-adjusted P value (P < .05/103 = .0005), and genera with a P < .01 are presented. All of the calculated genus-level relative abundance associations are included in Supplementary Table 3. For the CLR-transformed abundance analysis, no genera were significantly associated with all-cause mortality at a Bonferroni-adjusted P value (P < .05/103 = .0005), but genera with a P < .01 are presented. All of the calculated genus-level CLR-transformed abundance associations are included in Supplementary Table 4. B, Forest plot of the estimated HRs with 95% CIs and P values for the associations of the combined genus-level presence and relative abundance with all-cause mortality in the oral microbiome and linked mortality NHANES files, 2009–2012. The reference value is the absence of the specific genus compared to the calculated tertiles of relative abundance for that genus. For the P value of the trend, only Bacteroides with a Ptrend of .0001 was statistically significant at the Bonferroni-adjusted P value (P < .05/83 = .0006), but genera with a P < .01 for the association with any tertile are presented. All of the calculated combined genus-level associations are included in Supplementary Table 5.

References

    1. Socransky SS, Haffajee AD, Cugini MA, Smith C, Kent RL Jr. Microbial complexes in subgingival plaque. J Clin Periodontol 1998; 25:134–44. - PubMed
    1. Costalonga M, Herzberg MC. The oral microbiome and the immunobiology of periodontal disease and caries. Immunol Lett 2014; 162(2 Pt A):22–38. - PMC - PubMed
    1. Maki KA, Ganesan SM, Meeks B, et al. The role of the oral microbiome in smoking-related cardiovascular risk: a review of the literature exploring mechanisms and pathways. J Transl Med 2022; 20:584. - PMC - PubMed
    1. Vogtmann E, Hua X, Yu G, et al. The oral microbiome and lung cancer risk: an analysis of 3 prospective cohort studies. J Natl Cancer Inst 2022; 114:1501–10. - PMC - PubMed
    1. Nieminen MT, Salaspuro M. Local acetaldehyde—an essential role in alcohol-related upper gastrointestinal tract carcinogenesis. Cancers 2018; 10:11. - PMC - PubMed

Substances