

Comparative performance of plasma pTau181/Aβ42, pTau217/Aβ42 ratios, and individual measurements in detecting brain amyloidosis
- PMID: 40513421
- PMCID: PMC12192541
- DOI: 10.1016/j.ebiom.2025.105805
Comparative performance of plasma pTau181/Aβ42, pTau217/Aβ42 ratios, and individual measurements in detecting brain amyloidosis
Abstract
Background: Early detection of brain amyloidosis (Aβ+) is crucial for diagnosing Alzheimer' disease (AD) and optimizing patient management, especially in light of emerging treatments. While plasma biomarkers are promising, their combined diagnostic value through specific ratios remains underexplored. In this study, we assess the diagnostic accuracy of plasma pTau isoform (pTau181 and pTau217) to Aβ42 ratios in detecting Aβ+ status.
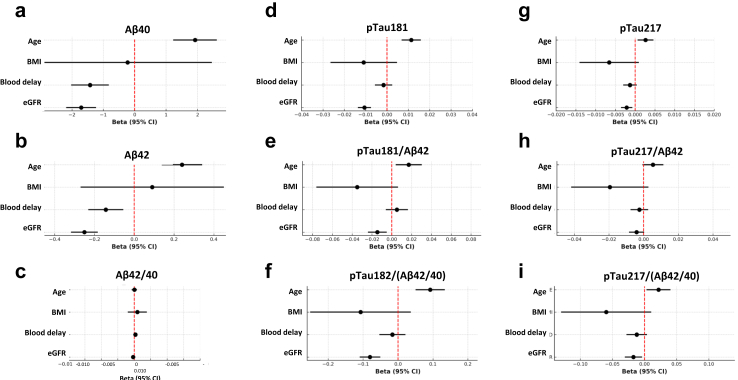
Methods: This study included 423 participants from the multicenter prospective ALZAN cohort, recruited for cognitive complaints. Aβ+ status was determined using cerebrospinal fluid (CSF) biomarkers. The confirmatory cohort comprises 1176 patient samples from the Alzheimer's Disease Neuroimaging Initiative (ADNI), with Aβ+ status determined by positron emission tomography (PET) imaging. Plasma biomarkers (pTau181, pTau217, Aβ40, Aβ42) were measured using immunoassays and mass spectrometry, with specific ratios calculated. In the ALZAN cohort, the impact of confounding factors such as age, renal function, ApoE 4 status, body mass index, and the delay between blood collection and processing was also evaluated to assess their influence on biomarker concentrations and diagnostic performance. The primary outcome was the diagnostic performance of plasma biomarkers and their ratios for detecting Aβ+ status. Secondary outcomes in the ALZAN cohort included the proportion of patients classified as low, intermediate, or high risk for Aβ+ using a two-cutoff approach.
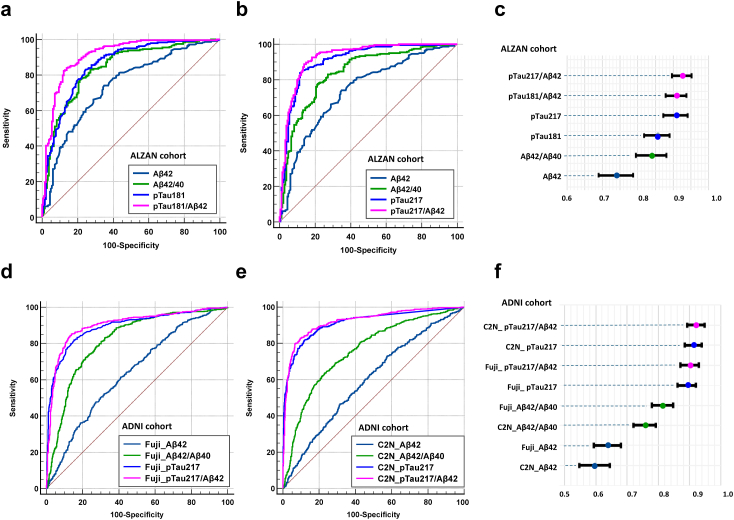
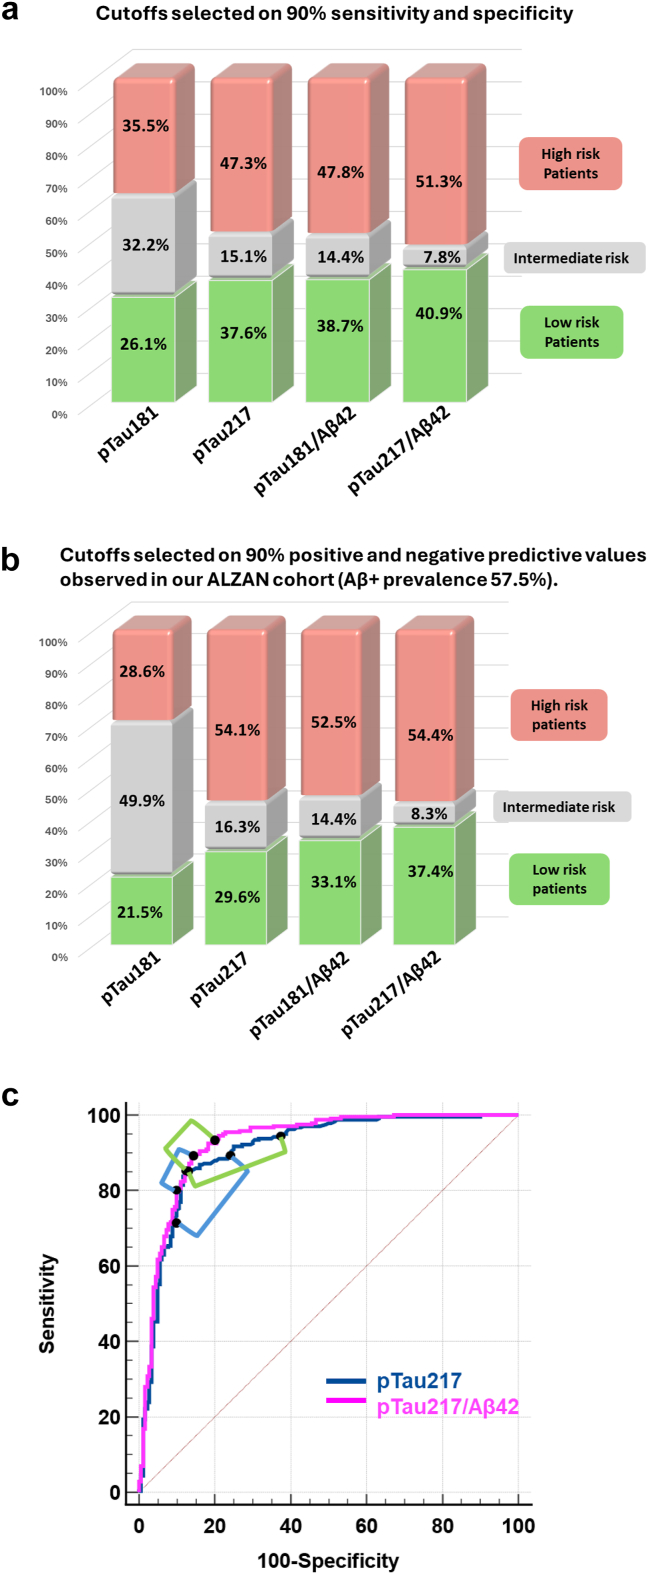
Findings: In ALZAN the pTau181/Aβ42 ratio matched the diagnostic performance of pTau217 (AUC of 0.911 (0.882-0.940) vs. 0.909 (0.879-0.939), P = 0.85). The pTau217/Aβ42 ratio demonstrated the highest diagnostic accuracy, with an AUC of 0.927 (0.900-0.954). Both ratios effectively mitigated confounding factors, such as variations in renal function, and were also efficient in identifying Aβ+ status in individuals with early cognitive decline. Diagnostic accuracy of ratios vs. individual measurement was confirmed in the ADNI cohort. In ALZAN, using two-cutoff workflows with pTau217/Aβ42 instead of pTau217 alone reduced the intermediate-risk zone from ∼16% to ∼8%, enhancing stratification for clinical decision-making.
Interpretation: The pTau217/Aβ42 ratio demonstrated improved diagnostic performance for detecting Aβ+ compared to individual biomarkers, potentially reducing diagnostic uncertainty. These findings suggest that plasma biomarker ratios could be useful; however, further validation in independent and diverse clinical settings is necessary before broader clinical implementation.
Funding: Fondation Research Alzheimer (ALZAN projet), AXA Mécénat Santé (INTERVAL Project), Fondation pour la Recherche Médicale (FRM, team Proteinopathies).
Keywords: Alzheimer; Biomarkers; Blood; Diagnosis.
Copyright © 2025 The Author(s). Published by Elsevier B.V. All rights reserved.
Conflict of interest statement
Declaration of interests Consultant or Advisory Role: S Lehmann, Advisory Board for Roche diagnostics, Biogen, Lilly, and Fujirabio. A Gabelle, Advisory Board for Biogen, Lilly, and Esai. No other conflict of interest.
Figures
Update of
-
Comparative performance of plasma pTau181/Aβ42, pTau217/Aβ42 ratios, and individual measurements in detecting brain amyloidosis.medRxiv [Preprint]. 2025 May 30:2024.12.07.24318640. doi: 10.1101/2024.12.07.24318640. medRxiv. 2025. Update in: EBioMedicine. 2025 Jul;117:105805. doi: 10.1016/j.ebiom.2025.105805. PMID: 39830279 Free PMC article. Updated. Preprint.
References
-
- Cognat E., Mouton Liger F., Troussiere A.C., et al. What is the clinical impact of cerebrospinal fluid biomarkers on final diagnosis and management in patients with mild cognitive impairment in clinical practice? Results from a nation-wide prospective survey in France. BMJ Open. 2019;9(5) - PMC - PubMed
Publication types
MeSH terms
Substances
Grants and funding
LinkOut - more resources
Full Text Sources
Medical
Miscellaneous
