. 2025 Aug 21;188(17):4790-4809.e22.
doi: 10.1016/j.cell.2025.05.022. Epub 2025 Jun 12.

Perturb-Multimodal: A platform for pooled genetic screens with imaging and sequencing in intact mammalian tissue

Affiliations

Perturb-Multimodal: A platform for pooled genetic screens with imaging and sequencing in intact mammalian tissue

Reuben A Saunders et al. Cell. .

Abstract

Metazoan life requires the coordinated activities of thousands of genes in spatially organized cell types. Understanding the basis of tissue function requires approaches to dissect the genetic control of diverse cellular and tissue phenotypes in vivo. Here, we present Perturb-Multimodal (Perturb-Multi), a paired imaging and sequencing method to construct large-scale, multimodal genotype-phenotype maps in tissues with pooled genetic perturbations. Using imaging, we identify perturbations in individual cells while simultaneously measuring their gene expression profiles and subcellular morphology. Using single-cell sequencing, we measure full transcriptomic responses to the same perturbations. We apply Perturb-Multi to study hundreds of genetic perturbations in the mouse liver. Our data suggest the genetic regulators and mechanisms underlying the dynamic control of hepatocyte zonation, the unfolded protein response, and steatosis. Perturb-Multi accelerates discoveries of the genetic basis of complex cell and tissue physiology and provides critical training data for emerging machine learning models of cellular function.

Keywords: RCA-MERFISH; hepatocyte stress response; in vivo pooled screening; lipid droplet accumulation; liver zonation; machine learning morphology; multimodal phenotyping; multiplexed RNA imaging; multiplexed protein imaging; scRNA-seq.


Conflict of interest statement

Declaration of interests R.A.S., W.E.A., J.S.W., and X.Z. are inventors on a patent applied for by Harvard University and Whitehead Institute related to imaging-based screening. R.A.S. and J.S.W. are inventors on patents applied for by the Regents of the University of California and Whitehead Institute related to CRISPRi/a screening and Perturb-seq. X.Z. is an inventor on patents applied for by Harvard University related to MERFISH and imaging-based screening. J.S.W. declares outside interest in 5AM Ventures, Amgen, nChroma, DEM Biosciences, KSQ Therapeutics, Maze Therapeutics, Tenaya Therapeutics, Tessera Therapeutics, Thermo Fisher, Xaira, and TRV. X.Z. is a co-founder and consultant of Vizgen, Inc.

Figures
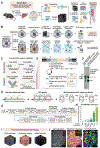
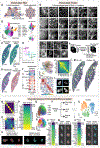
Figure 1:
Figure 1:. Perturb-Multimodal (Perturb-Multi): Pooled in vivo multimodal genetic screens through imaging and sequencing
A. Lentiviral delivery of genetic perturbations into liver tissue of living mouse, followed by tissue fixation and parallel sequencing and imaging measurements for integrated genotype-phenotype analysis. B. Dual readout methods: (Top) Perturb-Multi sequencing – dissociated cells from fixed tissues sections analyzed via hybridization-based Perturb-seq using 10x Flex platform; (Bottom) Perturb-Multi imaging – adjacent tissue sections labeled with oligo-conjugated antibodies and embedded in polyacrylamide with RNA and oligo-antibodies anchored, followed by clearing and detection with RCA-MERFISH. C. The four readout modalities: 10x Flex split probes for mRNA; custom split probes for sgRNAs; acrydite-oligo antibodies for multiplex immunofluorescence of proteins; RCA-MERFISH padlock probes for mRNA and perturbation barcodes. Each padlock probe contains multiple readout sequences (colored) encoding the target RNA (code reading “1” at the bits corresponding to the present readout sequences and “0” at the other bits) D. RCA-MERFISH workflow: RNAs are hybridized with padlock encoding probes, which are then ligated, rolling circle amplified, and detected by multiple rounds of hybridization with fluorescent readout probes complementary to the readout sequence. E. Synthesis of full-length, padlock encoding probes from array-synthesized oligo pools via PCR amplification, circularization, nicking, RCA, and Type IIS restriction digestion (see STAR Methods). F. Denaturing PAGE analysis comparing oligonucleotide standard (left) and RCA-MERFISH encoding probe library (right). G. The optimized sample-preparation protocol for Perturb-Multi imaging. H. Cumulative RCA-MERFISH performance improvements after protocol optimization including hybridization crowding-agent improvement, post-gel padlock probe hybridization and RCA, in-gel digestion, and decrosslinking refinement. I. Multimodal readout of RNA and protein through RCA-MERFISH (for mRNAs of 209 genes and 456 sgRNAs) and sequential rounds of immunofluorescence and FISH (for 14 proteins and 4 abundant RNAs), with automated fluidics and imaging. J. Multimodal measurement of gene expression (left, first three bits of 18-bit MERFISH mRNA imaging shown) and subcellular morphology (center; four of the 14 protein and 4 abundant targets shown), with machine learning-based segmentation of cells (right). See also Figures S1, S2 and Table S1.
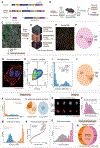
Figure 2:
Figure 2:. Heterogeneity in transcription and subcellular morphology by cell type and state
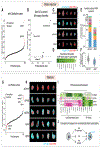
A. Liver lobule organization showing pericentral to periportal axis (BioRender). B. Integrated UMAP of RCA-MERFISH and Flex scRNA-seq data (Left: both; Top right: RCA-MERFISH; Bottom right: Flex) showing liver cell types, as determined by unsupervised clustering. C. Spatial distribution of periportal (left) and pericentral (right) scores in hepatocytes based on marker gene expression (STAR Methods). D. Periportal vs pericentral gene expression scores across hepatocyte subtypes. E. Spatial organization of hepatocyte subtypes (left) and non-hepatocyte cells (right). F. Spatial map of hepatocyte zone marker expression radially organized around a central vein. Yellow-boxed region from (E) with cell types (top) and imputed gene expression are separately scaled for each gene (bottom). PP: Periportal; PC: Pericentral. G. Morphology panel showing 4 abundant RNA species and 14 proteins (top) with zoomed details of a subset of targets (bottom). H. Deep learning autoencoder diagram reducing protein morphologies to 512-dimensional embeddings using the VQ-VAE model with auxiliary tasks of discriminating cell types, cell states, or conditions. I. UMAP of subcellular morphology image embeddings colored by channel (target protein and abundant RNA) identity. J. Similarity of subcellular morphology channel embedding quantified by Kullback-Leibler (KL) divergence. K. Correlation heatmap of high-signal features across image embeddings, ordered by hierarchical clustering to reveal nine feature classes (see Figure S5C). L. Cells displaying high weight scores from selected feature classes, including (ii) double nucleus, (iii) membrane enrichment, (iv) diffuse expression, and (viii) punctate patterns. M. Tissue-scale spatial organization of morphological embedding features. Left: Albumin mRNA feature 431; Right: Perilipin feature 203 N. Confusion matrix of hepatocyte subtype classification accuracy on held-out cells using MERFISH transcriptomic data of 209 genes. O. Confusion matrix of hepatocyte subtype classification accuracy on held-out cells using morphological feature embeddings from 14 proteins and 4 abundant RNAs. P. Heatmap of mutual information between hepatocyte subtypes Hep1 and Hep6 for individual morphological channels, quantified by quantified by KL divergence. Q. UMAP of anti-Perilipin morphological embeddings of single-cell images, colored by hepatocyte subtype. R. UMAP of anti-Perilipin morphological embeddings of single-cell images, colored by Leiden cluster. S. Sampling of hepatocytes from Perilipin embedding clusters 2 (Hep 6-enriched) and 6 (Hep 1-enriched). T. Diet experiment diagram. U. scRNA-seq UMAP from mice under ad lib, overnight fasting, or high-fat diet (HFD) conditions. V. Heatmap of mutual information between ad lib and fasted hepatocytes for individual morphological embedding features, quantified by quantified by KL divergence. W. Sampling of hepatocytes from anti-p-S6 RP embedding cluster 7 (from ad lib condition) and cluster 0 (from fasted condition). Cluster 7 is most enriched in the ad lib condition and cluster 0 is most enriched in the fasted condition. X. Same as (V), but for morphological channel embeddings between ad lib and HFD hepatocytes. Y. Same as (W) but for anti-perilipin embedding cluster 0 (from ad lib condition) and cluster 10 (from HFD condition). See also Figures S2-S6 and Tables S2-S4.
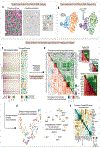
Figure 3:
Figure 3:. Large-scale, multimodal in vivo screening in CRISPR mosaic livers
A. Lentiviral CROP-seq vector for dual-mode mosaic screens with mU6-driven sgRNA expression and hepatocyte promoter driving expression of mTurquoise transcripts with perturbation-specific barcode in the 3’ UTR. B. CRISPR experiment workflow: LSL-Cas9 pups was injected with sgRNA library, followed by Cas9 activation in young adults via AAV8 TBG-CRE and perfusion-fixation of livers for RCA-MERFISH or Perturb-seq. C. Fluorescence micrograph of PFA-perfused, lentivirus- and AAV-transduced liver tissue showing Cas9-EGFP (green) and sgRNA-mTurquoise (purple) expression. D. Multimodal readout of 209 endogenous mRNAs and 456 perturbation barcodes via RCA-MERFISH and 14 proteins and 4 abundant RNAs via sequential imaging. E. Representative fluorescence micrograph showing the first three (of 21 total) bits of RCA-MERFISH perturbation imaging. F. Distribution of barcode calls per sgRNA-harboring cell: 85.3% with one barcode, 14.7% with two or more. Only single-barcode cells were analyzed. G. Fluorescence micrograph of a hepatocyte dissociated from fixed liver (Blue: DAPI ; Red: phalloidin). H. Flow cytometry of dissociated, PFA-perfused, lentivirus- and AAV-transduced liver tissue and mTurquoise+ and GFP+ cells are selected to enrich for cell containing sgRNA and active Cas9. I. Histogram of Alb_0 sgRNA counts per cell. J. Barcode calls per sgRNA-harboring cell in Perturb-seq: 85.7% with one barcode, 14.3% with two or more. K. Albumin mRNA expression histograms comparing cells receiving control vs. Albumin-targeting sgRNAs in Perturb-seq data. L. Fraction of sgRNAs causing significant Perturb-seq phenotypes: 109/406 targeting sgRNAs (27%) vs. 0/50 non-targeting sgRNAs (0%) by Holm-Šídák-corrected energy distance test (p<0.05). M. Histogram of Pearson correlations of pseudobulk Perturb-seq phenotypes between active sgRNA pairs targeting same gene, versus control sgRNA pairs. N. Knockouts ranked by energy distance between cells that received active targeting sgRNA vs cells that received control sgRNA. Energy distance is calculated using the top 20 PCs of Z-normalized Perturb-seq gene expression. O. Unbiased sampling of cells with control sgRNAs and sgRNAs targeting Albumin showing Albumin mRNA and polyA signals.. P. Histogram comparing Albumin mRNA signal between cells receiving control and Albumin-targeting sgRNAs, from the imaging data. Q. Histogram of Pearson correlations of pseudobulk imaging intensity phenotypes between active sgRNA pairs targeting same gene, versus control sgRNA pairs. R. Venn diagram of genes with significant knockout effects in imaging and sequencing phenotypes. Phenotype significance is measured by a Holm-Šídák-corrected energy distance permutation tests (p < 0.05). There is significant overlap in the two sets of genes (hypergeometric p < 10−13). See also Figure S7 and Tables S1-S6.
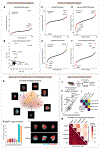
Figure 4:
Figure 4:. Multimodal in vivo screening with strong phenotypes
A. Spatial distribution of sgRNAs in the imaging dataset showing proliferation of infected cells. Cells are colored by cell type (left; as in Fig. 2B) or by sgRNA barcode identity (right and zoom). B. A UMAP generated from transcriptome profiles of cells with sgRNAs targeting Hnf4a and from a random sub-sampling of cells with control sgRNAs, colored by sgRNA identity (left) or by Apoa1 expression (right). C. Heat map representation of pseudobulk transcriptional changes (log2-fold change measured by sequencing, left) and staining protein and RNA level changes (Z-normalized changes measured by imaging, right) associated with each sgRNA, relative to cells with control sgRNAs. The colormaps are clipped for visual emphasis. D. Perturbation-perturbation correlation of RNA and protein changes associated with active sgRNAs (left) and zoom-in of the color boxed regions (right). Colors in the heatmap represent Pearson correlation of perturbed gene-level pseudobulk phenotypes measured by sequencing (below diagonal) or imaging (above diagonal). Genetic perturbations are ordered by hierarchical clustering of joint sequencing and imaging phenotype vectors. E. Minimal distortion embedding. Each dot represents an mRNA expressed in hepatocytes. mRNAs that are co-varying in expression across the perturbations are placed in proximity. F. Heat map of the correlation between the expression levels of indicated proteins/RNAs across perturbations, in the imaging dataset. Imaging channels are ordered by hierarchical clustering.
Figure 5:
Figure 5:. Identifying candidate genetic drivers of liver physiology
A. Perturbed genes ranked by their impact on a set of lipid and cholesterol biosynthesis genes (including Hmgcs1, Sqle, and Fasn) in the Perturb-seq experiment. The y-axis reflects mean log2-fold change of the score, relative to cells with control sgRNAs. Red reflects significance (Benjamini-Yekutieli corrected p < 0.05). B. Scatterplot showing the impact of perturbed genes on literature-defined sets of UPR genes (e.g., Hspa5 and Herpud1) and ISR genes (e.g., Atf4 and Ddit4). The x- and y-axes reflect mean log2-fold change of the scores, relative to cells with control sgRNAs. C. Perturbed genes ranked by their impact on anti-GAPDH intensity in the imaging experiment. The y-axis represents z-scored change relative to cells with non-targeting control sgRNAs (STAR Methods). Red reflects significance (Benjamini-Yekutieli corrected p < 0.05). D. Same as (C) but for Albumin mRNA FISH intensity. E. Same as (C) but for pre-rRNA FISH intensity. F. Same as (C) but for anti-Phospho S6 ribosomal protein intensity. G. Leiden-clustered UMAP representation of CathB embeddings from the imaging experiment. Every point represents an individual cell. Example cells from each cluster are shown as insets. H. Bar plot of enrichment in each of the clusters in Npc1 knockout cells, relative to cells with control sgRNA. I. A sampling of cells with control sgRNAs or Npc1 sgRNAs showing anti-CathB and polyA FISH signals. J. Schematic of diet + genetic Perturb-seq experiment comparing ad lib and fasted conditions. K. Scatterplot comparing the effect of each knockout (measured as energy distance between perturbed cells vs controls) between ad lib and fasted conditions. L. Heatmap representing the number of differentially expressed genes between the indicated conditions. differentially expressed genes are defined with Benjamini-Hochberg-corrected, Mann-Whitney p < 0.05, with equal cell numbers per comparison. M. Heatmap representing Pearson correlations of pseudobulk transcriptional responses between the indicated knockouts, in the indicated condition. The knockout-specific transcriptional responses are calculated relative to cells with control sgRNAs from the same mouse. The phenotypes of these knockouts are more correlated in fasted animals (mean Pearson’s R = 0.91, vs 0.19 in an ad libitum animal).
Figure 6:
Figure 6:. Multimodal investigation of the regulation of hepatocyte zonation
A. Kernel density estimate plots showing the distribution of zonation gene expression in cells with control sgRNAs, sgRNAs targeting Ctnnb1, and sgRNAs targeting APC. The single-cell zonation scores reflect the expression of periportal genes like Cyp2f2 and Hal and pericentral genes like Glul and Cyp2e1. Periportal and pericentral genes contribute positively and negatively to zonation score, respectively. B. Ranking of perturbed genes by their average impact on zonal gene expression score. C. Heatmap summarizing categories of genes whose perturbation has a large impact on zonated gene expression. Here, the periportal and pericentral expression scores are shown separately. D. Perturbation-perturbation correlation heatmap showing Pearson coefficients of pseudobulk transcriptional changes between indicated sgRNA perturbations. E. Schematic of data-driven zonal segmentation. The proportion of each hepatocyte subtype is calculated in 50-μm x 50-μm bins. The bins are then grouped into two zones based on the local cell-type distribution (STAR Methods) and the enrichment of cells with each perturbation in the two zones is quantified. F. Cell types from RCA-MERFISH (left) and resulting periportal/pericentral zonal segmentation (right). G. Barplot of the fraction of cells in periportal and pericentral zones (as defined above), for the indicated perturbations. The white line represents the fraction of cells with control sgRNAs.
Figure 7:
Figure 7:. Multimodal investigation of stress response and steatosis
A. Perturbed genes ranked by impact on anti-Calreticulin intensity, in the imaging experiment. The y-axis represents z-scored intensity change relative to cells with control sgRNAs (STAR Methods). Red reflects significance (Benjamini-Yekutieli corrected p < 0.05). B. Volcano plot showing intensity change and significance of the imaged protein and RNA channels between cells with sgRNA targeting Sel1l vs cells with control sgRNAs. Dashed line indicates corrected p = 0.05. C. An unbiased sampling of cells with control sgRNAs and Sel1l sgRNAs, showing the anti-calreticulin channel (top) and the Albumin mRNA FISH channel (bottom) alongside polyA FISH channel. D. Heatmaps showing log2-fold change in expression of UPR genes, in the sequencing experiment. E. Stacked bar plot representing the proportions of the ten most abundant secretory mRNAs in the pseudobulk transcriptome. F. Violin plot showing the fraction of each single-cell transcriptome that belongs to mRNAs encoding the ten abundant secretory mRNA, from cells with sgRNAs targeting Sel1l and control sgRNAs. G. Perturbed genes ranked by their impact on anti-Perilipin intensity, in the imaging experiment. The y-axis represents z-scored intensity change relative to cells with control sgRNAs. Red reflects significance (Benjamini-Yekutieli corrected p < 0.05). H. An unbiased sampling of cells with control sgRNAs and sgRNAs targeting the indicated gene, showing the anti-perilipin channel alongside polyA FISH. I. Hierarchically-ordered heatmap showing log2-fold change in the expression of lipid biosynthesis genes and ISR genes, for the indicated genetic perturbations. J. Diagram illustrating three convergent mechanisms that cause lipid droplet accumulation: (1) through activation of lipid biosynthesis in the case of Insig1 knockout; (2) through sequestration of free lipids into lipid droplets alongside ISR activation, in the case of Eif2s1 and Aars knockout; and (3) a distinct, Pten-associated mechanism that may include uptake in plasma, lipid synthesis increase, and/or sequestration of free lipids.

References

    1. Regev A, Teichmann SA, Lander ES, Amit I, Benoist C, Birney E, Bodenmiller B, Campbell P, Carninci P, Clatworthy M, et al. (2017). The Human Cell Atlas. Elife 6. 10.7554/eLife.27041. - DOI - PMC - PubMed
    1. Wilbrey-Clark A, Roberts K, and Teichmann SA (2020). Cell Atlas technologies and insights into tissue architecture. Biochem. J 477, 1427–1442. - PMC - PubMed
    1. Quake SR (2022). A decade of molecular cell atlases. Trends Genet. 38, 805–810. - PubMed
    1. Consortium HuBMAP (2019). The human body at cellular resolution: the NIH Human Biomolecular Atlas Program. Nature 574, 187–192. - PMC - PubMed
    1. Rao A, Barkley D, França GS, and Yanai I (2021). Exploring tissue architecture using spatial transcriptomics. Nature 596, 211–220. - PMC - PubMed

LinkOut - more resources