. 2025 Aug 5;37(8):1715-1731.e11.
doi: 10.1016/j.cmet.2025.05.010. Epub 2025 Jun 12.

The integrated stress response fine-tunes stem cell fate decisions upon serine deprivation and tissue injury

Affiliations

The integrated stress response fine-tunes stem cell fate decisions upon serine deprivation and tissue injury

Jesse S S Novak et al. Cell Metab. .

Abstract

Epidermal stem cells produce the skin's barrier that excludes pathogens and prevents dehydration. Hair follicle stem cells (HFSCs) are dedicated to bursts of hair regeneration, but upon injury, they can also reconstruct, and thereafter maintain, the overlying epidermis. How HFSCs balance these fate choices to restore physiologic function to damaged tissue remains poorly understood. Here, we uncover serine as an unconventional, non-essential amino acid that impacts this process. When dietary serine dips, endogenous biosynthesis in HFSCs fails to meet demands (and vice versa), slowing hair cycle entry. Serine deprivation also alters wound repair, further delaying hair regeneration while accelerating re-epithelialization kinetics. Mechanistically, we show that HFSCs sense each fitness challenge by triggering the integrated stress response, which acts as a rheostat of epidermal-HF identity. As stress levels rise, skin barrier restoration kinetics accelerate while hair growth is delayed. Our findings offer potential for dietary and pharmacological intervention to accelerate wound healing.

Keywords: dietary intervention; epidermal stem cells; fate selection; hair follicle stem cells; hair regrowth; integrated stress response; serine metabolism; tissue regeneration; tissue repair; wound healing.


Conflict of interest statement

Declaration of interests E.F. serves on the Editorial Boards of Cell, Cell Stem Cell, and Developmental Cell.

Figures
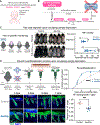
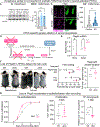
Figure 1.
Figure 1.. Dietary restriction of serine delays hair cycling and accelerates re-epithelialization during wound healing.
(A) Neu Laxova Syndrome, the inborn error of serine synthesis enzymes (PHGDH, PSAT1, and PSPH), exhibits severe epidermal phenotypes, such as hyperkeratosis, ichthyosis and alopecia. (B) Cells acquire serine via uptake using plasma membrane transporters and a glucose-derived biosynthesis pathway through the enzymes PHGDH, PSAT1 and PSPH. Red X denotes the point of intervention of the diet lacking serine/glycine. PPP: pentose phosphate pathway; SLC: solute carrier transporters. (C) (Left) Schematic and experimental design for hair regrowth challenge during dietary restriction of serine/glycine. (Middle) Representative images of mice fed a control or −ser/gly diet and analyzed when control skin displayed either skin pigment (top), typifying hair cycle initiation or full hair coat regeneration (bottom). (Right) Statistical analyses of the data for male mice, but similar results were obtained with female mice over 5 total litters. Each data point denotes one mouse. Significance was determined by two-way analysis of variance (ANOVA) with Šídák’s multiple comparisons test. (D) (Top left) Schematic of wound healing experiment, where epidermis and upper HF are denuded, leaving HFSC bulges to both re-epithelialize and regenerate hair. HFSCs were lineage-marked in telogen prior to feeding control or −ser/gly chow and wounding. (Top Right) Re-epithelialization time course analyzed by IMF. Mean±SEM are shown with n = 6–20 mice per group per time point (n = 11–15 mice for 1 dpw, n = 3 mice for 2 dpw, 17–20 mice for 3 dpw, n = 6 mice for 5 dpw, and n = 6–8 mice for 7 dpw). P-value reflects a sigmoidal model with Extra Sum of Squares F-test. (Bottom left) Representative IMF of re-epithelialization in across 1–7 dpw. Green denotes YFP-lineage traced cells from SOX9+ HFSCs. Scale bar = 50 μm. (Bottom right) Quantifications of HF downgrowth at 7 dpw. Each data point denotes one mouse. Skin epithelium is demarcated by white dotted lines. The scab-epidermal interface is denoted by yellow dashed lines. See Figure S1 for additional experiments. **** denotes a p-value of < 0.0001, *** denotes a p-value of < 0.001, * denotes a p-value of < 0.05.
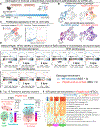
Figure 2.
Figure 2.. Stem cell-derived serine balances tissue regeneration during hair cycling and wound-repair.
(A-B) H3K27me3 levels in cultured HFSCs. (A) Immunoblot of H3K27me3 with total H3 as a loading control in three independently-derived mouse HFSC lines +/−ser/gly for 48 hours. (B) H3K27me3 levels by IMF of HFSC-1 cells in complete media (CM), half ser/gly media, or media lacking ser/gly. Significance was determined by one-way ANOVA with Dunnett’s multiple comparisons correction. (C) H3K27me3 levels by IMF in YFP+ hair follicles from wounds 3 dpw in mice fed control or −ser/gly diet. Scale bar = 50 μm. (D) Schematic of serine acquisition. Red X’s denote genetically blocking serine biosynthesis in Sox9-CreER-expressing HFSCs, forcing their acquisition of serine through exogenous uptake by SLC membrane transporters. Glu: glutamate; α-KG: α-ketoglutarate. (E) RT-qPCR of Phgdh mRNAs in skin stem cells isolated from WT and cKO mice. HFSC mRNAs are normalized to control HFSC samples, and EpSC mRNAs are normalized to control EpSC samples. Each data point denotes one mouse. Significance was determined by two-way ANOVA with Šídák’s multiple comparisons test. (F) (Left) Mice were shaved in telogen and then photographed at times when (left) WT skin turned black (anagen) and (right) WT mice had fully regenerated their hair coat. (Middle) Quantifications of postnatal day at each hair cycling milestone (skin pigmentation or full coat) in WT and cKO mice. Each data point denotes one mouse. Significance was determined by two-way ANOVA with Šídák’s multiple comparisons test. (Right) Duration of hair cycle regrowth phase. (G) (Left) Kinetics of epidermal re-epithelialization during wound-repair. Mean±SEM are shown with n = 3–28 mice per genotype per time point (n = 7–12 mice for 1 dpw, 6–12 mice for 2 dpw, 8–28 mice for 3 dpw, 3–4 mice for 5 dpw, and 4–5 mice for 7 dpw). P-value reflects a sigmoidal model with Extra Sum of Squares F-test. (Middle) Analysis of EdU incorporation. Each dot represents one mouse. (Right) HF downgrowth at 7 dpw. Significance was determined by Student’s unpaired t-test. Each dot represents data from one mouse and 222–279 HFs analyzed/mouse. *** denotes a p-value of < 0.001, ** denotes a p-value of < 0.01, * denotes a p-value of < 0.05, and ns denotes a p-value of > 0.05. See Figures S2 and S3 for additional data related to this figure.
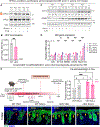
Figure 3.
Figure 3.. Temporal scRNA-seq suggests that if serine biosynthesis is abrogated during wound repair, HFSCs and their progeny shift their fates and upregulate the integrated stress response.
(A) (Left) Experimental design for scRNA-seq experiment with hashing. (B) (Top) Plots of single cells in UMAP space with marker genes identifying clusters enriched with either cKO or WT cells. Cool colors represent clusters enriched in WT cells. Warm colors represent clusters enriched in cKO cells. (Bottom) Cells in UMAP space depicting expression of stem cell markers Sox9 (HFSC) or Klf5 (EpSC). (C) (Left) Cells in UMAP space with clusters enriched for genes associated with proliferation are highlighted in the color of their genotype enrichment. C1 = migrating front cluster. (Right) Corrected counts of Krt15 (canonical hair follicle identity gene) vs. Top2a (prototypical cell cycle gene) plotted for both genotypes in Cluster 7, which is enriched for WT cells. R represents the correlation coefficient of a linear regression model. Threshold for significance of the linear model is p < 0.05. (D) GSEA of scRNA-seq data from WT or Phgdh-null (cKO) unwounded (homeostatic) HFSCs, and from 3 days dpw, and 5 dpw HFSCs and progeny. Each of our datasets was analyzed for expression of HFSC vs EpSC “identity” genes classified according to: (top left) HFSC super-enhancer (SE) genes specifically activated in HFSCs and not in EpSCs (Adam et al., 2015); (top right) genes expressed in HFSCs compared against other skin epithelial cells (Joost et al., 2016); and (bottom left): genes expressed in EpSCs compared against other skin epithelial cells (Haensel et al., 2020). Positive normalized enrichment scores (NES) indicates enrichment in cKO cells (orange lines) whereas negative NES scores denote enrichment in WT cells (blue lines). (E) Clustering of top 15 Reactome GSEA pathways at 3 dpw (left) and 5 dpw (right) highlighting prominent signatures of cell response to stress and translation in Phgdh-null HFSCs/progeny, even though mice received normal serine-containing chow. Each dot represents a Reactome pathway. Color shading on dots reflects the adjusted p-value. Size of dots correspond to number of genes in the corresponding pathway. (F) Hierarchically-clustered heatmap across all HFSC/HFSC progeny clusters showing gene set enrichment of transcripts within each cluster for ISR-related gene sets from GO database, Reactome Pathway Knowledgebase, and the literature. Color scales represent the normalized enrichment scores (NES) for each gene set compared to rank lists of cKO versus WT within each Leiden cluster. For GSEA tests where the adjusted p-value was greater than 0.25, the NES was set to zero. AA: amino acid; GCN2: General Control Nonderepressible 2; PERK: Protein Kinase R-like ER Kinase; UPR: Unfolded Protein Response; HRI: Heme-regulated eIF2α Kinase; ISR: integrated stress response. See Figure S4 for additional data related to this figure.
Figure 4.
Figure 4.. Pharmacological ISR activation accelerates re-epithelialization during wound healing in WT mice, erasing the healing advantage in cKO mice.
(A-B) Immunoblots of proteins isolated from WT- and Phgdh-null HFSCs cultured in vitro in the presence or absence of serum for 24 hours. Antibodies used are against (A) phosphorylated eIF2ɑ (S51), total eIF2ɑ and (B) ATF4 and ASNS. Anti-vinculin (VCL) was used as loading control. The last well contains WT cells treated with tunicamycin for 4 hr at 250 ng/mL as a positive control for ISR activation. Numbers above wells denote semi-quantitative densitometry of bands normalized to WT control. Each well represents pooled lysates from three wells per condition (A) or (B) a technical replicate for the individual condition. Immunoblots are representative of n > 2 independent experiments. (C) O-propargyl puromycin incorporation (MFI) for nascent protein synthesis in vitro after a 1-hr pulse normalized to FSC-A MFI to account for cell size. Dashed line ending at CHX represents average OPP incorporation in presence of cycloheximide. Significance was determined by Student’s unpaired t-test. (D) mRNA quantification by RT-qPCR of ATF4 target genes in WT and Phgdh-null HFSCs cultured in vitro. Each data point represents a technical replicate, and different genes were assayed during different experiments. Tunicamycin treatment was used a positive control. Significance was determined by two-way ANOVA with Tukey’s multiple comparisons test. (E) (Top left) Experimental design to assess the effects of pharmacological elevation of the ISR during wounding. (Top right) Quantifications of re-epithelialization. Each data point denotes one mouse. Significance was determined by two-way ANOVA with Šídák’s multiple comparisons test. VEH = vehicle; SALU salubrinal. (Bottom) Representative IMF images. Red arrows note a lack of re-epithelialization in WT VEH compared to all other conditions (yellow arrows). Skin epithelium is demarcated by white dotted lines. The scab-neo-epidermal interface is traced in yellow dashed lines. Scale bar = 50 μm. **** denotes a p-value of < 0.0001, *** denotes a p-value of < 0.001, ** denotes a p-value of < 0.01, * denotes a p-value of < 0.05, and ns denotes a p-value of > 0.05. See Figures S5 and S6 for additional experiments related to this figure.
Figure 5.
Figure 5.. GCN2 directly senses serine levels to dictate cell fate during wound re-epithelialization.
(A-B) Western blot of GCN2-Pi, GCN2, ATF4, and PHGDH, with VCL as a loading control in Phgdh cKO cells supplemented with downstream metabolites of serine. Phgdh WT cells were used a control for baseline ISR activation. (A) Cells were supplemented with 1 mM formate, 1 mM uridine, 50 μM hypoxanthine (HPX), and either 1 mM esterified glutathione (eGSH) or 500 nM Trolox. (B) Cells were supplemented with increasing levels of serine and glycine, from 0 to 7.5 mM. Complete media concentration is 0.3 mM, which is indicated by the black arrow. Numbers above rows reflect semi-quantitative densitometry normalized to Phgdh WT lysate in complete media. Note: Both blots from (A) and (B) are from the same gel, so the WT Phgdh lane is the same. (C) (Left) Circulating serum metabolite abundance of serine, glycine, and glutamine by GC-MS of from second telogen WT C57B6J mice after one week of either control (0.4%) or high-serine diet (2.0%). Significance was determined by two-way ANOVA with Šídák’s multiple comparisons test. Each data point represents cells isolated from one mouse. (Middle) Experimental design to assess the effects of excess serine availability on wound re-epithelialization. (Right) Quantifications of re-epithelialization. Each data point denotes one mouse. Significance was determined by Student’s unpaired t-test. (D) (Left) Representative IMF images of GCN2iB experiment. (Right) Quantifications of re-epithelialization. Each data point denotes one mouse. Significance was determined by Student’s unpaired t-test. Red arrows note a lack of re-epithelialization in GCN2iB-treated mice compared to VEH-treated mice (yellow arrows). Skin epithelium is demarcated by white dotted lines. The scab-neo-epidermal interface is traced in yellow dashed lines. Scale bar = 50 μm. ** denotes a p-value of < 0.01, * denotes a p-value of < 0.05, and ns denotes a p-value of > 0.05. Please see Figure S5 for more details.
Figure 6.
Figure 6.. The migrating epithelial front is a natural site for the integrated stress response in normal wound repair in mouse models and patients.
(A) Row-normalized heatmap of Z-scores of Gene Set Variation Analysis (GSVA) values for ISR-related gene sets in WT mice at t=0, 3 and 5 dpw. AA: amino acid; GCN2: General Control Nonderepressible 2; PERK: Protein Kinase R-like ER Kinase; UPR: Unfolded Protein Response; HRI: Heme-regulated eIF2α Kinase; ISR: integrated stress response; ATF4_dep_tun_sens: ATF4-dependent, tunicamycin sensitive genes from Torrence et al. (2021); CHOP_targets_ChIPseq, ATF4_targets_ChIPseq, and ATF4_CHOP_common_ChIPseq reflect targets of ATF4, CHOP, or both by ChIP-seq from Wang et al. (2013); ISR_lung_epithelium from Han et al. (2023). (B) Violin plots for corrected counts of integrated stress response (ISR) genes over each time point and genotype. P-values were adjusted to control the false discovery rate using the Benjamini-Hochberg procedure (threshold q < 0.01, log2FC > 0.1). (C) (Left two panels) Each cluster was assigned a signature score from Han et al. (2023) and HALLMARK Unfolded Protein Response (UPR). (Right two panels) Single cells in UMAP space highlighting the identity of the cluster with highest enrichment (C4) and the marker gene (Il24) that exemplifies the signature of the cluster (migrating front) along with a prototypical ISR signature (HALLMARK UPR). (D) (Left) Z-scores from GSVA analysis of ISR signatures from GO, Reactome, and published ChIP-seq and RNA-seq datasets in bulk-RNA sequencing of human unwounded and wounded skin from Liu et al. (2022). See Panel A for gene signature abbreviations. (Right) Z-scores from GSVA analysis of our Migrating Front gene signature in bulk-RNA sequencing of human unwounded and wounded skin from Liu et al. (2022). Dpw: days post-wounding. See Figure S6 for more details.

References

    1. Fuchs E, and Blau HM (2020). Tissue Stem Cells: Architects of Their Niches. Cell Stem Cell 27, 532–556. 10.1016/J.STEM.2020.09.011. - DOI - PMC - PubMed
    1. Martínez-Reyes I, and Chandel NS (2020). Mitochondrial TCA cycle metabolites control physiology and disease. Preprint at Nature Research, 10.1038/s41467-019-13668-3 - DOI - PMC - PubMed
    1. Shapira SN, and Christofk HR (2020). Metabolic Regulation of Tissue Stem Cells. Preprint at Elsevier Ltd, 10.1016/j.tcb.2020.04.004 - DOI - PMC - PubMed
    1. Novak JSS, Baksh SC, and Fuchs E (2021). Dietary interventions as regulators of stem cell behavior in homeostasis and disease. Genes Dev 35, 199–211. 10.1101/gad.346973.120. - DOI - PMC - PubMed
    1. Jackson BT, and Finley LWS (2024). Metabolic regulation of the hallmarks of stem cell biology. Cell Stem Cell 31, 161–180. 10.1016/J.STEM.2024.01.003. - DOI - PMC - PubMed