Thermoregulation and dehydration in children and youth exercising in extreme heat compared with adults
- PMID: 40514198
- PMCID: PMC12320596
- DOI: 10.1136/bjsports-2025-109832
Thermoregulation and dehydration in children and youth exercising in extreme heat compared with adults
Abstract
Objective: To compare hyperthermia and physiological dehydration risk during exercise heat stress between children of different ages and adults and evaluate an existing adult sweat rate calculator in children.
Methods: 68 fit and recreationally active children aged 10-16 years (31 girls), and 24 adults aged 18-40 years (11 females) completed three separate 45 min treadmill walking/running trials at different intensities on different days at 30°C, 40% relative humidity (RH) (WARM) or 40°C, 30% RH (HOT). Exposures were randomised to elicit intensities scaled to (1) fitness, (2) mass and (3) surface area. Core (gastrointestinal (Tgi)) temperature was measured continuously and dehydration determined using body mass changes.
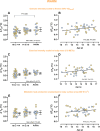
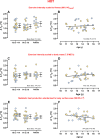
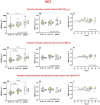
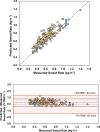
Results: Except for 60% V̇O2peak in WARM, in which adults exhibited a greater Tgi rise compared with 10-13 years, there was no effect of age on Tgi during exercise (p≥0.176). Physiological rates of dehydration were not affected by age in WARM (p≥0.08) or HOT (p≥0.08). Mean predicted sweat rate error was +0.08 kg/hour (95% CIs: -0.10, +0.25) across WARM and HOT, and 80.5% of variability in sweating was explained by the adult sweat rate calculator.
Conclusions: Using the most comprehensive paediatric exercise heat stress dataset from a single study to date, we show that children aged 10-16 years are at a similar risk of hyperthermia and dehydration as adults during exercise up to 40°C. This supports recent changes to paediatric sport heat policies that were based on limited data. Practitioners can potentially reduce behavioural dehydration risks from inadequate fluid consumption using an existing adult sweat rate calculator for children.
Keywords: Children; Dehydration; Exercise; Sweat.
© Author(s) (or their employer(s)) 2025. Re-use permitted under CC BY-NC. No commercial re-use. See rights and permissions. Published by BMJ Group.
Conflict of interest statement
Competing interests: None declared.
Figures


Similar articles
-
Physical exercise training interventions for children and young adults during and after treatment for childhood cancer.Cochrane Database Syst Rev. 2013 Apr 30;(4):CD008796. doi: 10.1002/14651858.CD008796.pub2. Cochrane Database Syst Rev. 2013. Update in: Cochrane Database Syst Rev. 2016 Mar 31;3:CD008796. doi: 10.1002/14651858.CD008796.pub3. PMID: 23633361 Updated.
-
Prescription of Controlled Substances: Benefits and Risks.2025 Jul 6. In: StatPearls [Internet]. Treasure Island (FL): StatPearls Publishing; 2025 Jan–. 2025 Jul 6. In: StatPearls [Internet]. Treasure Island (FL): StatPearls Publishing; 2025 Jan–. PMID: 30726003 Free Books & Documents.
-
Physical exercise training interventions for children and young adults during and after treatment for childhood cancer.Cochrane Database Syst Rev. 2016 Mar 31;3(3):CD008796. doi: 10.1002/14651858.CD008796.pub3. Cochrane Database Syst Rev. 2016. PMID: 27030386 Free PMC article.
-
Exercise versus airway clearance techniques for people with cystic fibrosis.Cochrane Database Syst Rev. 2022 Jun 22;6(6):CD013285. doi: 10.1002/14651858.CD013285.pub2. Cochrane Database Syst Rev. 2022. PMID: 35731672 Free PMC article.
-
Exercise for intermittent claudication.Cochrane Database Syst Rev. 2017 Dec 26;12(12):CD000990. doi: 10.1002/14651858.CD000990.pub4. Cochrane Database Syst Rev. 2017. PMID: 29278423 Free PMC article.
References
-
- UNICEF Protecting children from heat stress: a technical note. 2023. https://www.unicef.org/media/139926/file/Protecting-children-from-heat-s... Available.
-
- Bar-Or O. Climate and the exercising child - a review. Int J Sports Med. 1980;01:53–65. doi: 10.1055/s-2008-1034631. - DOI
Publication types
MeSH terms
LinkOut - more resources
Full Text Sources
Medical
