. 2025 Jul 16;45(29):e2331242025.
doi: 10.1523/JNEUROSCI.2331-24.2025.

Increased Neuronal Expression of the Early Endosomal Adaptor APPL1 Replicates Alzheimer's Disease-Related Endosomal and Synaptic Dysfunction with Cholinergic Neurodegeneration

Affiliations

Increased Neuronal Expression of the Early Endosomal Adaptor APPL1 Replicates Alzheimer's Disease-Related Endosomal and Synaptic Dysfunction with Cholinergic Neurodegeneration

Ying Jiang et al. J Neurosci. .

Abstract

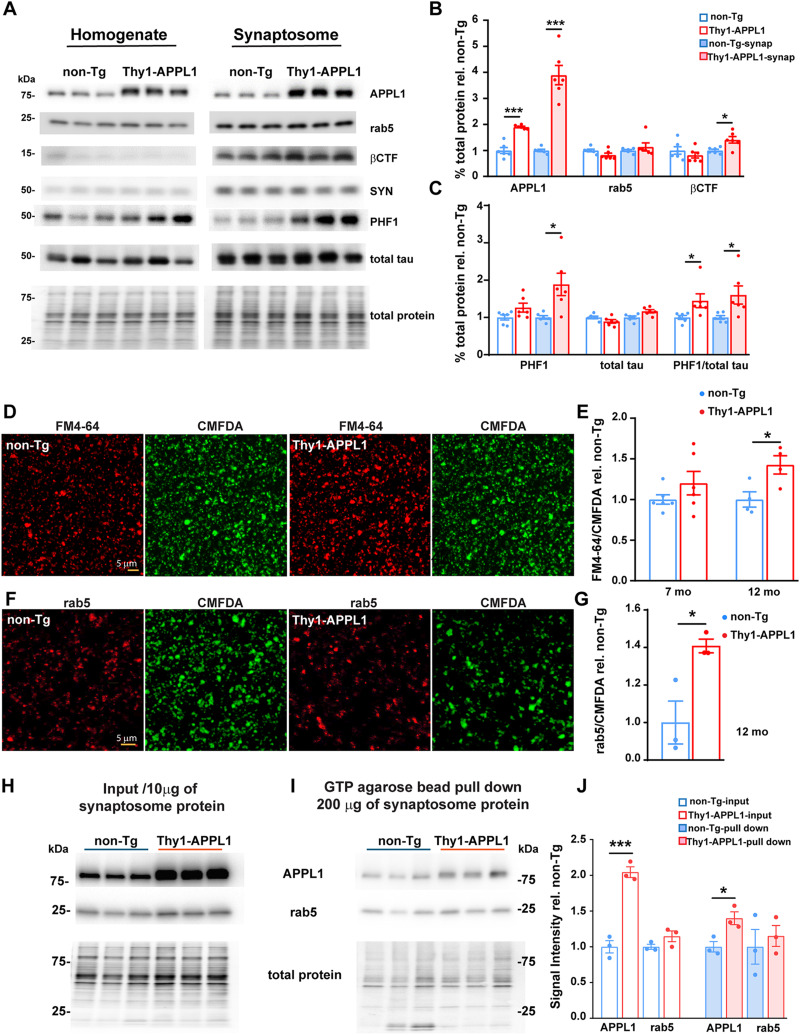
Endosomal system dysfunction within neurons is a prominent early feature of Alzheimer's disease (AD) pathology. Multiple AD risk factors are regulators of endocytosis and known to cause hyperactivity of the early endosome small GTPase rab5, resulting in neuronal endosomal pathway disruption and cholinergic neurodegeneration. Adaptor protein containing Pleckstrin homology domain, Phosphotyrosine binding domain, Leucine zipper motif (APPL1), an important rab5 effector protein and signaling molecule has been shown in vitro to interface between endosomal and neuronal dysfunction through a rab5-activating interaction with the BACE1-generated C-terminal fragment of amyloid precursor protein (APP-βCTF), a pathogenic APP fragment generated within endosomal compartments. To understand the contribution of APPL1 to AD-related endosomal dysfunction in vivo, we generated a transgenic mouse model overexpressing human APPL1 within neurons (Thy1-APPL1). Strongly supporting the important endosomal regulatory roles of APPL1 and their relevance to AD etiology, Thy1-APPL1 mice (both sexes) develop enlarged neuronal early endosomes and increased synaptic endocytosis due to increased rab5 activation. We demonstrated pathophysiological consequences of APPL1 overexpression, including functional changes in hippocampal long-term potentiation (LTP) and long-term depression (LTD), degeneration of large projection cholinergic neurons of the basal forebrain, and impaired hippocampal-dependent memory. Our evidence shows that neuronal APPL1 elevation modeling its functional increase in the AD brain induces a cascade of AD-related pathological effects within neurons, including early endosome anomalies, synaptic dysfunction, and selective neurodegeneration. Our in vivo model highlights the contributions of APPL1 to the pathobiology and neuronal consequences of early endosomal pathway disruption and its potential value as a therapeutic target.

Keywords: AD; APP-βCTF; APPL1; ChAT+ neuron; endosome; rab5.


Conflict of interest statement

The authors declare no competing financial interests.

Figures

Figure 1.
Figure 1.
APPL1 transgene expression in the brain. A, Representative Western blot comparing APPL1 expression in various brain regions (CTX, cortex; HIP, hippocampus; CBL, cerebellum; RB, remaining brain) from 4- to 5-month-old nontransgenic littermate (non-Tg) and Thy1-APPL1 transgenic (Thy1-APPL1) mice. Overexpressed flag-tagged APPL1 proteins were detected in all brain regions in Thy1-APPL1 mice. B, Representative brain section immunolabeling with an anti-APPL1 antibody at low magnification (scale bar, 1 mm) demonstrates the APPL1 overexpression patterns in various brain regions of Thy1-APPL1 mice. C, Representative immunofluorescent images at low (40×) and high (120×) magnification show APPL1 (green) and NeuN (red) with DAPI (blue) staining in cortex layer V (scale bar, 10 µm; yellow arrows indicate neurons, white arrowheads identify non-neuronal cells; genotype as indicated). D, Western blots probed with anti-APPL1 and anti-rab5 antibodies of both non-Tg and Thy1-APPL1 brain homogenate prepared from mice of the indicated ages. E, Western blot analysis quantification showing increased APPL1 in the brain homogenates of Thy1-APPL1 mice compared with non-Tg mice at the indicated ages. **p < 0.01, ***p < 0.001, two-tailed, unpaired t test. Data shown as mean ± SEM.
Figure 2.
Figure 2.
Early endosome alterations in Thy1-APPL1 mice. A, Representative immunofluorescent images of active, GTP-bound rab5 (rab5-GTP; red) and APPL1 (green) in neurons (layer V, prefrontal cortex) of non-Tg and Thy1-APPL1 mice at 12–13 months of age. Shown are images at lower magnification (40×, merged). The white arrow indicating the neuron shown at higher magnification for individual and merged immunofluorescent signal. Scale bar, 10 µm. B, Quantification of the average number, size, and total area of Rab5-GTP immunolabeled endosomes per cortical neuron in non-Tg versus Thy1-APPL1 mice at the indicated ages. Representative electron microscopy images containing dendritic profiles in layer V of prefrontal cortex (C) and hippocampus (D) regions and (E) quantification of average size and circumference of endosomes in both cortex and hippocampi showing the enlargement in Thy1-APPL1 compared with non-Tg mice aged at 12–13 months (red asterisk indicating endosome; 7 mice each genotype for cortex and 4 mice each genotype for hippocampi were used for quantification. Scale bar, 500 nm). Sixty images/mouse were quantified in E; for cortex sections, a total of 2,635 endosomes from 14 mice were counted, averaging 188 endosomes per mouse; for hippocampal sections, a total of 1,594 endosomes were counted from 8 mice, with an average of 199 endosomes per mouse. F, Representative immunoelectron microscopy images containing dendritic profiles in layer V of prefrontal cortex labeled with rabbit anti-rab5 and mouse anti-APPL1 followed by gold-conjugated secondary anti-rabbit (6 nm, green arrow) and anti-mouse (10 nm, red arrow) in non-Tg and Thy1-APPL1 mice. Scale bar, 100 nm. G, Percentage of rab5/APPL1 double-positive endosomes versus total rab5-positive endosomes in the dendritic region of the cortex and hippocampus significantly increased in Thy1-APPL1 mice (3 mice per genotype. 35–40 images/mouse were used for counting; for cortex sections, a total of 130 endosomes were counted from 6 mice, with an average of 22 endosomes per mouse; for hippocampal sections, a total of 121 endosomes were counted from 6 mice, with an average of 20 endosomes per mouse). *p < 0.05, **p < 0.01, ***p < 0.001, two-tailed, unpaired t test. Data is shown as mean ± SEM.
Figure 3.
Figure 3.
Western blot analysis and synaptic vesicle endocytosis (SVE) revealed the abnormalities in hippocampal synaptosomes of Thy1-APPL1 mice. A, Representative Western blots from one of the two experiments showing various protein markers in hippocampal homogenates and hippocampal synaptosome preparations from non-Tg and Thy1-APPL1 mice (n = 6 each genotype). Quantitation of these Western blots (B, C) shows significantly higher levels of APPL1, βCTF, PHF1, and the ratio of PHF1/total tau in synaptosomes of Thy1-APPL1 compared with non-Tg mice at 12–13 months of age. D, Representative fluorescent images of internalized FM4-64 (red) with corresponding CMFDA labeling of total synaptosomes (green) using hippocampal synaptosomes prepared from non-Tg and Thy1-APPL1 mice at 12–13 months of age. E, The ratio of internalized FM4-64 to CMDFA was significantly increased in hippocampal synaptosomes of Thy1-APPL1 mice at 12–13 months, but not in 7 months of age, indicating elevated endocytosis in older Thy1-APPL1 mice compared with non-Tg. F, Representative images of CMFDA (green) labeling followed by anti-rab5 (red) immunolabeling and (G) quantification of the intensity of rab5 to CMFDA showing an increase in rab5 immunosignal per CMFDA-labeled synaptosome in hippocampal synaptosomes of Thy1-APPL1 mice at 12–13 months of age. Scale bar, 5 µm, *p < 0.05, ***p < 0.001, two-tailed, unpaired t test. Data shown as mean ± SEM. Western blots of hippocampal synaptosome (10 µg of synaptosome protein, input; H), and GTP-agarose pull-down of hippocampal synaptosome (200 µg of synaptosome protein) from non-Tg and Thy1-APPL1 mice (I) probed with anti-APPL1 and anti-rab5 antibodies, total protein stained by Revert 700 Total Protein Stain are also shown at the bottom of H and I. The APPL1 and rab5 band density in both input and pull-down against total protein in relation with non-Tg are presented in J, *p < 0.05, ***p < 0.001, one-way ANOVA. Data is shown as mean ± SEM.
Figure 4.
Figure 4.
Loss of cholinergic neurons in the medial septal nucleus (MSN) of Thy1-APPL1 mice and accumulation of endosomes in Thy1-APPL1 mice. A, Representative light microscopy images comparing ChAT-immunoreactive neurons in the MSN of non-Tg and Thy1-APPL1 mice at 12–13 months of age. Scale bar, 100 µm. B, Plots of number of ChAT+ neurons counted stereologically versus age of mice showing significant difference between the slopes of non-Tg and Thy1-APPL1 mice (F(1,55) = 6.01, p = 0.017, linear regression). C, Number of ChAT-immunoreactive neurons in the MSN of non-Tg and Thy1-APPL1 mice at the indicated ages (n = 42 for non-Tg and 41 for Thy1-APPL1 mice; quantitative stereology as described in Materials and Methods). D, Representative images of ChAT-immunoreactive neurons at higher magnification in 18-month-old non-Tg and Thy1-APPL1 mice (arrowheads indicate dystrophic neurites). Scale bar, 5 µm. E, Representative z-stacked series fluorescence images of ChAT- (red) and rab5-immunoreactive (green) neuron in the MSN of a non-Tg and Thy1-APPL1 mice at 18 months of age (arrowheads indicating a dystrophic neurite). Scale bar, 5 µm. *p < 0.05, ***p < 0.001, two-tailed, unpaired t test. Data presented as mean ± SEM. F, Representative EM images of 18-month-old mice showing an accumulation of endosomes in cortical dendrites of Thy1-APPL1 mice compared with non-Tg mice (scale bar, 500 nm). G, Quantification of average size and circumference of endosomes in the cortical dendritic area of non-Tg and Thy1-APPL1 mice at the age of 18 months (n = 4 for non-Tg and n = 5 for Thy1-APPL1 mice; 60 cortical section images/mouse, a total of 982 endosomes were counted in Thy1-APPL1mice, with an average of 196 endosomes/mouse counted. 630 total endosomes were counted from non-Tg mice, with averaging 157 endosomes/mouse), *p < 0.05, two-tailed, unpaired t test. Data shown as mean ± SEM.
Figure 5.
Figure 5.
Age-related impairments of synaptic plasticity and hippocampal-dependent memory deficit in Thy1-APPL1 mice. A–C, Non-Tg and Thy1-APPL1 mice at 7–9 months of age (n = 5 for both genotype), input/output relationship plots (A), LTP by theta-burst stimulation (TBS) in the Schaffer collateral synapses (CA3-CA1) of hippocampal slices (B), and averages of fEPSP slopes at 1, 40, and 80 min following tetanic stimulation (C) of the hippocampal slices showing no differences between non-Tg and Thy1-APPL1 mice. D–F, Non-Tg and Thy1-APPL1 mice at 12–13 months of age (n = 5 for both genotype), input/output relationship plots (D), LTP induced by TBS in the Schaffer collateral synapses (CA3-CA1) in hippocampal slices (E), and averages of fEPSP slopes at 1, 40, and 80 min (F) showing significant reduction in Thy1-APPL1 mice (F(1,236) = 6.696, p = 0.0103 for the slope, linear regression). G–I, Non-Tg and Thy1-APPL1 mice at 12–13 months of age (n = 5 for both genotypes), input/output relationship plots (G), LTD induced by low-frequency stimulation (LFS; H) in hippocampal slices of Thy1-APPL1 (F(1,127) = 14.83, p = 0.0002 for the intercepts, linear regression), and averages of fEPSP slopes at 50 min following LFS induction (I) in the hippocampal slices did not show expected reduction in Thy1-APPL1 mice. J, Recognition index at 3 h after familiarization indicated the memory deficit in Thy1-APPL1 mice at 12–13 months of age (t(18) = 2.187, p = 0.042). *p < 0.05, ***p < 0.001, two-tailed, unpaired t test. Data is shown as mean ± SEM.
Figure 6.
Figure 6.
NGF retrograde signaling and involvement of APPL1 in healthy neurons and after a rise in neuronal APPL1 levels related to Alzheimer's disease in APPL1 overexpressing neurons. Schematic diagram depicts (A) the endocytosis of APP, NGF, and its receptor TrkA into a rab5 early endosome. TrkB mediation of BDNF signaling by APPL1 (data not shown) is considered to follow a similar sequence. B, Normal NGF signaling is facilitated by recruitment of APPL1, a direct TrkA ligand and adaptor for other signaling molecules mediating retrograde transport of a maturing endosome carrying the NGF signal to the nucleus to activate a neurotrophic transcriptional program supporting functioning of ChAT neurons and other NGF targets. In AD (not shown; see main text), abnormally elevated APP-βCTF levels arising via multiple possible mechanisms raise levels of the activated form of rab5 (rab5-GTP) on endosomal membranes, in part by recruiting more APPL1 to the endosome via the phosphotyrosine binding (PTB) domain of APPL1 (Kim et al., 2016). APPL1's greater affinity for rab5-GTP prolongs association of this activated form on the endosome, thus promoting a pathogenic rab5 hyperactivation leading to increased endocytosis, early endosomal fusion, and endosome enlargement, as depicted in C. C, Moderately elevating APPL1 selectively in neurons of Thy1-APPL1 mice phenocopies mouse models of APP-βCTF elevation or rab5 overexpression with respect to rab5 hyperactivation, abnormal endosome enlargement, stasis of endosome transport, synaptic plasticity deficits, and basal forebrain cholinergic neurodegeneration. These pathological effects, as observed in AD brain, also reflect impaired NGF/TrkA signaling and decreased expression of genes for neuronal survival, growth and differentiation (Niewiadomska et al., 2011; Xu et al., 2018). Further information is provided in the text and in more detail in reviews (Nixon, 2017; Nixon and Rubinsztein, 2024).

Update of

References

    1. Ahmad F, Liu P (2020) Synaptosome as a tool in Alzheimer's disease research. Brain Res 1746:147009. 10.1016/j.brainres.2020.147009 - DOI - PubMed
    1. Alam JJ, Nixon RA (2023) Drug development targeting degeneration of the basal forebrain cholinergic system: its time has come. Mol Neurodegener 18:74. 10.1186/s13024-023-00663-y - DOI - PMC - PubMed
    1. Avchalumov Y, Mandyam CD (2021) Plasticity in the hippocampus, neurogenesis and drugs of abuse. Brain Sci 11:404. 10.3390/brainsci11030404 - DOI - PMC - PubMed
    1. Bellucci A, Longhena F, Spillantini MG (2022) The role of Rab proteins in Parkinson’s disease synaptopathy. Biomedicines 10:1941. 10.3390/biomedicines10081941 - DOI - PMC - PubMed
    1. Bohdanowicz M, Balkin DM, De Camilli P, Grinstein S (2012) Recruitment of OCRL and Inpp5B to phagosomes by Rab5 and APPL1 depletes phosphoinositides and attenuates Akt signaling. Mol Biol Cell 23:176–187. 10.1091/mbc.e11-06-0489 - DOI - PMC - PubMed

MeSH terms

Substances

LinkOut - more resources