. 2025 Jun 13;11(1):108.
doi: 10.1038/s41522-025-00751-5.

Extracellular DNA filaments associated with surface polysaccharide II give Clostridioides difficile biofilm matrix a network-like structure

Affiliations

Extracellular DNA filaments associated with surface polysaccharide II give Clostridioides difficile biofilm matrix a network-like structure

Tania Kamwouo et al. NPJ Biofilms Microbiomes. .

Abstract

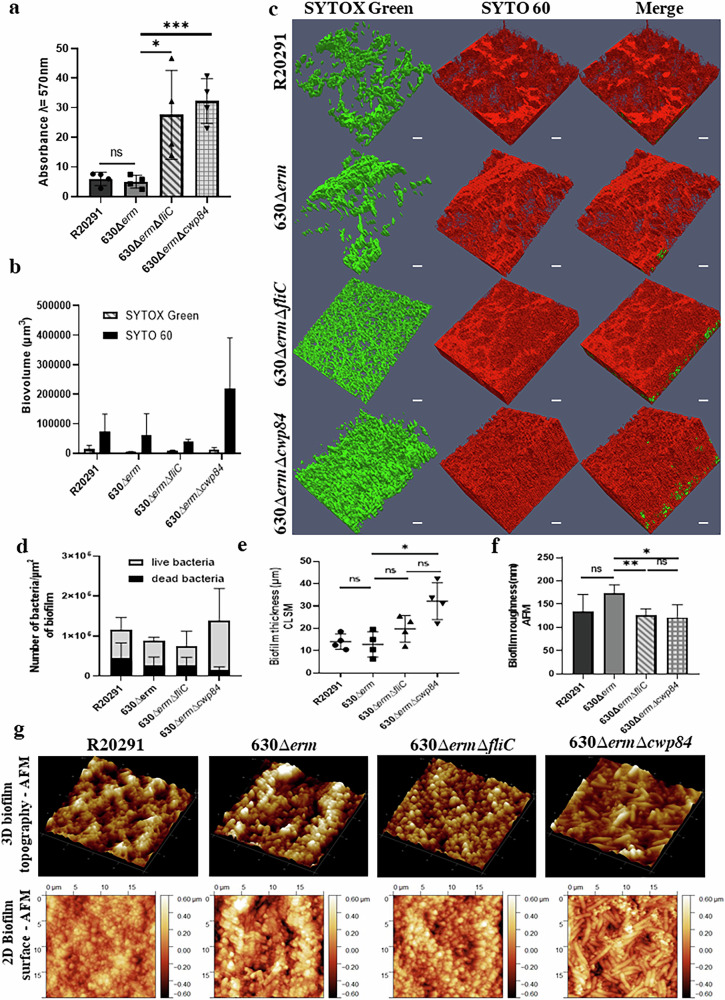
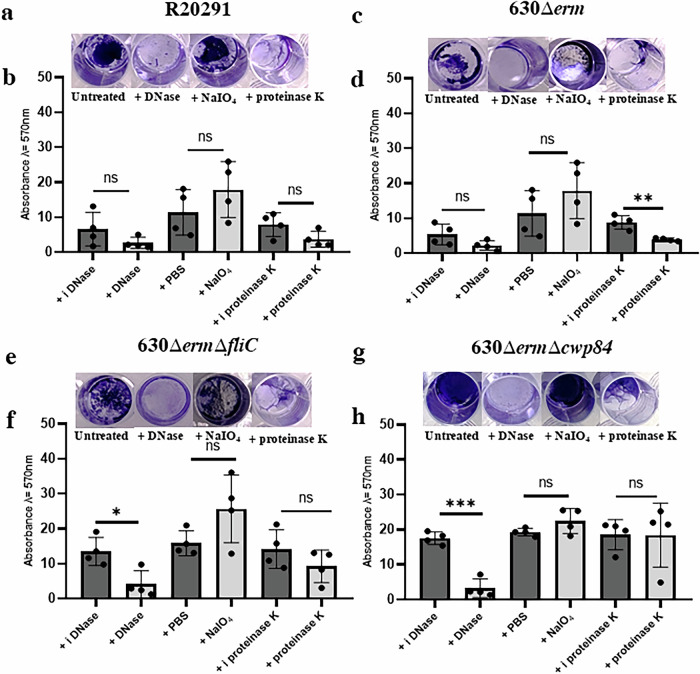
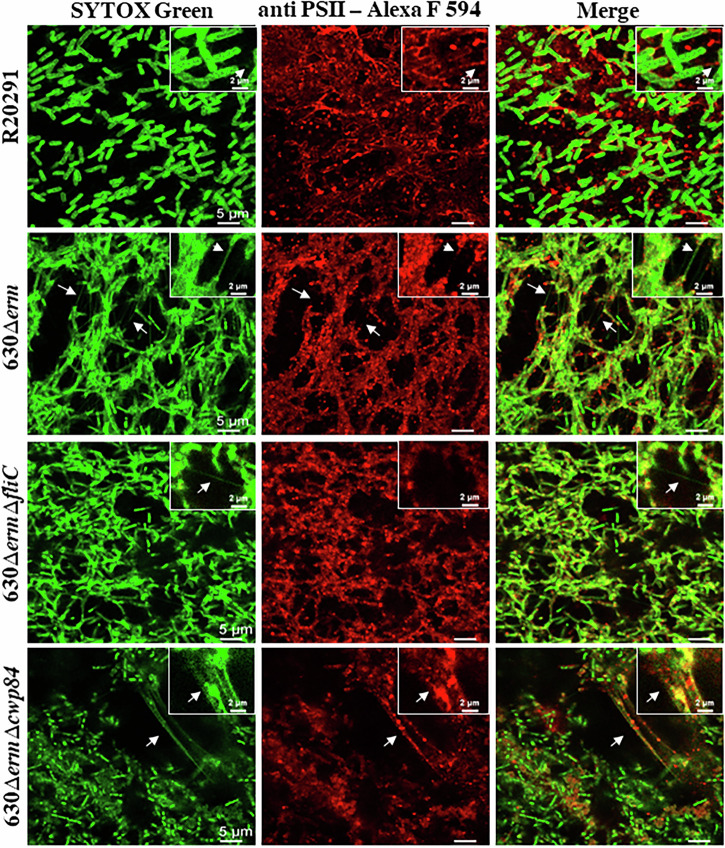
Clostridioides difficile is an anaerobic, spore-forming, Gram-positive bacterium, and a leading cause of healthcare-associated intestinal infections. Recurrences occur frequently, most of them being relapses. Apart from spores, C. difficile biofilm is hypothesized as a reservoir for relapses. Thus, increased knowledge on in vitro biofilm formation and characteristics is required. We finely characterized the matrix components in 4 C. difficile strains. Confocal microscopy revealed for the first time the presence of eDNA filaments connecting bacteria, with a spider's web-like organization. Biofilm disruption with DNase I suggests that eDNA, even in low abundance, plays a key role in the biofilm scaffold, maintaining biofilm cohesion by connecting bacteria. Observation of strong overlapping staining, particularly in the highest biofilm-producing strain tested between eDNA and polysaccharide II or lipoprotein CD1687, suggests that interactions between these components may enhance biofilm cohesion. Whereas autolysis does not appear to be a major way of matrix component release under our conditions, eDNA was sometimes associated with lipidic round shapes that can evoke vesicle structures. Together, these results suggest that the bacterial aggregation and structuring of the C. difficile biofilm involve several components of the matrix, including eDNA, interacting with each other to build the scaffold of biofilm.


Conflict of interest statement

Competing interests: The authors declare no competing interests.

Figures

Fig. 1
Fig. 1. Architecture of 48 h-old C. difficile biofilms from strains C. difficile R20291, 630Δerm, 630ΔermΔfliC, 630ΔermΔcwp84.
a Biomass of biofilms: after 48 h of growth, biofilms were stained with crystal violet, and biomass was quantified by measuring absorbance (λ = 570 nm). Biofilms were stained with DNA Live/Dead SYTO 60 and SYTOX Green and imaged with a confocal microscope CLSM (an inverted TCS SP8 AOBS CLSM). BiofilmQ software was used to measure the b biofilm biovolume and c 3D biofilm reconstruction shape was designated and represented with Paraview software (representative image from three biological replicates imaging with three fields observed per replicate). Scale bars correspond to 30 µm. The calculation of biovolume in Fig. 1b and the estimation of live and dead bacteria in Fig. 1d were carried out using data from three independent biological replicates. d Estimation of number of live and dead bacteria in the biofilm. e Biofilm thickness. Biofilms grown on silicon wafers were also imaged with AFM (atomic force microscopy). f Biofilm roughness Ra, corresponding to the arithmetic average roughness calculated using the quantitative height AFM images. g 3D and 2D biofilm topography are 20 × 20 µm2 AFM height images showing the topography of C. difficile biofilm surfaces. In the AFM images, the darker areas correspond to the deeper ones, and the paler areas to the higher ones. For 3D images, the z-scale is between −500 and 500 nm. For 2D images, the height scale is given right to the image (z-scale is between −0.6 and 0.6 µm). The xy axis scale is indicated at the top and the left of 2D images and the proportions are preserved for 3D views. Statistical analysis was performed with the parametric t-test (ns = non-significant, * = p ≤ 0.05, ** = p ≤ 0.01, *** = p ≤ 0.001), and normality was assessed with the Shapiro-Wilk test. Each graph plot represents the means and standard deviations of at least three independent biological replicates.
Fig. 2
Fig. 2. Proportions of matrix components in biofilms from 4 C. difficile strains.
Proportions of a polysaccharides, b proteins, and c eDNA. Their amounts (in µg) were measured in matrices extracted from biofilm and related to the total amount of the three quantified components (eDNA + polysaccharides + proteins) to determine their proportions in matrix components. Each graph plot represents the means and standard deviations of 4 independent biological replicates; statistical normality was determined with the Shapiro-Wilk test and the Mann-Whitney test was used to perform statistical analysis test (ns, non-significant).
Fig. 3
Fig. 3. Effect of DNase I, NaIO4, and proteinase K on preformed C. difficile biofilm for 48 h.
b, d, f, h. Biofilms were stained with crystal violet after 48 h of growth and 1 h of treatment for the different conditions. Control conditions were biofilms treated with PBS for NaIO4 condition (used for its preparation), and enzymes inactivated for 2 h at 100°C, “i DNAse” and “i proteinase K” for DNase and proteinase K treatment, respectively. Each graph represents the means and standard deviations of 4 biological replicates; statistical analysis was performed strain by strain with the parametric t-test for three strains with values that have statistical normality determined with the Shapiro-Wilk test (R20291, 630Δerm, 630ΔermΔfliC), and the Mann-Whitney test was used for the strain 630ΔermΔcwp84 for which normality was rejected through the Shapiro-Wilk test (ns, non-significant, *p ≤ 0.05, **p ≤ 0,01). A representative image was chosen to illustrate each treatment on strains (a, c, e, and g).
Fig. 4
Fig. 4. eDNA forms filaments connecting bacteria in C. difficile biofilm.
48 h-old biofilms were stained with SYTOX Green. Each condition was tested in 4 biological replicates, with the acquisition of three areas per biofilm well. A representative image was selected for each condition. Scale bars in smaller inserts represent 2 µm, while scale bars for larger panels represent 5 µm.
Fig. 5
Fig. 5. Localization of PSII and eDNA in C. difficile biofilm matrix.
48 h-old biofilms were labeled with SYTOX Green and anti-PSII (detected using a secondary Ab coupled to AF594, in red). PSII was found along eDNA filaments for the strains 630ΔermΔcwp84, 630Δerm, and R20291, and, for this latter strain, a strong PSII labeling was also observed independently of eDNA filaments. Each condition was tested in 4 biological replicates, with an acquisition of three areas per well at each replicate. A representative image was chosen for each condition. Scale bars in smaller inserts represent 2 µm, while scale bars for larger panels represent 5 µm.
Fig. 6
Fig. 6. CD1687 lipoprotein is present in the C. difficile biofilm matrix.
48 h-old biofilms were labeled with SYTOX Green and anti-CD1687 antibody (detected using a secondary Ab coupled to AF594, in red). CD1687 lipoprotein staining overlaps with some eDNA filaments, in vesicle-like structures and forms clusters in the biofilm matrix of the 630ΔermΔcwp84 mutant strain. Scale bars in smaller inserts represent 2 µm, while scale bars for larger panels represent 5 µm. Four biological replicates were performed, and a representative image was chosen for each condition. Images were deconvolved with Huygens Professional v.20.04 (Scientific Volume Imaging).
Fig. 7
Fig. 7. Lipid-based extracellular round shapes can be found in the C. difficile biofilm matrix.
48 h-old biofilms were labeled with SYTOX Green and FM 4-64 (lipids, in red). Stars (*) represent extracellular vesicle-like shapes, and arrows (↑) represent eDNA filaments. Four biological replicates were made and a representative image was chosen for each condition. Scale bars in smaller inserts represent 2 µm, while scale bars for larger panels represent 5 µm.
Fig. 8
Fig. 8. Autolysis capacity of C. difficile strains and characterization of ∆cwp19 mutants.
a Autolysis kinetics were measured for 3 h every 10 minutes by measuring absorbance (Absorbance λ = 600 nm). b Quantification of biofilms formed at 48 h. Biofilms are stained with crystal violet after 48 h of growth and after being treated or not 1 h with DNase I or inactivated DNase I (iDNase) at 25 µM; UT (untreated condition). c Proportions of eDNA, polysaccharides, and proteins in the biofilm matrix related to the total amount of three matrix components. Each graph plot represents the means and standard deviations of three independent biological replicates; statistical normality was determined with the Shapiro-Wilk test, and the Mann-Whitney test was used to perform statistical analysis test (ns, non-significant).

Similar articles

References

    1. Le Monnier, A. et al. Hospital cost of Clostridium difficile infection including the contribution of recurrences in French acute-care hospitals. J. Hosp. Infect.91, 117–122 (2015). - PubMed
    1. Sandhu, B. K. & McBride, S. M. Clostridioides difficile. Trends Microbiol.26, 1049–1050 (2018). - PMC - PubMed
    1. Reigadas, E., Vázquez-Cuesta, S. & Bouza, E. Economic burden of Clostridioides difficile Infection in European Countries. Adv. Exp. Med. Biol.1435, 1–12 (2024). - PubMed
    1. Heise, J., Witt, P., Maneck, C., Wichmann-Schauer, H. & Maurischat, S. Prevalence and phylogenetic relationship of Clostridioides difficile strains in fresh poultry meat samples processed in different cutting plants. Int J. Food Microbiol.339, 109032 (2021). - PubMed
    1. Kordus, S. L., Thomas, A. K. & Lacy, D. B. Clostridioides difficile toxins: mechanisms of action and antitoxin therapeutics. Nat. Rev. Microbiol.20, 285–298 (2022). - PMC - PubMed

MeSH terms

LinkOut - more resources