. 2025 Jun 13;10(1):39.
doi: 10.1038/s41539-025-00329-y.

Preschool musicality is associated with school-age communication abilities through genes related to rhythmicity

Affiliations

Preschool musicality is associated with school-age communication abilities through genes related to rhythmicity

Lucía de Hoyos et al. NPJ Sci Learn. .

Abstract

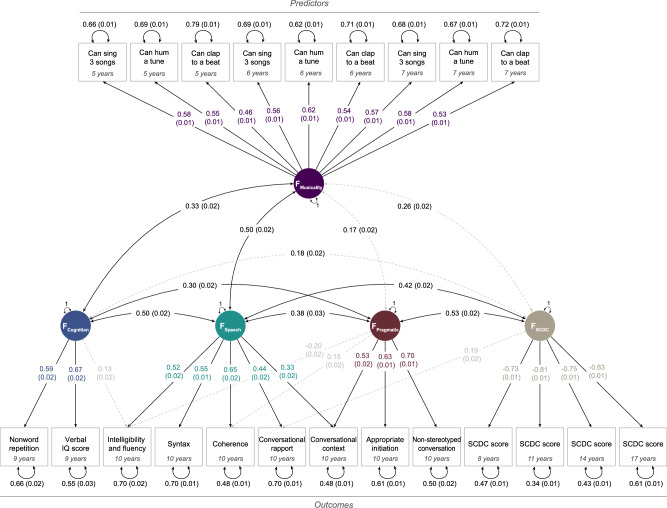
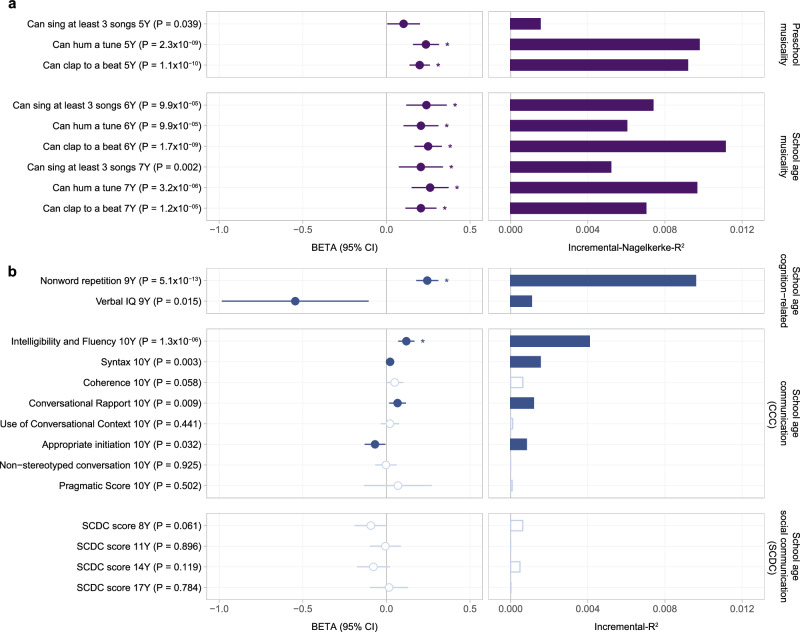
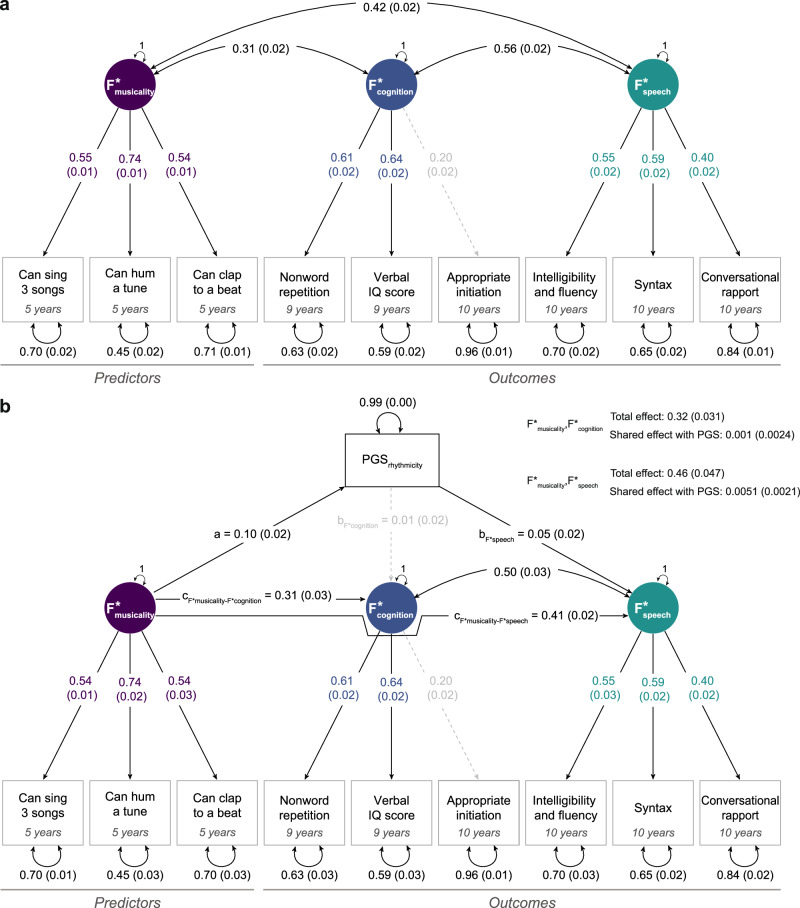
Early-life abilities involved in perceiving, producing and engaging with music (musicality) may shape later (social) communication and language abilities. Here, we investigate phenotypic and genetic relationships linking musicality and communication abilities by studying information from preschool and school-aged children of the Avon Longitudinal Study of Parents and Children (N = 4169-6737 per measure, age 0.5-17 years). Using structural models, we identified relationships between latent musicality and speech- and cognition-related variables (r > 0.30). Consistently, polygenic scores for rhythmicity in adulthood (PGSrhythmicity) showed associations with preschool and school-age musicality (incremental-Nagelkerke-R2 = 0.006-0.011, p < 0.0025), as well as school-age communication and cognition-related measures (incremental-R2 = 0.04-1%, p < 0.0025). Studying the directionality of genetic effects using a mediation framework, we found evidence supporting a developmental pathway linking preschool musicality to school-age speech-/syntax-related abilities, as captured by PGSrhythmicity (shared effect: β = 0.0051(SE = 0.0021), p = 0.015). Associations were found conditional on general cognition and genetically unrelated to educational attainment, suggesting robust developmental links between early musicality and later speech-related communication performance.


Conflict of interest statement

Competing interests: The authors declare no competing interests.

Figures

Fig. 1
Fig. 1. Structural model.
Confirmatory factor analysis (CFA) model across preschool and school-age musicality predictor measures and school-age (social) communication and cognition-related outcome phenotypes (N = 5773). A detailed description of the measures can be found in Table 1. Standardised estimates are shown with their corresponding SEs, unstandardised estimates are available in Supplementary Table 4. Observed measures are represented by squares and latent variables by circles. Coloured single-headed arrows define meaningful factor loadings ( | λ | >0.30) and grey otherwise. Double-headed black arrows represent the variance of each phenotype and factor correlations. The CFA model provided an acceptable model fit (CFI = 0.90, TLI = 0.88, RMSEA = 0.049, SRMR = 0.034). Note that infant musicality measures (nursery rhymes) explained less than 1% of the variance in the outcome measures (Supplementary Fig. 1) and were not included in further analyses. SCDC Social Communication Difficulties Checklist, CCC Children’s Communication Checklist.
Fig. 2
Fig. 2. Polygenic scoring analyses with polygenic load for rhythmicity.
a Association of PGSrhythmicity with preschool and school-age musicality predictor measures using proportional odds logistic regression (N = 5483–6028). Beta estimates are shown as circles with their corresponding 95% confidence intervals. The goodness of fit is shown as incremental Nagelkerke-R2. Note that infant musicality measures (nursery rhymes) explained less than 1% of the variance in the outcome measures (Supplementary Fig. 1) and were not included in further analyses. b Association of PGSrhythmicity with school-age communication, social communication and verbal-cognition outcome measures using linear regression (N = 4169–5645). Beta estimates are shown as circles with their corresponding 95% confidence intervals. The variance explained for each phenotype is shown as bars and expressed as incremental R2. Filled circles/bars and empty circles/bars represent phenotypes with an association with PGSrhythmicity of p < 0.05 and p ≥ 0.05, respectively. If a phenotype passed the multiple-testing threshold of 0.0025, this was indicated with an asterisk. A table with estimates is shown in Supplementary Table 3. SCDC, Social Communication Difficulties Checklist; CCC, Children’s Communication Checklist.
Fig. 3
Fig. 3. Developmental pathways of preschool musicality with school-age cognition-related skills and school-age communication skills.
a Confirmatory factor analysis (CFA) model of preschool musicality predictor measures and school-age communication and cognition-related outcome measures sharing variation with PGSrhythmicity (N = 5873). Standardised estimates are shown with their corresponding SEs, unstandardised estimates are shown in Supplementary Table 5. Observed measures are represented by squares and latent variables by circles. Coloured single-headed arrows define factor loadings with p ≤ 0.05. Double-headed black arrows represent the variance of each phenotype and factor correlations. The CFA model provided an optimal model fit (CFI = 0.95, TLI = 0.93, RMSEA = 0.042, SRMR = 0.028). b Genetic characterisation of phenotypic relationships between F*musicality on F*cognition and F*speech explained by shared links with PGSrhythmicity (N = 5873). The shared genetic effect between F*musicality and F*speech, as captured by PGSrhythmicity, is estimated as a*bF3 and the total effect between F*musicality and F*speech as a*bF*speech + cF*musicality-F*speech. The shared genetic effect between F*musicality and F*cognition, as captured by PGSrhythmicity, is estimated as a* bF*cognition and the total effect as a* bF*cognition + cF*musicality-F*cognition. Standardised estimates are shown with their corresponding SEs, unstandardised estimates and shared effects with PGSrhythmicity are shown in Supplementary Table 6. Observed measures are represented by squares and latent variables by circles. Coloured single-headed arrows define factor loadings with p ≤ 0.05. Double-headed black arrows represent the variance of each phenotype and factor correlations. Grey dotted and black solid single-headed arrows define relationships between factors and with PGSrhythmicity with p > 0.05 and p ≤ 0.05, respectively.

Update of

Similar articles

References

    1. Levinson, S. C. Interactional Foundations of Language: The Interaction Engine Hypothesis. In Human Language (ed. Hagoort, P.) 189–200. 10.7551/mitpress/10841.003.0018 (The MIT Press, 2019).
    1. Social Communication. American Speech-Language-Hearing Associationhttps://www.asha.org/public/speech/development/social-communication/.
    1. Dall, M., Fellinger, J. & Holzinger, D. The link between social communication and mental health from childhood to young adulthood: A systematic review. Front. Psychiatry13 (2022). - PMC - PubMed
    1. ASHA Practice Policy. American Speech-Language-Hearing Associationhttps://www.asha.org/policy.
    1. Bishop, D. V. M. Genes, cognition, and communication. Ann. N. Y. Acad. Sci.1156, 1–18 (2009). - PMC - PubMed

LinkOut - more resources