. 2025 Jun 13;16(1):5290.
doi: 10.1038/s41467-025-59805-z.

Resolving spatial subclonal genomic heterogeneity of loss of heterozygosity and extrachromosomal DNA in gliomas

Affiliations

Resolving spatial subclonal genomic heterogeneity of loss of heterozygosity and extrachromosomal DNA in gliomas

Michelle G Webb et al. Nat Commun. .

Abstract

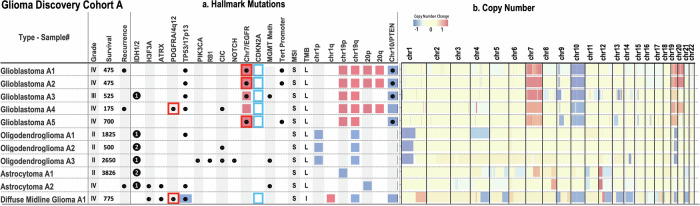
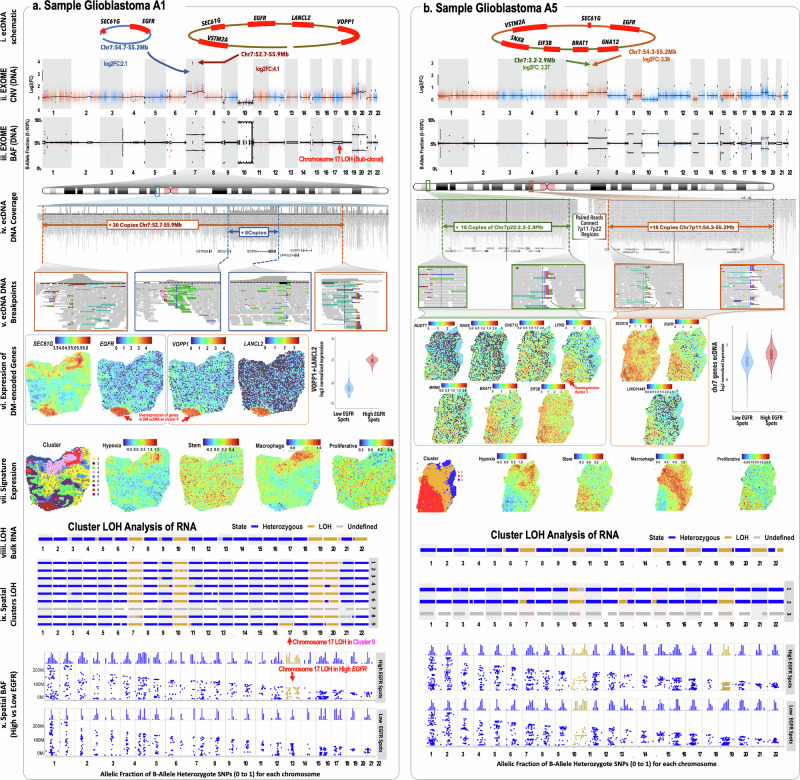
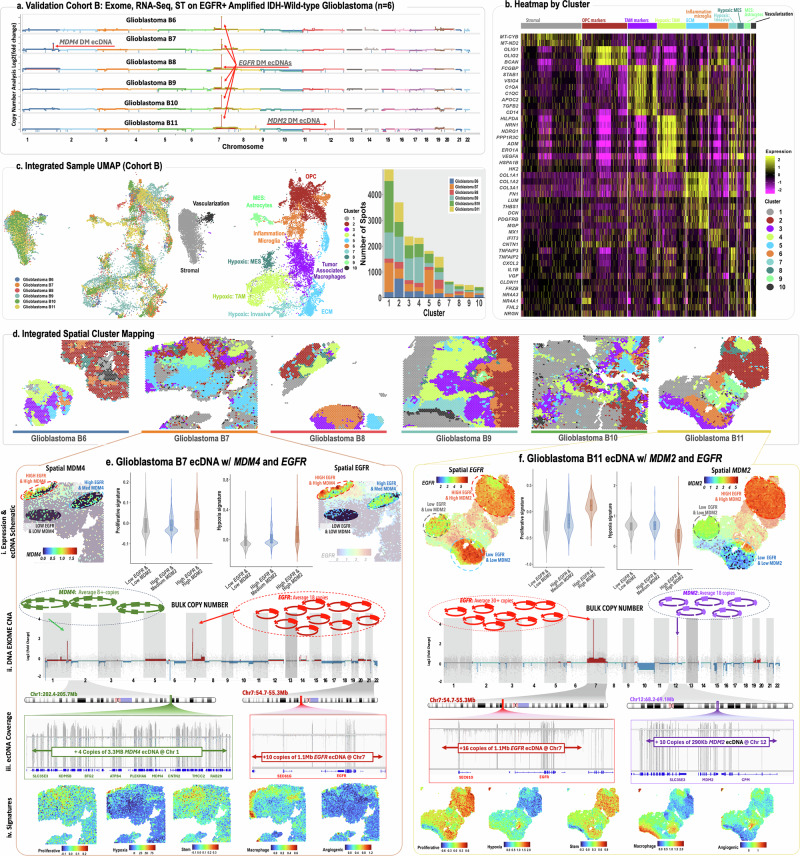
Mapping the spatial organization of DNA-level somatic copy number changes in tumors can provide insight to understanding higher-level molecular and cellular processes that drive pathogenesis. We describe an integrated framework of spatial transcriptomics, tumor/normal DNA sequencing, and bulk RNA sequencing to identify shared and distinct characteristics of an initial cohort of eleven gliomas of varied pathology and a replication cohort of six high-grade glioblastomas. We identify focally amplified extrachromosomal DNA (ecDNA) in four of the eleven initial gliomas, with subclonal tumor heterogeneity in two EGFR-amplified grade IV glioblastomas. In a TP53-mutated glioblastoma, we detect a subclone with EGFR amplification on ecDNA coupled to chromosome 17 loss of heterozygosity. To validate subclonal somatic aneuploidy and copy number alterations associated with ecDNA double minutes, we examine the replication cohort, identifying MDM2/MDM4 ecDNA subclones in two glioblastomas. The spatial heterogeneity of EGFR and p53 inactivation underscores the role of ecDNA in enabling rapid oncogene amplification and enhancing tumor adaptability under selective pressure.


Conflict of interest statement

Competing interests: The authors declare no competing interests.

Figures

Fig. 1
Fig. 1. Overview of somatic alterations in the discovery glioma cohort A.
The initial dataset of 11 fresh frozen glioma tumors were analyzed with spatial transcriptomics, bulk tumor and normal exome sequencing, and bulk RNA sequencing. The sample set included five glioblastomas, three oligodendrogliomas, two astrocytomas, and a diffuse midline glioma. Glioblastoma A1 was a recurrence of Glioblastoma A2. a Hallmark mutations identified through exome sequencing and somatic variant calling analysis are displayed with their mutation status. Point mutations are shown as •, IDH1 mutations are 1, IDH2 are 2. Microsatellite instability and tumor mutation burden are listed as MSI and TMB, respectively. b Copy number changes were identified through exome copy number variation analysis. Blue and red shading indicated chromosome level gains/losses, and red/blue borders indicate focal amplifications.
Fig. 2
Fig. 2. Glioma cohort A integration.
Eleven gliomas of varied grading and molecular phenotype were analyzed by spatial transcriptomics were integrated bioinformatically with Seurat SCTransform normalization and reciprocal PCA workflow. a Uniform manifold approximation and projection (UMAP) of integrated dataset, highlighted by sample. b Stacked bar chart of the distribution of samples within the integrated clusters. c UMAP of the integrated dataset is color-coded by cluster. d Spatial maps of integrated cluster assignments for each sample. e Expression heatmap of top marker genes per cluster. f Heatmap of integrated data module scores for glioma niche-specific transcriptional modules previously described by Ren et al. 2023. The gene sets include tumor core, vascular niche, invasive niche, and hypoxic niche. g Heatmap of integrated data module scores for transcriptional programs previously described by Ravi et al. 2022. Subgroups include Radial Glia, Reactive Immune, Regional Neural Progenitor-like Cells, Regional Oligodendrocyte Progenitor-like Cells, and Reactive Hypoxia.
Fig. 3
Fig. 3. Loss of heterozygosity analysis workflow.
a In our LOH analysis, the allele fraction of known heterozygous SNPs is used to infer underlying copy number changes at the DNA level. We compare germline and tumor scenarios, focusing on 5 SNPs to illustrate key principles. The germline example displays a copy number of 2 and B allele frequencies at 0.5 across all SNPs. In contrast, the tumor displays partial p-arm deletion (white) and chromosome duplication (blue). The copy number state varies from 1 in the deleted p-arm region to 3 in the duplication region. B-allele frequencies at each SNP vary from 0, 0.3, and 0.6. b Integrative Genomics Viewer example of aligned spatial transcriptomic sequencing reads. The top coverage track represents the total reads aligned, with an indication of a SNP highlighted in red. The reference transcript at the bottom is in the 5’ to 3’ orientation, as indicated by arrows. c The SNP density plot shows the location and relative quantity of unique SNPs across the glioma dataset. The chromosomes are listed on the y-axis, with an ideogram below density measurements. d Analysis of i length of defined segments, ii number of unique SNPs per segment, iii segment mode peak values, and iv segment sequential sum of log10(K) values. e The analysis workflow of LOH identification begins with a spatial sample analyzed with the 10X Genomics spaceranger software. A sample BAM is split into cluster-specific BAMs. Read coverage is calculated at predetermined heterozygous SNP positions, filtered by strict criteria. Bayes factor K values are calculated at each SNP. A hidden Markov model independently evaluates each chromosome for each cluster and assigns regions with state determinations. Metrics across segments are evaluated, and a final assignment of heterozygous, LOH, or undefined is determined. SNP allele fractions are plotted in different panels for each cluster, and points are color-coded by state.
Fig. 4
Fig. 4. Spatial distribution of stromal and tumor in Diffuse Midline Glioma A1.
a Graph clustering assignment spatial map of Diffuse Midline Glioma A1, an IDH wild-type, EGFR negative tumor. b Boxplots of ESTIMATE stromal scores for each cluster. The minima and maxima are noted by the whiskers for each boxplot. The 25th percentile and 75th percentile are shown as the bounds of each box. A line across each box represents the median value. The minima is calculated as Q1-1.5*(interquartile range), and the maxima is calculated as Q3 + 1.5*(interquartile range). The mean for each cluster is shown as a point on each boxplot. Mean, median, and number of observations are displayed above each plot. All data points are shown behind each boxplot. c ESTIMATE tumor purity spatial overlay. d ESTIMATE stromal score spatial overlay. e PDGFRA log normalized counts spatial overlay. f Copies of chromosome 10 per spot, whereby the average of normalized gene expression for all genes above the average of 0.1 counts, where tumor regions are expected to have chromosome 10 deleted. g tLOH output of allele fractions for SNPs with total read counts greater than 20. Points are highlighted based on state determination, where blue is heterozygous, and gold is LOH.
Fig. 5
Fig. 5. Subclonal genomic heterogeneity from extrachromosomal DNA double-minutes.
Spatial transcriptomic analysis of a Glioblastoma A1 (left panels) and b Glioblastoma A5 (right panels) reveals spatially distinct subclonal genomic heterogeneity, demonstrating loss of heterozygosity in regions that also show overexpression of ecDNA-amplified genes, including EGFR. As discussed in the text, Glioblastoma A1 showed LOH of chromosome 17 within high EGFR-expressing cluster 9. For each vertical panel: i Schematic of EGFR+ amplified ecDNA fragments based on exome copy number and breakpoint analysis. Glioblastoma A2 shows two different EGFR+ ecDNA variants. iiiii Log2 fold change and B-allele frequency plots from exome sequencing CNV and LOH analysis. ivv Exome analysis coverage of ecDNA, indicating breakpoints and mapped regions. vi SCT-normalized spatial expression of genes within ecDNA regions. Violin plot shows the expression of normalized coverage of genes encompassing DM ecDNA (excluding EGFR) for high EGFR and low EGFR spots (low EGFR < = 5 counts). vii. Spatially mapped average expression for gene expression marker of hypoxia, proliferative cells, macrophages, and cancer stem cells. viii. tLOH analysis showing spatially distinct clusters with LOH. ixx Spot-level B-allele frequency analysis indicates clonal LOH of chromosome 17 in recurrent Glioblastoma A1 and LOH on chromosome 19 in areas with high EGFR expression (high EGFR > 8 counts). Bars and points are color-coded by state: blue for heterozygous, gold for LOH, and gray for undefined.
Fig. 6
Fig. 6. Validation cohort B examining transcriptomic and genomic subclonal heterogeneity in EGFR+ glioblastoma.
Exome sequencing, bulk RNA sequencing, and FFPE ST were used in the validation set, following a similar analysis to cohort A. a Copy number analysis through exome sequencing, showing the location of focal amplifications. b Expression heatmap of top marker genes per cluster. c UMAP plot of integrated dataset, color-coded by sample, cluster, and the distribution of samples within integrated clusters. d Spatial maps of integrated cluster assignments for each sample. While all six samples contained amplified EGFR within a DM ecDNA, two of the six samples also had amplification of negative regulators of TP53. e Glioblastoma B7 contains independent DMs of MDM4 and EGFR. f Glioblastoma B11, showing independent DMs with MDM2 and EGFR. Evidence for DMs based on copy number analysis and corresponding expression data are shown in both panels: i Spatial expression of MDM4/MDM2 and EGFR, alone with violin plots of hypoxia and proliferative signatures, ii Detailed copy number analysis, showing focal amplification zooms, iii Coverage at locus, iv Expression profiles for key pathways highlight that regions expressing genes within the DM regions in both samples also align with areas of high proliferative and hypoxic gene signatures.

Similar articles

References

    1. Louis, D. N. et al. The 2021 WHO classification of tumors of the central nervous system: a summary. Neuro Oncol.23, 1231–1251 (2021). - PMC - PubMed
    1. Wesseling, P., van den Bent, M. & Perry, A. Oligodendroglioma: pathology, molecular mechanisms and markers. Acta Neuropathol.129, 809–827 (2015). - PMC - PubMed
    1. Zhang, Y. et al. The p53 Pathway in Glioblastoma. Cancers10, 10.3390/cancers10090297 (2018). - PMC - PubMed
    1. Mecca, C., Giambanco, I., Donato, R. & Arcuri, C. Targeting mTOR in glioblastoma: rationale and preclinical/clinical evidence. Dis. Markers2018, 9230479 (2018). - PMC - PubMed
    1. Hu, L. S. et al. Integrated molecular and multiparametric MRI mapping of high-grade glioma identifies regional biologic signatures. Nat. Commun.14, 6066 (2023). - PMC - PubMed