. 2025 Jul;26(7):1127-1138.
doi: 10.1038/s41590-025-02182-y. Epub 2025 Jun 13.

Cathepsin L-dependent positive selection shapes clonal composition and functional fitness of CD4+ T cells

Affiliations

Cathepsin L-dependent positive selection shapes clonal composition and functional fitness of CD4+ T cells

Elisabetta Petrozziello et al. Nat Immunol. 2025 Jul.

Abstract

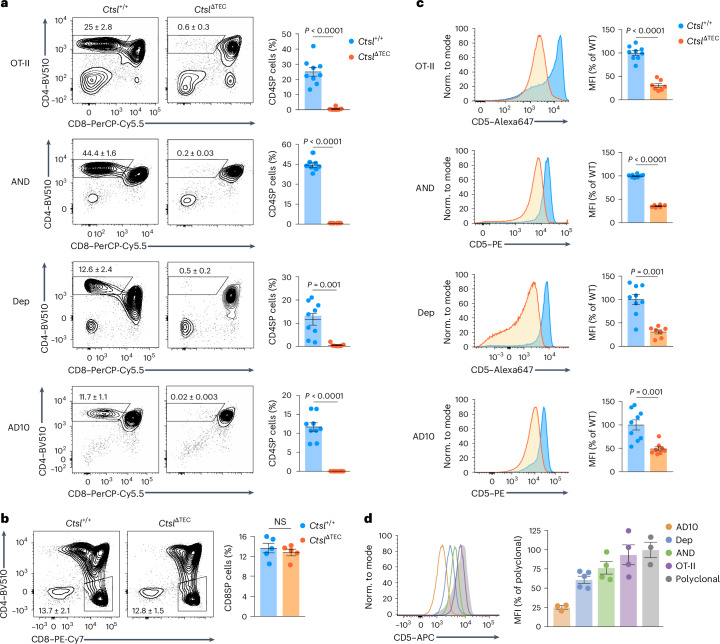
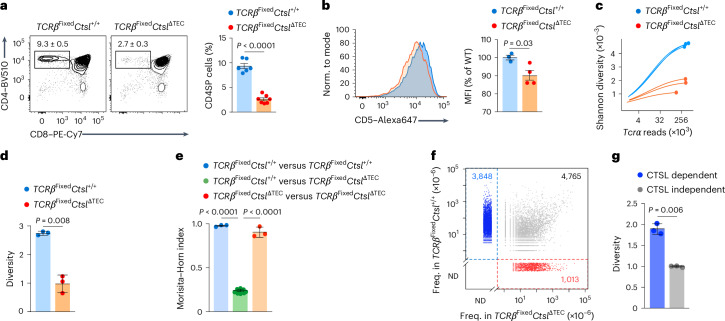
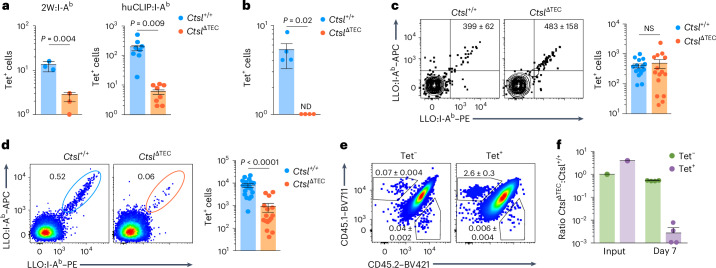
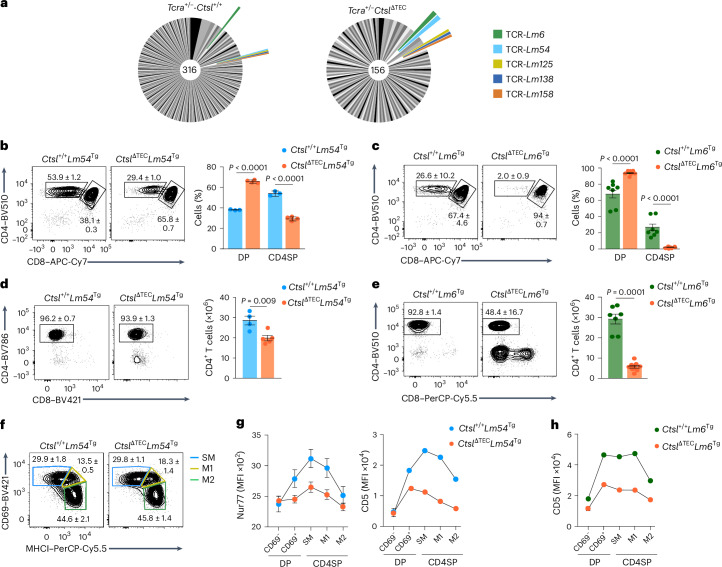
The physiological significance of thymic positive selection and its reliance on a single stromal cell type, cortical thymic epithelial cells, remain incompletely understood. The lysosomal cysteine protease cathepsin L (CTSL) has been implicated in generating major histocompatibility complex class II-bound peptides in cortical thymic epithelial cells for efficient CD4+ T cell differentiation. Here, we addressed the extent and nature of the CD4+ T cell repertoire changes associated with CTSL deficiency. In the absence of CTSL, a highly selective loss of T cell receptors resulted in a markedly reduced repertoire diversity. However, a similarly large proportion of nominally 'CTSL-independent' T cell receptors were retained. Clones representative of the second category experienced weaker positive selection signals in the absence of CTSL, which were sufficient for further maturation yet imprinted aberrant responsiveness to agonist stimulation and impaired homeostatic behavior. Together, these findings demonstrate that CTSL is crucial for both shaping full repertoire diversity and optimizing CD4+ T cell functionality.


Conflict of interest statement

Competing interests: The authors declare no competing interests.

Figures

Fig. 1
Fig. 1. CTSL deficiency alters the cTEC pMHCII ligandome and impairs CD4+ T cell positive selection.
a, Representative flow cytometry plots of thymocyte subsets in Ctsl+/+ (n = 8) and CtslΔTEC mice (n = 10); frequency ± s.e.m. of CD4SP thymocytes is indicated. b, Percentages ± s.e.m. of thymocyte subsets as in a; NS, not significant; DN, double negative. c, Representative flow plots of lymph node cells from Ctsl+/+ (n = 3) and CtslΔTEC (n = 3) mice; frequency ± s.e.m. of CD4+ T cells is indicated. d, Representative flow cytometry plots of MHCII expression on CD45EpCAM+Ly51+ cTECs or CD45EpCAM+Ly51CD80+ mature mTECs from Ctsl+/+ and CtslΔTEC mice (n = 20 each) and MHCII−/− mice (n = 3 and 2) as background. e, Representative flow plots and mean fluorescence intensity (MFI) ± s.e.m. relative to Ctsl+/+ cells of MHCII:CLIP on cTECs or mature mTECs from Ctsl+/+ (n = 5) and CtslΔTEC mice (n = 5) and MHCII−/− mice (n = 2) as background. f, Representative flow plots and MFI ± s.e.m. relative to Ctsl+/+ cells of MHCII:non-CLIP on cTECs or mature mTECs from Ctsl+/+ (n = 12) and CtslΔTEC mice (n = 13) and MHCII−/− mice as background. g, Representative flow cytometry plots and MFI ± s.e.m. relative to Ctsl+/+ cells of I-Ab:Eα52–68 on cTECs or mature mTECs from Ctsl+/+ (n = 4) and CtslΔTEC (n = 3) mice on the C57BL/6 × BALB/c F1 background and C57BL/6 (Eα) mice as background controls. h, CD4SP thymocyte percentages ± s.e.m. in Ctsl+/+ mice (n = 6 or 4) or CtslΔTEC mice (n = 5 or 4) reconstituted with BM from MHCII+/+ or MHCII−/− mice. i, CD4SP thymocyte percentages ± s.e.m. in Ctsl+/+ mice (n = 8 or 9) or CtslΔTEC mice (n = 4 or 3) on a wild-type or Ciitakd transgenic background. j, Representative flow cytometry plots of TCRβ and CD69 surface expression on DP cells from B2m−/−Ctsl+/+ (n = 9) and B2m−/−CtslΔTEC mice (n = 13); frequency ± s.e.m. of TCRβintCD69+ cells is shown (P < 0.001). k, Representative flow cytometry analysis and MFI ± s.e.m. relative to Ctsl+/+ cells of CD5 expression on CD4SP thymocytes from Ctsl+/+ and CtslΔTEC mice (n = 7 each). P values in b were determined by two-way analysis of variance (ANOVA) and Sidak’s test for multiple comparisons and in ek by Student’s two-tailed t-test. Source data
Fig. 2
Fig. 2. CTSL is essential for positive selection of multiple MHCII-restricted transgenic TCRs.
a, Representative flow cytometry plots of thymocyte subsets and percentages ± s.e.m. of CD4SP cells in Ctsl+/+ and CtslΔTEC mice reconstituted with BM from Rag1−/−OT-II (Ctsl+/+, n = 9; CtslΔTEC, n = 7), Rag1−/−AND (Ctsl+/+, n = 8; CtslΔTEC, n = 6), Rag1−/−Dep (Ctsl+/+, n = 9; CtslΔTEC, n = 7) or Rag1−/−AD10 (Ctsl+/+, n = 9; CtslΔTEC, n = 8) TCR transgenic donors. b, Representative flow cytometry plots of the thymus and percentages ± s.e.m. of CD8SP cells in Ctsl+/+ and CtslΔTEC mice reconstituted with BM from OT-I TgRag1−/− donors (n = 5 each). c, Representative flow cytometry plots and MFI ± s.e.m. of CD5 expression in DP thymocytes from BM chimeras as in a, relative to cells selected in Ctsl+/+ chimeras; WT, wild-type. d, Representative flow cytometry plots and MFI ± s.e.m. of CD5 expression in CD4SP thymocytes from Rag1−/−Ctsl+/+ AD10 (n = 3), Rag1−/−Ctsl+/+ Dep (n = 5), Rag1−/−Ctsl+/+ AND (n = 4) and Rag1−/−Ctsl+/+ OT-II (n = 4) TCR transgenic mice relative to polyclonal CD4SP thymocytes (n = 3). P values in a and b were determined by Student’s two-tailed t-test and in c by Welch’s two-tailed t-test. Source data
Fig. 3
Fig. 3. CTSL deficiency results in nonselection of ~50% of TCR clonotypes and enables emergence of ‘newcomer’ TCRs.
a, Representative flow cytometry of thymocyte subsets and frequency ± s.e.m. of CD4SP thymocytes in TcrbFixedCtsl+/+ (n = 6) and TcrbFixedCtslΔTEC mice (n = 7). b, Representative flow cytometry analysis and MFI ± s.e.m. of CD5 expression on CD4SP cells from TcrbFixedCtsl+/+ (n = 3) and TcrbFixedCtslΔTEC mice (n = 4), relative to TcrbFixedCtsl+/+ samples. c, Analysis of sequencing depth by simulation of Shannon diversity as a function of the number of Tcra reads in bulk TCR-sequencing datasets generated with CD4+CD8αCD69MHCI+CD25FoxP3 M2 CD4SP cells from TcrbFixedCtsl+/+ (n = 3 with cells pooled from two to three mice) and TcrbFixedCtslΔTEC mice (n = 3 with cells pooled from two to three mice). All mice were on a Tcra+/−Foxp3GFP background to exclude dual TCR expression and enable exclusion of Foxp3+ cells. d, Shannon diversity analysis (mean ± s.e.m.) of bulk TCR-sequencing datasets as in c. e, Repertoire similarity comparison by Morisita–Horn index (mean ± s.e.m.) for all pairwise comparisons between TCRα datasets from TcrbFixedCtsl+/+ and TcrbFixedCtslΔTEC mice as in c (n = 3 for TcrbFixedCtsl+/+ versus TcrbFixedCtsl+/+; n = 9 for TcrbFixedCtsl+/+ versus TcrbFixedCtslΔTEC; n = 3 for TcrbFixedCtslΔTEC versus TcrbFixedCtslΔTEC). f, Scatter plot of the mean frequency of ‘recurrent’ TCRs in the TcrbFixedCtsl+/+ versus TcrbFixedCtslΔTEC repertoire as in c. Recurrent TCRs (n = 9,626) were defined as clonotypes found in three or more of all six samples regardless of genotype. TCRs exclusively found in Ctsl+/+ samples are highlighted in blue (CTSL-dependent TCRs; n = 3,848), and TCRs exclusively found CtslΔTEC samples are highlighted in red (‘newcomer TCRs’; n = 1,013); ND, not detected. g, Shannon diversity analysis (mean ± s.e.m.) of the CTSL-dependent (blue in f) or CTSL-independent (gray in f) subrepertoires within the TcrbFixedCtsl+/+ repertoire. P values in a, b, d and g were determined by Student’s two-tailed t-test and in e by one-way ANOVA with a Tukey’s test for multiple comparisons. Source data
Fig. 4
Fig. 4. CTSL deficiency imparts ‘antigenic holes’ in the repertoire and blunts CD4+ T cell responsiveness to immunization.
a, Total number ± s.e.m. of 2W- or huCLIP-specific CD4+ T cells in the naive repertoire of Ctsl+/+ (n = 3 for 2W; n = 8 for huCLIP) and CtslΔTEC mice (n = 3 for 2W; n = 8 for huCLIP), quantified by flow cytometric analysis after magnetic enrichment from pooled spleen and lymph node (LN) cells using 2W:I-Ab and huCLIP:I-Ab Tets, respectively. b, Total number ± s.e.m. of PLP11–19-specific CD4+ T cells in the naive repertoire of Ctsl+/+Plp1−/− (n = 4) and CtslΔTECPlp1−/− mice (n = 4), quantified as in a using a PLP11–19:I-Ab Tet. c, Representative flow cytometry plots of LLO190–201-specific CD4+ T cells gated on CD11bCD11cB220F4/80CD4+ T cells after magnetic enrichment from pooled spleen and lymph node cells using the LLO Tet and total number ± s.e.m. of LLO-Tet+ cells quantified as in a in the naive repertoire of Ctsl+/+ (n = 16) and CtslΔTEC mice (n = 15). d, Representative flow cytometry plots gated on activated CD11bCD11cB220F4/80CD44+CD4+ T cells without magnetic enrichment and total number ± s.e.m. of LLO190–201-specific CD4+ T cells in pooled spleen and lymph node cells of Ctsl+/+ (n = 19) and CtslΔTEC mice (n = 16) at day 7 after subcutaneous peptide immunization with adjuvant. e, Representative flow cytometry plot of CD45.1 versus CD45.2 on LLO-Tet and LLO-Tet⁺ spleen cells in CD45.1/CD45.2 wild-type recipients (n = 4) of a 1:1 mixture of bulk M2 SP cells from CD45.1 Ctsl+/+ and CD45.2 CtslΔTEC donors at day 7 after i.v. challenge with LLO peptide plus poly(I:C) pregated on activated CD11bCD11cB220F4/80CD44+CD4+ T cells as in d. f, Ratio between CD45.2+CtslΔTEC and CD45.1+Ctsl+/+ donor-derived cells among LLO-Tet and LLO-Tet⁺ in the input population (same 1:1 M2 CD4SP cell suspension administered to n = 4 recipient mice) and at day 7 after immunization (mean ± s.e.m.), as in e. Data in e and f are representative of two experiments. P values in ad were determined by Student’s two-tailed t-test. Source data
Fig. 5
Fig. 5. CTSL deficiency impedes selection of clones at both extremes of the CD5 spectrum but retains a substantial proportion of nominal ‘good-responder’ TCRs.
a, Representative flow cytometry plot of CD5 expression on total presort M2 CD4SP cells, postsort ‘natural’ CD5lo cells and postsort CD5hi cells from TcrbFixedCtsl+/+ mice, with sorting gates marking ~15% of cells at the low and high extremes of the CD5 spectrum. Histograms of postsort CD5lo and CD5hi cells show before bulk Tcra sequencing (n = 4 each). b, Subrepertoire similarity comparison by Morisita–Horn index (mean ± s.e.m.) for all pairwise comparisons between Tcra datasets from CD5lo and CD5hi M2 CD4SP cells as in a (n = 6 for CD5lo versus CD5lo; n = 16 for CD5lo versus CD5hi; n = 6 for CD5hi versus CD5hi). c, Pie charts showing the proportion of CTSL-dependent and CTSL-independent TCRs among 8,613 recurrent TCRs in the TcrbFixedCtsl+/+ CD4SP repertoire (top) and among 1,402 natural CD5lo TCRs (bottom left) and 1,767 natural CD5hi TCRs (bottom right). Top, colored segments in the outer ring indicate the subset of TCRs cross-assigned to the natural CD5lo or natural CD5hi subrepertoires. d, Relative percentages ± s.e.m. of the ten most abundant clonotypes among expanded LLO-Tet+CD4+ T cells sorted from the spleens of TcrbFixedCtsl+/+ mice at day 7 after i.v. challenge with LLO peptide plus poly(I:C), as quantified by bulk Tcra sequencing (n = 4) (left). The pie chart shows the relative contribution of the ten most abundant clonotypes among expanded LLO-Tet+CD4+ T cells in LLO-immunized TcrbFixedCtsl+/+ mice (middle). Colored segments in the outer ring indicate cross-assignment of these clones to CTSL-dependent and CTSL-independent TCRs among recurrent TCRs in the TcrbFixedCtsl+/+ CD4SP repertoire. Percentages indicate the proportion of Tcra reads (top) or clones (bottom, in parentheses). P values in b were determined by one-way ANOVA with a Tukey’s test for multiple comparisons. Source data
Fig. 6
Fig. 6. LLO-specific TCRs retained in the absence of CTSL indicate a role for CTSL in calibrating positive selection signal strength.
a, Pie charts representing LLO-specific clonotypes in the fully polyclonal repertoire of Tcra+/−Ctsl+/+ mice (n = 316 TCRs) and Tcra+/−CtslΔTEC mice (n = 156 TCRs), identified by single-cell Tcra and Tcrb sequencing of sorted LLO-Tet+ cells (n ≥ 42 mice per genotype; clonotypes aggregated across 19 experiments). Segments in shades of gray represent TCRs exclusively found in one genotype; colored segments represent ‘public’ TCRs shared between genotypes. Segment size is proportional to the number of mice in which a given TCR was detected. b, Representative flow cytometry plots and percent ± s.e.m. of thymocyte subsets in Ctsl+/+Lm54Tg (n = 3) and CtslΔTECLm54Tg mice (n = 4; hereafter CtslΔTECLm54Tg and Ctsl+/+Lm54Tg, respectively). c, Representative flow cytometry plots and percent ± s.e.m. of thymocyte subsets in Rag1−/−Ctsl+/+Lm6Tg (n = 7) and Rag1−/−CtslΔTECLm6Tg mice (n = 9; hereafter CtslΔTECLm6Tg and Ctsl+/+Lm6Tg, respectively). d, Representative flow cytometry plots and number ± s.e.m. of lymph node CD4+ T cells in Ctsl+/+Lm54Tg (n = 4) and CtslΔTECLm54Tg mice (n = 5). e, Representative flow cytometry plots and number ± s.e.m. of lymph node CD4+ T cells in Ctsl+/+Lm6Tg (n = 7) and CtslΔTECLm6Tg mice (n = 9). f, Representative flow cytometry plots of MHCI and CD69 surface expression on CD4SP cells from Ctsl+/+Lm54Tg (n = 9) and CtslΔTECLm54Tg mice (n = 10). The percent ± s.e.m. of SM, M1 and M2 cells is indicated. g, Nur77 and surface CD5 expression (MFI ± s.e.m.) at consecutive DP and CD4SP stages of differentiation in Ctsl+/+Lm54Tg (n = 4 or 5) and CtslΔTECLm54Tg (n = 4 or 5) mice, assessed by intracellular staining and flow cytometry (Nur77) or flow cytometry (CD5). h, CD5 surface expression (MFI ± s.e.m.) at consecutive DP and CD4SP cell differentiation stages in Ctsl+/+Lm6Tg (n = 4) and CtslΔTECLm6Tg mice (n = 5), as assessed by flow cytometry. P values in b and c were determined by two-way ANOVA and a Sidak’s test for multiple comparisons. Data in d and e were analyzed by Student’s two-tailed t-test. Source data
Fig. 7
Fig. 7. CTSL deficiency causes aberrant functional tuning and impaired homeostatic fitness of CD4+ T cells.
a, MA plot of gene expression in Ctsl+/+Lm54Tg (n = 4) versus CtslΔTECLm54Tg (n = 5) M2 CD4SP cells; differentially expressed genes (adjusted P value of <0.1) are shown in color. b, GSEA showing gene sets underrepresented (normalized enrichment score (NES) < −1.8) in CtslΔTECLm54Tg cells as in a. c, Representative flow cytometry plots showing translation at thymocyte stages in Ctsl+/+Lm54Tg and CtslΔTECLm54Tg mice (n = 3 each). A translation inhibitor (background) was included. d, CD69 expression (MFI ± s.e.m.) in M2 CD4SP cells from Ctsl+/+Lm54Tg and CtslΔTECLm54Tg mice (n = 4 each) after 18 h of stimulation with plate-bound LLO190–201:I-Ab. e, PD-1 and BTLA expression (MFI ± s.e.m.) at consecutive DP and CD4SP stages of differentiation in Ctsl+/+Lm54Tg (n = 3) and CtslΔTECLm54Tg mice (n = 4), as assessed by flow cytometry. f, GSEA of Ctsl+/+Lm54Tg versus CtslΔTECLm54Tg M2 CD4SP cells (n = 2 each) after 4 h of stimulation as in d or unstimulated as in a; only gene sets with a normalized enrichment score (NES) of >| 2 | in stimulated cells are shown. g, IL-7Rα and BCL-2 expression (MFI ± s.e.m.) at consecutive DP and CD4SP stages of differentiation in Ctsl+/+Lm54Tg and CtslΔTECLm54Tg mice (n = 5 each). Samples were analyzed by flow cytometry. h, Representative flow cytometry plots showing apoptosis in Ctsl+/+Lm54Tg and CtslΔTECLm54Tg M2 CD4SP cells (n = 5 each) after 24 h of culture in normal medium. i, Viability (mean ± s.e.m.) of Ctsl+/+Lm54Tg and CtslΔTECLm54Tg M2 CD4SP cells (n = 3 each) after 24 h of culture with IL-7, as assessed by flow cytometry. j, Donor cell ratio ± s.e.m. in the spleens of 4.5-Gy-irradiated recipients (n = 4) after transfer of a 1:1 mixture of Ctsl+/+Lm54Tg and CtslΔTECLm54Tg M2 CD4SP cells, as assessed by flow cytometry. k, Ratio ± s.e.m. of donor cells in the spleens of MHCII−/− recipients (n = 3) after transfer of a 1:1 mixture of CellTrace Violet (CTV)-labeled Ctsl+/+Lm54Tg and CtslΔTECLm54Tg M2 CD4SP cells. Histogram (right) shows representative CTV profiles on day 13 after transfer. l, Ratio ± s.e.m. of donor cells in the blood of Rag1−/− recipients (n = 4) after transfer of a 1:1 mixture of Ctsl+/+Lm54Tg and CtslΔTECLm54Tg M2 CD4SP cells. m, Percent divided cells ± s.e.m. in an experimental replicate as in l with CellTrace Violet-labeled donor cells (n = 3 Rag1−/− recipients; day 9). Data were analyzed by Student’s two-tailed t-test. Source data
Extended Data Fig. 1
Extended Data Fig. 1. Ctsl-deficiency alters the cTEC pMHCII ligandome and impairs CD4+ T cell positive selection.
a, Thymocyte subset cell numbers (Mean ± SEM) in Ctsl+/+ (n = 8) and CtslΔTEC mice (n = 10). b, Representative flow cytometry plots of MHCI and CD69 on CD4SPs and percentage ± SEM of M2 cells in Ctsl+/+ (n = 7) and CtslΔTEC mice (n = 7). c, Representative flow cytometry plots of CD25 versus Foxp3 and percentage ± SEM of Foxp3+CD25+ Treg cells in CD4SPs in Ctsl+/+ (n = 7) and CtslΔTEC mice (n = 7); difference not significant. d, Representative flow cytometry plots of CD73 versus CCR7 on Foxp3+CD25+ CD4SPs in Ctsl+/+ (n = 3) and CtslΔTEC mice (n = 4). Percentage ± SEM of CD73+CCR7 re-immigrants is indicated; P = 0.1. e, Mean ± SEM of lymph node CD4+ T cells in Ctsl+/+ (n = 3) and CtslΔTEC mice (n = 3). f, Representative flow cytometry plots of CD44 versus CD62L on CD4+ T cells from Ctsl+/+ (n = 3) and CtslΔTEC mice (n = 3). g, Representative flow cytometry plots of CD25 versus Foxp3 and percentage ± SEM of Foxp3+CD25+ Treg cells in CD4+ T cells from Ctsl+/+ (n = 3) and CtslΔTEC mice (n = 3); P = 0.016. h, Representative flow cytometry plots of MHCII:CLIP on CD80 (immature) mTECs from Ctsl+/+ (n = 13) and CtslΔTEC mice (n = 13); MHCII−/− defines background. i, Representative flow cytometry plots of MHCII:non-CLIP on immature mTECs from Ctsl+/+ (n = 13) and CtslΔTEC mice (n = 13); MHCII−/− defines background. j, CD4SP percentages ± SEM in Ctsl+/+ mice (n = 10 or 6) or Ctsl−/− mice (n = 9 or 7) reconstituted with bone marrow from MHCII+/+ or MHCII−/− mice. k, CD4SP percentages ± SEM in Ctsl+/+ mice (n = 3 or 4) or Ctsl−/− mice (n = 3 each) on wild-type or C2takd transgenic background. l, Representative flow cytometry plots of thymocyte subsets and frequency ± SEM of CD4SPs in Ctsl+/+ B2m−/− (n = 9) and CtslΔTEC B2m−/− mice (n = 13); P < 0.0001. m, Representative flow cytometry analysis and MFI ± SEM relative to Ctsl+/+ cells of CD5 expression on TCRβintCD69+ DPs from Ctsl+/+ B2m−/− (n = 9) and CtslΔTEC B2m−/− mice (n = 13). P-values: (a) by 2-way ANOVA and Sidak’s test for multiple comparisons; (b-g) and (j-m) by Student’s two-tailed t-test. Source data
Extended Data Fig. 2
Extended Data Fig. 2. Ctsl is essential for positive selection of multiple MHCII-restricted transgenic TCRs.
a, Representative flow cytometry plots of thymocyte subsets in Ctsl+/+ and CtslΔTEC mice reconstituted with bone marrow (BM) from the indicated Rag1−/− TCR transgenic donors and corresponding percentages ± SEM of CD4SPs. (n = 3 Ctsl+/+ and 3 CtslΔTEC for LLO56; n = 3 and 3 for LLO118). b, Representative flow cytometry plots and MFI ± SEM of CD5 expression in DP thymocytes from BM chimeras as in (a), relative to cells selected in Ctsl+/+ chimeras. c, Representative flow cytometry plots of thymocyte subsets in Ctsl+/+ Plp1−/− (n = 3) and CtslΔTEC Plp1−/− mice (n = 3) reconstituted with BM from the PLP1 TCR transgenic donors and corresponding percentages ± SEM of CD4SPs. d, Representative flow cytometry plots and MFI ± SEM of CD5 expression in DP thymocytes from BM chimeras as in (c), relative to cells selected in Ctsl+/+ Plp1−/− chimeras. e, CD4SP numbers ± SEM in Ctsl+/+ and CtslΔTEC mice (or Ctsl+/+ Plp1−/− and CtslΔTEC Plp1−/− mice in case of PLP1) reconstituted with BM from the indicated Rag1−/− TCR transgenic donors as in main Fig. 2a or a or c, respectively). All P-values by Student’s two-tailed t-test. Source data
Extended Data Fig. 3
Extended Data Fig. 3. Ctsl-deficiency results in an altered repertoire in TCRβFixed mice.
a, CD4SP cell number ± SEM in TCRβFixed Ctsl+/+ (n = 10) and TCRβFixed CtslΔTEC mice (n = 9). b, Representative flow cytometry plots of CD4 versus CD8 and percentage ± SEM of CD4+ T cells in lymph nodes from TCRβFixed Ctsl+/+ (n = 5) and TCRβFixed CtslΔTEC mice (n = 4). c, Cell number ± SEM of CD4+ T cells in lymph nodes from TCRβFixed Ctsl+/+ (n = 7) and TCRβFixed CtslΔTEC mice (n = 5). d, (left) V-element (Trav gene) usage in recurrent TCRα clones detected exclusively in Fixed-β Ctsl+/+ TCRα inventories (n = 3) (blue; ‘Ctsl+/+-only’ Ctsl-dependent TCRs), or exclusively in Fixed-β CtslΔTEC TCRα inventories (n = 3) (red; ‘CtslΔTEC-only’ newcomer TCRs). Curves show the cumulative proportion of TCR cDNAs using the respective Trav segment ordered from proximal to distal. (right) Area under the curve (Mean ± SEM), determined by dividing the sum of the cumulative proportions by the number of distinct Trav segments detected. e, (left) J-element (Traj gene) usage in ‘Ctsl+/+-only’ TCRα clones or ‘CtslΔTEC-only’ newcomer TCRα clones as in (d). (right) Area under the curve (Mean ± SEM), determined by dividing the sum of the cumulative proportions by the number of distinct Traj segments detected. f, (left) Cumulative proportion of TCRα cDNAs whose V-J junction was modified by deletion or addition of the number of nucleotides specified on the x-axis. (right) Area under the curve (Mean ± SEM), determined by dividing the sum of the cumulative proportions by the number of nucleotide deletion/addition categories (17 possibilities in total). Data in d-f are from n = 3 biological replicates per genotype; each replicate represents pooled cells from 2 or 3 mice. All P-values by Student’s two-tailed t-test. Source data
Extended Data Fig. 4
Extended Data Fig. 4. Ctsl-deficiency does not affect the number of LLO-Tet+ CD4SPs.
(left) Representative flow cytometry plots and total number ± SEM of LLO190-201-specific CD4SPs in the thymus of Ctsl+/+ (n = 16) and CtslΔTEC mice (n = 16) Dot plots are gated on dump-negative (CD11bCD11cB220F4/80) CD4+CD8 cells after magnetic enrichment of Tet+ cells. P-value by Student’s two-tailed t-test. Source data
Extended Data Fig. 5
Extended Data Fig. 5. Ctsl calibrates the positively selecting signal strength.
a, Thymocyte subset cell numbers (Mean ± SEM) in Ctsl+/+Rag1−/−Lm54Tg (n = 3) and CtslΔTECRag1−/−Lm54Tg mice (n = 4). b, Thymocyte subset cell numbers (Mean ± SEM) in Ctsl+/+Rag1−/−Lm6Tg (n = 6) and CtslΔTECRag1−/−Lm6Tg mice (n = 7). c, CD6 surface expression (MFI ± SEM) at consecutive DP and CD4SP differentiation stages in Ctsl+/+Rag1−/−Lm54Tg (n = 4) and CtslΔTECRag1−/−Lm54Tg mice (n = 5), assessed by flow cytometry. P-value by Student’s two-tailed t-test. Source data
Extended Data Fig. 6
Extended Data Fig. 6. Selection in the absence of Ctsl causes aberrant functional tuning and impaired homeostatic fitness of CD4+ T cells.
a, Cell size (Mean ± SEM) of M2 thymocytes in Ctsl+/+Rag1−/−Lm54Tg (n = 3) and CtslΔTECRag1−/−Lm54Tg mice (n = 4). b, CD44 surface expression (MFI ± SEM) at consecutive DP and CD4SP differentiation stages in Ctsl+/+Rag1−/−Lm54Tg (n = 4) and CtslΔTECRag1−/−Lm54Tg mice (n = 5); assessed by flow cytometry. c, CD69 and CD25 expression (MFI ± SEM) in polyclonal M2 thymocytes from CtslΔTEC (n = 3) or Ctsl+/+ mice (n = 3) after 40 h culture with or without (unstim.) plate-bound antibodies to CD3 and CD28; assessed by flow cytometry. d, Representative flow cytometry plots of intracellular phospho-ERK staining of M2 thymocytes from Ctsl+/+Rag1−/−Lm54Tg (n = 3) and CtslΔTECRag1−/−Lm54Tg mice (n = 3) after 5 min stimulation with PMA. Controls without stimulation define background. e, Donor cell ratio (Mean) in the spleen of 4.5 Gy-irradiated recipients (n = 2) after transfer of a 1:1 mixture of CTV-labelled Ctsl+/+ and CtslΔTEC M2 CD4SPs; assessed by flow cytometry. f, Replication index of donor cells on day 21 after transfer as in (e) assessed with FlowJo_v10.9.0 software, assessed by flow cytometry on the basis of CTV-dilution profiles. P-values by Student’s two-tailed t-test.

Similar articles

References

    1. Klein, L., Kyewski, B., Allen, P. M. & Hogquist, K. A. Positive and negative selection of the T cell repertoire: what thymocytes see (and don’t see). Nat. Rev. Immunol.14, 377–391 (2014). - PMC - PubMed
    1. Klein, L. & Petrozziello, E. Antigen presentation for central tolerance induction. Nat. Rev. Immunol.25, 57–72 (2025). - PubMed
    1. Vrisekoop, N., Monteiro, J. P., Mandl, J. N. & Germain, R. N. Revisiting thymic positive selection and the mature T cell repertoire for antigen. Immunity41, 181–190 (2014). - PMC - PubMed
    1. Chu, H. H. et al. Positive selection optimizes the number and function of MHCII-restricted CD4+ T cell clones in the naive polyclonal repertoire. Proc. Natl Acad. Sci. USA106, 11241–11245 (2009). - PMC - PubMed
    1. Huseby, E. S. et al. How the T cell repertoire becomes peptide and MHC specific. Cell122, 247–260 (2005). - PubMed

MeSH terms

LinkOut - more resources