. 2025 Jun;27(6):959-971.
doi: 10.1038/s41556-025-01678-x. Epub 2025 Jun 13.

Cell state-specific cytoplasmic density controls spindle architecture and scaling

Affiliations

Cell state-specific cytoplasmic density controls spindle architecture and scaling

Tobias Kletter et al. Nat Cell Biol. 2025 Jun.

Abstract

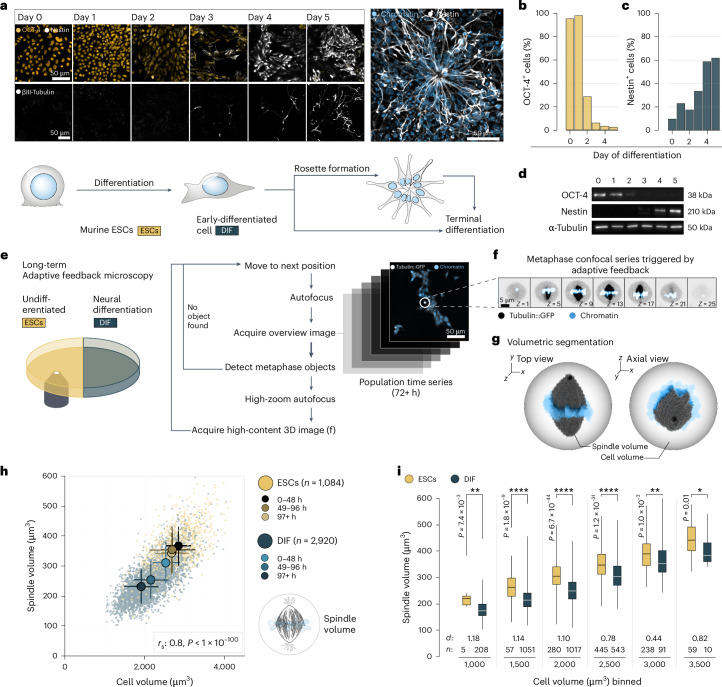
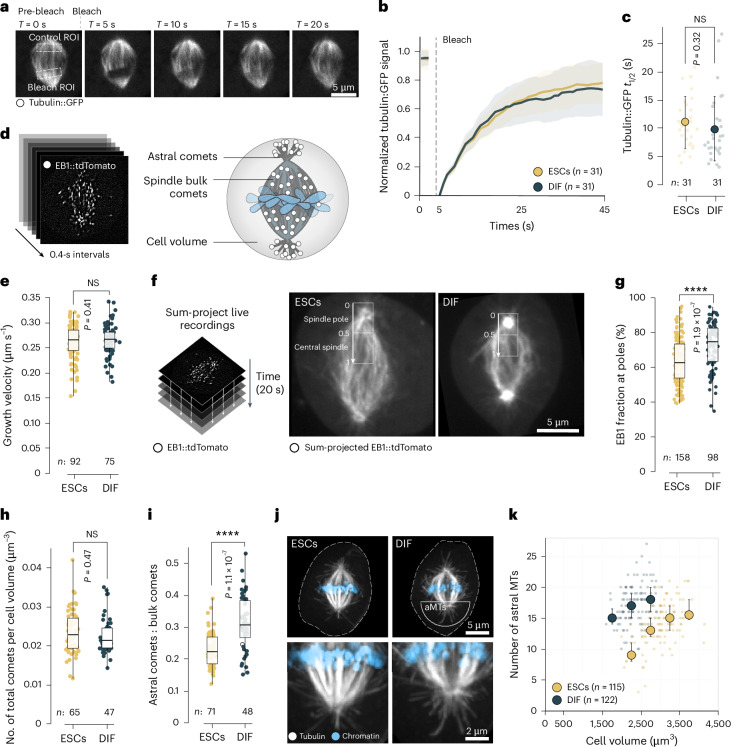
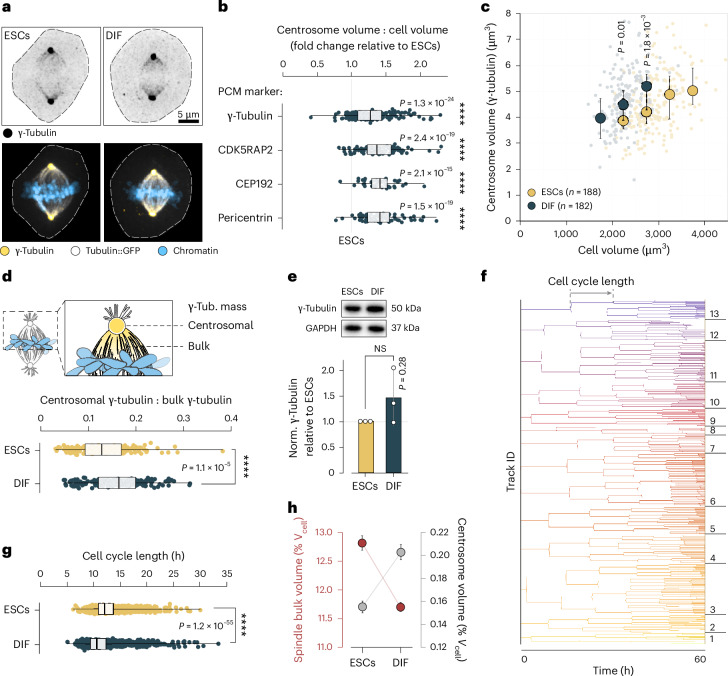
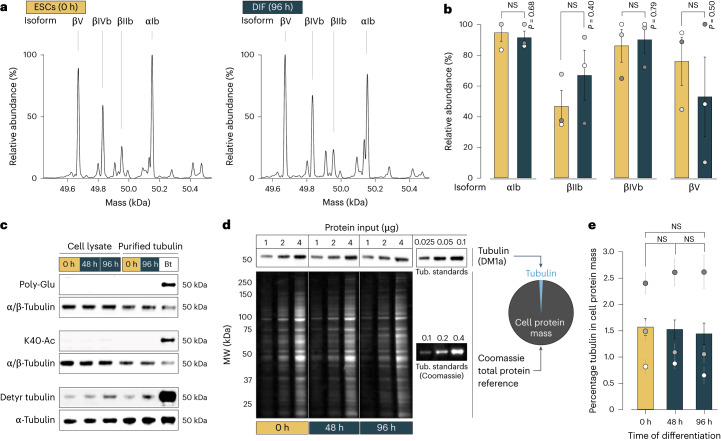
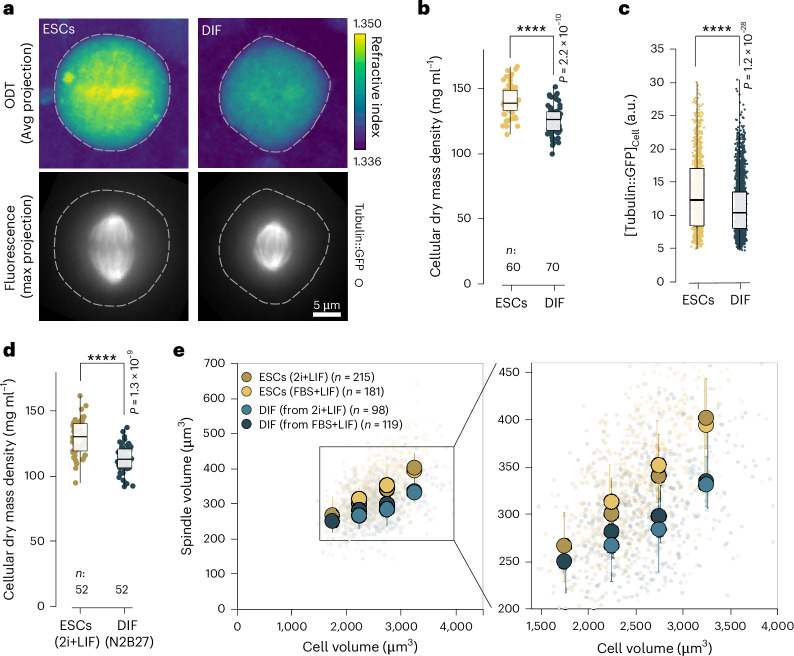
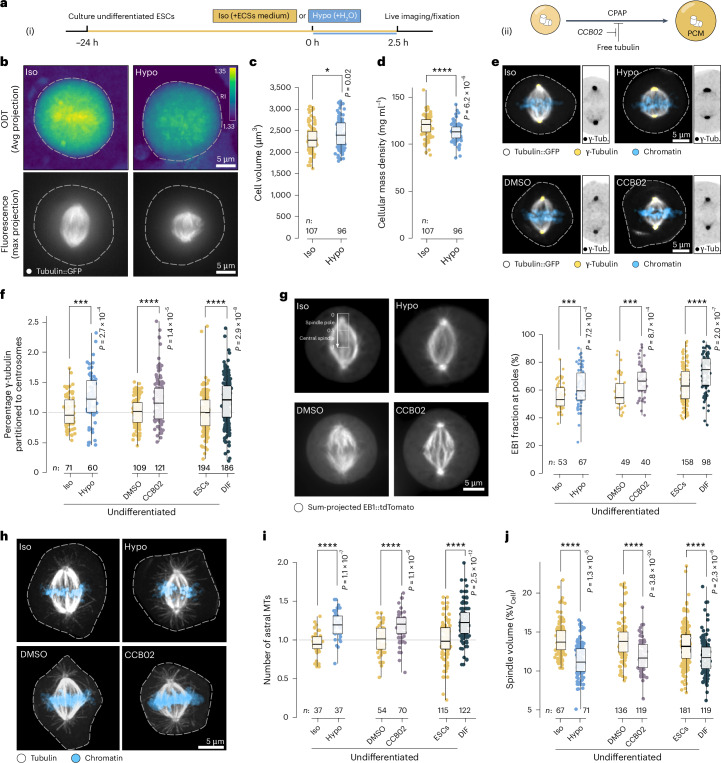
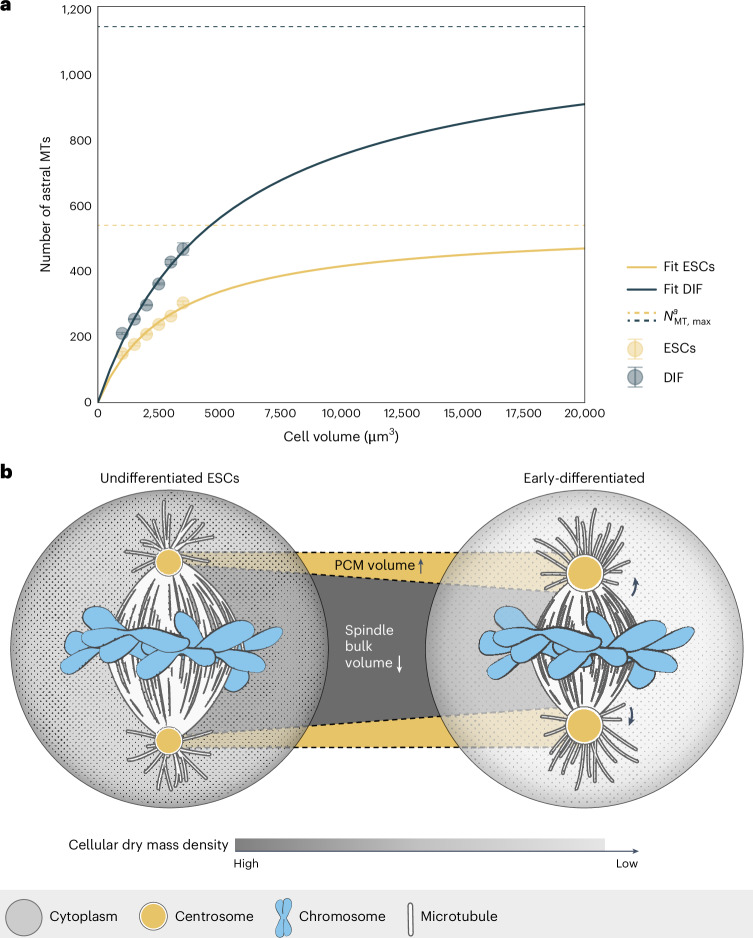
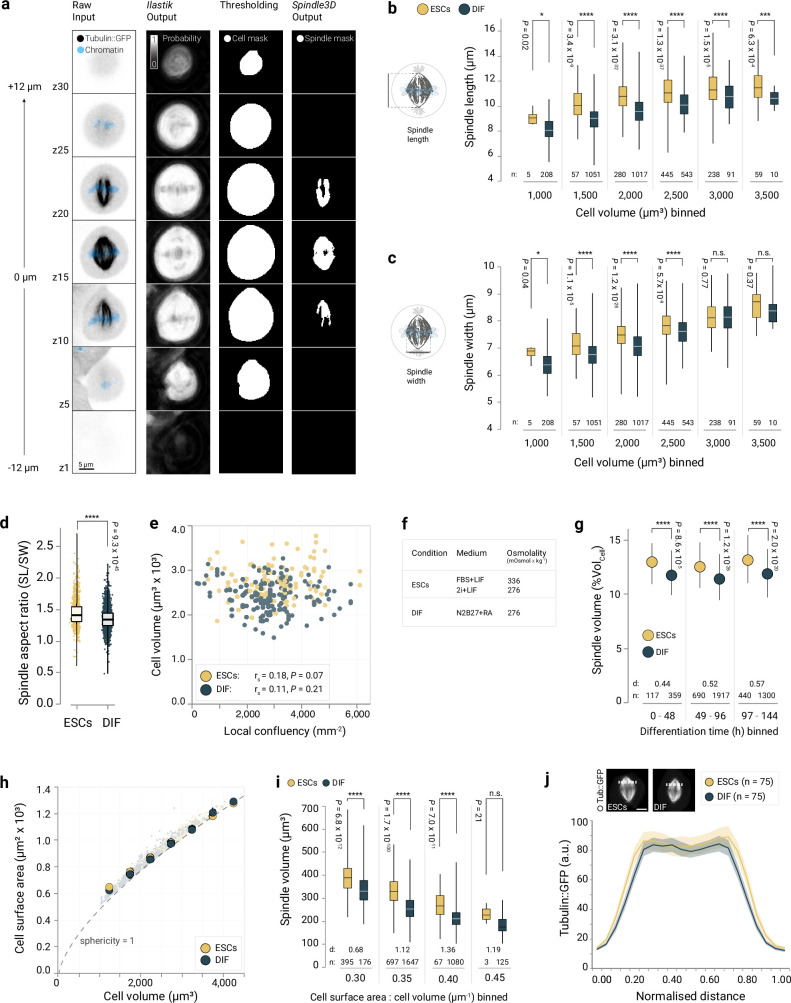
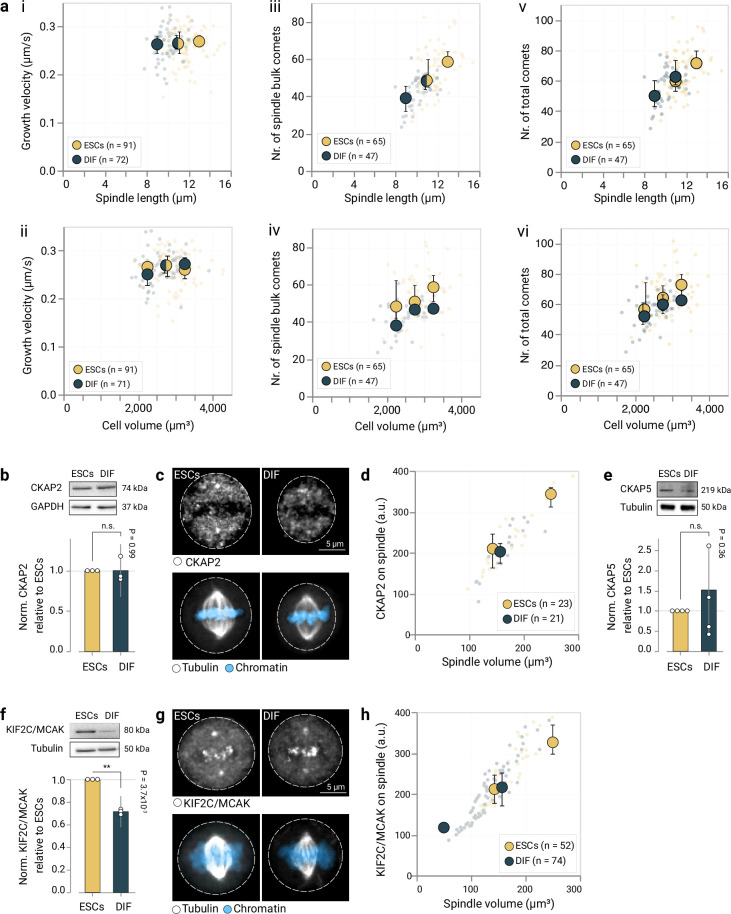
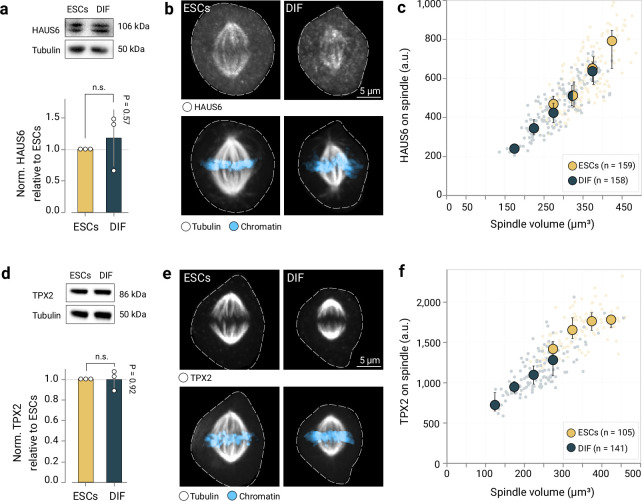
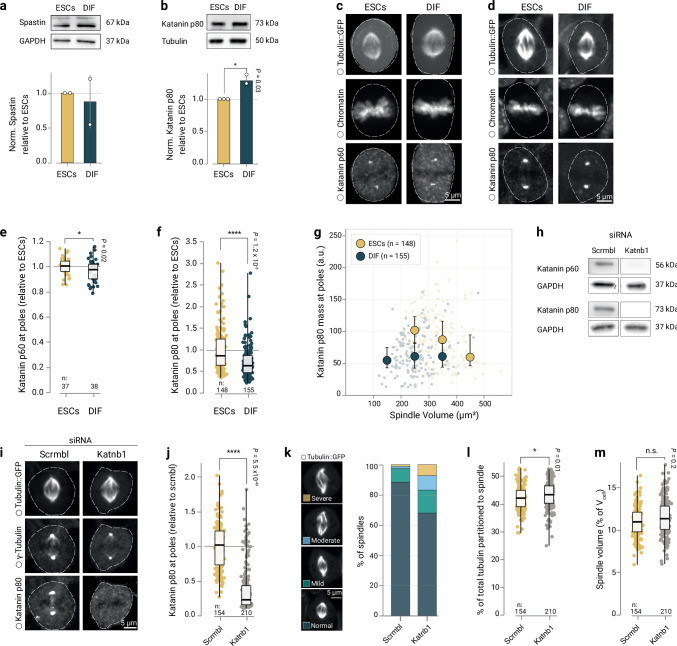
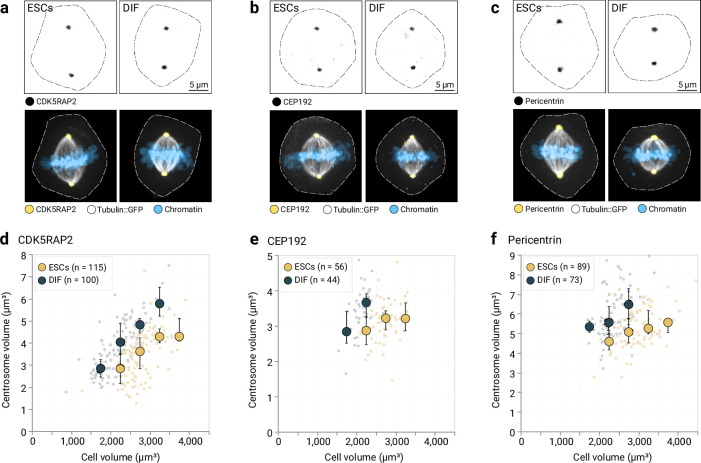
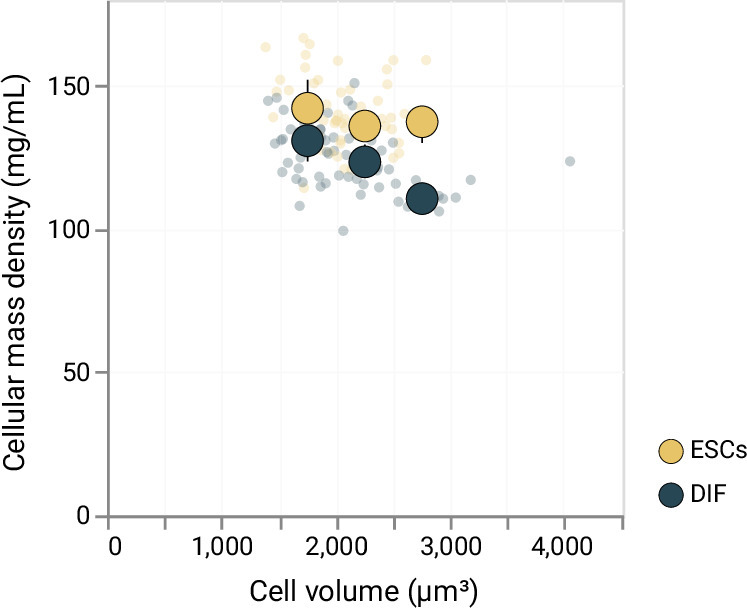
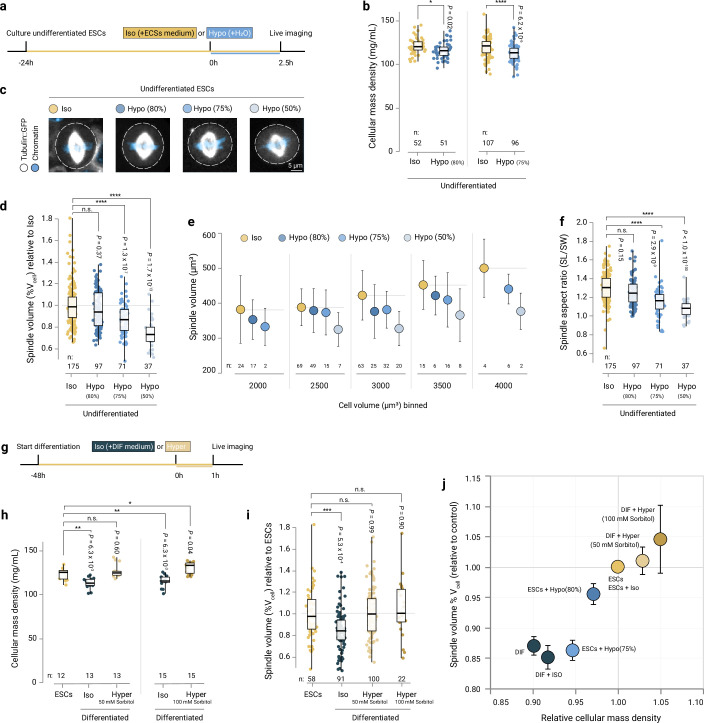
Mitotic spindles are dynamically intertwined with the cytoplasm they assemble in. How the physicochemical properties of the cytoplasm affect spindle architecture and size remains largely unknown. Using quantitative biochemistry in combination with adaptive feedback microscopy, we investigated mitotic cell and spindle morphology during neural differentiation of embryonic stem cells. While tubulin biochemistry and microtubule dynamics remained unchanged, spindles changed their scaling behaviour; in differentiating cells, spindles were considerably smaller than those in equally sized undifferentiated stem cells. Integrating quantitative phase imaging, biophysical perturbations and theory, we found that as cells differentiated, their cytoplasm became more dilute. The concomitant decrease in free tubulin activated CPAP (centrosomal P4.1-associated protein) to enhance the centrosomal nucleation capacity. As a consequence, in differentiating cells, microtubule mass shifted towards spindle poles at the expense of the spindle bulk, explaining the differentiation-associated switch in spindle architecture. This study shows that cell state-specific cytoplasmic density tunes mitotic spindle architecture. Thus, we reveal physical properties of the cytoplasm as a major determinant in organelle size control.


Conflict of interest statement

Competing interests: The authors declare no competing interests.

Figures

Fig. 1
Fig. 1. Spindle size subscales with cell volume upon differentiation.
a, Immunofluorescence staining of mouse ESCs driven towards neural fates in adherent monolayer. Every 24 h, a replicate culture was co-stained for OCT-4 (yellow, top row) and nestin (grey, top row) or stained for βIII-tubulin (grey, bottom row) (left). Neural rosette after 6 days of differentiation stained with Hoechst (blue) and against nestin (grey) (right). All images are maximum projections. Scale bars, 50 µm. Illustration showing the differentiation of ESCs towards neural progenitors (bottom). b, Percentage of OCT-4-positive cells (as in a), covering the first 5 days of neural differentiation (day 1, n = 418 cells; day 2, n = 1,316 cells; day 3, n = 1,199 cells; day 4, n = 2,666 cells; day 5, n = 3,976 cells from one experiment). c, As in b but showing percentage of nestin-positive cells (same experiment as b). d, Immunoblots probing for differentiation markers on a series of cell lysates (n = 1 experiment), covering 5 days of neural differentiation. α-Tubulin as a loading control. e, Automated microscopy setup. ESCs were either kept undifferentiated (‘ESCs’) or driven towards neural differentiation (‘DIF’). Adaptive feedback microscopy pipeline for live-cell imaging with high-content confocal series of metaphase cells expressing tubulin::GFP and chromatin stained with SiR-DNA. Scale bar, 50 µm. f, Confocal raw high-resolution data of a metaphase cell (n = 9 experiments) as described above. Tubulin::GFP (inverted grey) and SiR-DNA (blue). Scale bar, 5 µm. g, 3D-rendered metaphase spindles (grey) after automated volumetric segmentation and morphometry using the Fiji plugin Spindle3D and the pixel-classification tool Ilastik. Chromosomes are shown in blue. The cell volume is illustrated as a cartoon for clarity. h, Spindle volumes scale with cell volumes during differentiation. Each data point represents an individual cell (ESCs n = 1,084 (yellow) and DIF n = 2,920 (blue)). Big circles represent the mean of each differentiation time bin. Error bars show the s.d. Data are pooled from nine independent experiments. rs: Spearman’s correlation, P < 1 × 10−100. i, In equally sized cells, spindle volume subscales in DIF (blue) when compared with ESCs (yellow). n (ESCs, DIF) = 5, 208; 57, 1,051; 280, 1,017; 445, 543; 238, 91; 59, 10 cells binned from 1,000 µm3 through 3,500 µm3 in 500-µm3 bins, with the same experiments as in h. White lines inside boxes denote medians, boxes show interquartile ranges, whiskers show minima and maxima. d, Cohen’s d (effect size). Welch’s t-test (two-sided) per bin. ****P < 0.0001; **P < 0.01; *P < 0.05. Source data
Fig. 2
Fig. 2. Spindles switch to pronounced astral architectures in early-differentiated cells.
a, FRAP (n = 2 experiments) of tubulin::GFP turnover in spindles. Selected frames pre-bleach and post-bleach are shown. Scale bar, 5 µm. b, Normalized FRAP recovery curves from a, lines show the mean (ESCs n = 31 cells, DIF n = 31 cells pooled from two independent experiments), bands show the s.d. c, Recovery half-times of tubulin::GFP derived from b, large circles show means, error bars indicate s.d., small circles show individual cells. Welch’s t-test (two-sided), P = 0.32. d, Mitotic cells expressing EB1::tdTomato imaged live in 0.4-s intervals (left) to determine growth speed and distribution of growing microtubules before and after differentiation (right). e, Average growth speed of EB1::tdTomato-labelled microtubules. Data points show individual cells (ESCs n = 92 cells, DIF n = 75 cells pooled from 6 independent experiments). Boxes show interquartile ranges, black lines inside boxes denote medians, whiskers show minima and maxima. Welch’s t-test (two-sided), P = 0.41. f, EB1::tdTomato videos (20 s) were sum-projected (left). Half-spindle sum intensity profiles were drawn and subdivided into spindle poles (normalized distance 0–0.5) and central spindle (0.5–1) (right). g, Percentage of summed up EB1::tdTomato signal at the spindle pole (normalized half-spindle distance 0–0.5). Data points show individual cells (ESCs n = 158 cells, DIF n = 98 cells pooled from six independent experiments). Boxes show interquartile ranges, black lines inside boxes denote medians, whiskers show minima and maxima. Welch’s t-test (two-sided) P = 1.9 × 10−7. h, Total number of EB1 comets per unit cell volume. Data points show ratio in individual cells (ESCs n = 65, DIF n = 47 from six independent experiments). Boxes show interquartile ranges, black lines inside boxes denote medians, whiskers show minima and maxima. Welch’s t-test (two-sided), P = 0.47. i, Ratio of astral and spindle bulk EB1 comets. Data points show individual cells (ESCs n = 71 cells, DIF n = 48 cells pooled from six independent experiments). Boxes show interquartile ranges, black lines inside boxes denote medians, whiskers show minima and maxima. Welch’s t-test (two-sided), P = 1.1 × 107. j, Max-projected micrographs showing immunostained microtubules (grey). Chromatin counterstained by Hoechst (blue). Dotted lines show cell boundaries. Scale bar, 5 µm. aMTs, astral microtubules. Bottom row, zoomed-in details (Scale bar, 2 µm). k, Differentiating cells increase their number of astral microtubules (as determined in f). Each data point represents a single cell (ESCs n = 115 cells, DIF n = 122 cells pooled from three independent experiments), large circles denote medians in each cell volume bin, error bars show interquartile ranges. ****P < 0.0001; NS, not significant, P > 0.05. Source data
Fig. 3
Fig. 3. Centrosomes superscale upon differentiation.
a, Confocal micrographs (maximum projected, representative of n = 6 experiments) of fixed ESCs or DIF at metaphase. Immunostained γ-tubulin signal (inverted grayscale) (top), immunostained γ-tubulin (yellow), tubulin::GFP (grey) and chromatin (Hoechst, blue) (bottom). Dotted lines indicate cell boundaries. Scale bar, 5 µm. b, Fold change in centrosome occupancy (centrosome volume:cell volume) in DIF relative to ESCs, comparing four centrosomal markers. Data points represent individual cells, boxes show interquartile ranges, vertical lines show medians and whiskers show the minima and maxima. n = 188, 182; 113, 100; 56, 44; 89, 73 cells (ESCs, DIF) stained for γ-tubulin, CDK5RAP2, CEP192 and pericentrin, each from six, three, one and three independent experiments, respectively. Significances against ESCs were tested with Welch’s t-tests (two-sided; γ-tubulin, P = 1.3 × 10−24; CDK5RAP2, P = 2.4 × 10−19; CEP192, P = 2.1 × 10−15; pericentrin, P = 1.3 × 1024). c, Centrosome volume (γ-tubulin) scales with cell volume. Each data point represents a single cell (ESCs n = 188 cells and DIF n = 182 cells pooled from six independent experiments), large circles denote medians in each cell volume bin (bin size = 500 µm3), error bars show the interquartile ranges. Statistics per cell volume bin by Welch’s t-test (two-sided; 2,000–2,500 µm3, P = 0.01; 2,500–3,000 µm3, P = 1.8 × 10−3). d, γ-Tubulin localization (top). Centrosomal to bulk γ-tubulin mass ratio in immunostained cells (see a) (bottom). Data points represent individual cells (sample sizes as in c), boxes show interquartile ranges, vertical lines show medians and whiskers show the minima and maxima. Welch’s t-test (two-sided) P = 1.1 × 10−5. e, Top: representative western blots against γ-tubulin in ESCs or DIF. GAPDH as loading control. γ-Tubulin (normalized to GAPDH), relative fold change (bottom). Bars show mean (n = 3 biological replicates), error bars show s.d., circles show replicates. Welch’s t-test (two-sided), P = 0.28. f, Cell cycle lengths determined by tracking of individual cell families. Visual representation of tracking data of an exemplary adaptive feedback recording (Fig. 1) of ESCs. g, Cell cycle length changes upon differentiation, Intermitotic times from time-lapse recordings (Fig. 1) of ESCs (yellow) or DIF (blue). Data points represent individual cells (n = 2,614 and 2,230 from ESCs and DIF, respectively, pooled from nine independent replicates). Boxes show interquartile ranges, black lines inside boxes denote medians, whiskers show the minima and maxima. Welch’s t-test (two-sided), P = 1.2 × 10−55. h, As spindles subscale, centrosomes superscale upon differentiation. Comparing spindle bulk scaling to cell volume (ESCs n = 1,084 cells and DIF n = 2,920 cells pooled from nine independent experiments) and centrosome scaling to cell volume (data as in c) between ESCs and DIF. Circles show means, error bars show 95% confidence intervals. ****P < 0.0001, NS, not significant, P > 0.05. Source data
Fig. 4
Fig. 4. Constant tubulin biochemistry between the differentiation states.
a, Deconvoluted mass spectra of tubulins purified from ESCs (left) or DIF (right). Average masses of the most abundant signals and corresponding tubulin isoforms, βV (MW = 49,670.3 Da, UniProt P99024), βIVb (MW = 49,830.5 Da, UniProt P68372), βIIb (MW = 49,952.6 Da, UniProt Q9CWF2), αIb (MW = 50,151.1 Da, UniProt P05213). b, Mean relative abundances of the four most dominant isoforms purified from ESCs versus 96 h DIF (n = 3 biological replicates) measured by intact protein mass spectrometry. Error bars show s.e.m. Circles show replicates. Welch’s t-test (two-sided), αIb: P = 0.68, βIIb: P = 0.40, βIVb: P = 0.79, βV: P = 0.50. c, Tubulin PTMs are comparable between differentiation states. Western blots using whole-cell lysates and purified tubulin (n = 2 biological replicates). Affinity-purified Bostaurus (Bt) brain tubulin loaded as positive control. Poly-Glu, poly-glutamylation; K40-Ac, tubulin lysine 40 acetylation; Detyr, detyrosinated tubulin. d, Representative tubulin western blot of three differentiation time points and whole-cell lysates (n = 3 biological replicates) (top). For downstream calibration, defined masses of purified tubulin were blotted onto the same membrane (three technical replicates per batch of lysates). Coomassie-stained whole protein content on a replica gel (bottom). e, Tubulin consistently represents 1.5% of the cellular protein mass. Relative tubulin content in total cellular protein mass in whole-cell lysates of ECSs (0 h) versus 48 h or 96 h DIF cells. Bars show mean ± s.e.m. of n = 3 biological replicates. Circles show mean ± s.e.m. of three technical replicates per experiment. One-way analysis of variance (ANOVA), F-statistic = 0.1263, P = 0.88. NS, not significant, P > 0.05. Source data
Fig. 5
Fig. 5. The cytoplasm is diluted in early-differentiating cells.
a, Average (Avg) z-projections of 3D refractive index (RI) maps derived from optical diffraction tomography of mitotic ESCs or DIF (top). Colour-coded according to RI. Maximum-projected epi-fluorescent micrographs showing the tubulin::GFP signal (bottom). Dotted lines show cell boundaries. Representative images from n = 3 experiments. Scale bars, 5 µm. b, Cellular mass density decreases upon differentiation. 3D cellular mass densities of mitotic ESCs versus DIF. Data points show individual cells (ESCs n = 60 cells and DIF n = 70 cells pooled from three independent experiments). Boxes show interquartile ranges, black lines inside boxes denote medians, whiskers show the minima and maxima. Welch’s t-test (two-sided), P = 2.2 × 1010. c, Average tubulin::GFP signal (3D total cell) decreases during differentiation. Data from long-term automated imaging (Fig. 1). Boxes show interquartile ranges, black lines inside boxes denote medians, whiskers show the minima and maxima. Data points show individual cells (ESCs n = 1,084 cells and DIF n = 2,920 cells pooled from nine independent experiments). Welch’s t-test (two-sided), P = 1.2 × 10−28. d, As in b but showing cellular mass density of DIF from 2i + LIF ESCs cultures (ESCs n = 52 cells and DIF n = 52 cells pooled from two independent experiments). Welch’s t-test (two-sided), P = 1.3 × 10−9. e, Spindle volume subscaling is differentiation intrinsic. Comparing spindle bulk volume scaling to cell volume in DIF originating from 2i + LIF ESCs cultures or from FBS + LIF ESCs cultures, as determined by confocal live-cell imaging (left). Data points show individual cells (ESCs (2i + LIF) n = 215, ESCs (FBS + LIF) n = 181, DIF (from 2i + LIF) n = 98, DIF (from FBS + LIF) n = 215, cells pooled from five independent experiments). Large circles represent medians in 500 µm3 cell volume bins. Error bars show interquartile ranges. Zoomed-in detail (right). ****P < 0.0001. Source data
Fig. 6
Fig. 6. Cytoplasmic dilution shifts spindle architecture by increasing centrosomal nucleation capacity.
a, Osmotic perturbation of ESCs (i) and liberating CPAP from its inhibitory binding to tubulin in ESCs (ii). b, Average (Avg) z-projections of 3D RI maps derived from optical diffraction tomography (ODT) imaging of mitotic ESCs after adding isotonic medium (Iso, 337 mOsmol kg−1) or 25% ultrapure water (Hypo, 250 mOsmol kg−1) (top). Colour-coded according to RI. Maximum-projected epi-fluorescent micrographs showing tubulin::GFP signal (bottom). Dotted lines show cell boundaries. Scale bars, 5 µm. c, ODT-derived cell volumes after hypo-osmotic treatment of ESCs. Boxes show interquartile ranges, black lines inside boxes denote medians, whiskers show the minima and maxima. Data points show individual cells (n isosmotic: 107, n hypo-osmotic: 96 cells pooled from four independent experiments). Welch’s t-test (two-sided), P = 0.02. d, As c but showing mitotic cellular mass density. P = 6.2 × 10−6. e, Maximum-projected confocal micrographs showing immunostained γ-tubulin signals (yellow, or inverted grey (cropped images), respectively) in fixed ESCs, tubulin::GFP in grey, chromatin in blue. Cells after hypo-osmotic challenge (‘Hypo’) versus control (‘Iso’) (top), cells after CCB02 treatment versus control (dimethylsulfoxide ‘DMSO’) (bottom). Scale bars, 5 µm. f, Fraction of total γ-tubulin signals residing at centrosomes, comparing iso- versus hypo-osmotically treated ESCs (n = 71 and 60 cells from iso- and hypo-osmotically treated ESCs, respectively, pooled from two independent experiments, normalized to isosmotic control) and comparing DMSO- versus CCB02-treated ESCs (n = 109 and 121 cells from DMSO- and CCB02-treated ESCs, respectively, pooled from three independent experiments, normalized to DMSO control) and comparing ESCs (n = 188 cells) with DIF (n = 182 cells) (pooled from six independent experiments (Fig. 3b), normalized to ESCs). Boxes show interquartile ranges, black lines inside boxes denote medians, whiskers show the minima and maxima. Welch’s t-test (two-sided), Iso versus Hypo, P = 2.7 × 10−4; DMSO versus CCB02, P = 1.4 × 10−5; ESCs versus DIF, P = 2.9 × 10−8. g, Left: Sum-projected videos (20 s) of mitotic ESCs expressing EB1::tdTomato, after iso- or hypo-osmotic treatment (top), or after treatment with CCB02 or DMSO (bottom). Rectangle indicates region for sum intensity profiles, subdivided into spindle pole and central spindle. Boxplots as in f but showing fraction of EB1::tdTomato sum at spindle poles (right). Iso- (n = 53 cells) or hypo-osmotically treated (n = 67 cells) ESCs (pooled from n = 2 independent experiments), and of ESCs after CCB02 treatment (n = 40 cells) (versus DMSO control, n = 49 cells) (pooled from two independent experiments) and ESCs (n = 158 cells) or DIF (n = 98 cells) (same as Fig. 2g, pooled from six independent experiments). Iso versus Hypo, P = 7.2 × 10−4; DMSO versus CCB02, P = 8.7 × 10−4; ESCs versus DIF, P = 2.0 × 10−7. h, Confocal micrographs (max-projected) of metaphase control (‘Iso’) ESCs or after hypo-osmotic treatment (‘Hypo’) (top row) or CCB02- or DMSO-treated ESCs (bottom row), stained with anti-tubulin antibodies (grey). Chromatin in blue. Dotted lines show cell boundaries. Scale bar, 5 µm. i, Boxplots as in f but showing number of astral microtubules, comparing iso- (n = 37 cells) versus hypo-osmotically treated ESCs (n = 37 cells) (pooled from two independent experiments, normalized to isosmotic control), and comparing DMSO- (n = 54 cells) versus CCB02-treated (n = 70 cells) ESCs (pooled from two independent experiments, normalized to DMSO control), and comparing ESCs (n = 115 cells) with DIF (n = 122 cells) (pooled from three independent experiments (same data as Fig. 2k), normalized to ESCs). Iso versus Hypo, P = 1.1 × 10−7; DMSO versus CCB02, P = 1.1 × 10−6; ESCs versus DIF, P = 2.5 × 10−12. j, Boxplots as in f but showing percentage of cell volume occupied by spindle, comparing iso- (n = 67 cells) versus hypo-osmotically treated ESCs (n = 71 cells) (pooled from n = 2 experiments), and comparing DMSO- (n = 136 cells) versus CCB02-treated (n = 119 cells) ESCs (pooled from three independent experiments), and comparing ESCs (n = 181 cells) with DIF (n = 119 cells) (pooled from five independent experiments (data as Fig. 5e)). Iso versus Hypo, P = 1.3 × 10−5; DMSO versus CCB02, P = 3.8 × 1020; ESCs versus DIF, P = 2.3 × 10−6. *P < 0.05; ***P < 0.001; ****P < 0.0001. Source data
Fig. 7
Fig. 7. Cytoplasmic dilution-driven changes in mitotic architecture in early-differentiated cells.
a, For both cell states (ESCs, yellow; DIF, blue), number of astral microtubules is estimated from spindle volume data (experimental data as Fig. 1h and Supplementary Note Fig. 3) and grouped by cell volume bins of 500 µm3. Large circles depict averages for each cell volume bin (modelled data) and are fitted to equation (6), error bars show s.d. Solid curves represent fit curves. Dashed lines depict predicted saturation values for astral microtubule number. b, Upon differentiating of ESCs, a reduction in cellular mass density leads to enlargement of the pericentriolar material (PCM), increasing centrosomal nucleation capacity and redistribution of microtubule mass away from the spindle bulk towards the asters.
Extended Data Fig. 1
Extended Data Fig. 1. Marker expression and tissue architecture confirm successful differentiation of ESCs into neural rosettes.
a. Top: Confocal data showing immunostaining of PAX6 in fixed ESCs (“Day 0”) and during 5 days of neural differentiation. Bottom: Nuclei stained by Hoechst. Scale bar: 50 µm. b. Immunofluorescent detection of nestin in ESCs-derived rosette cells after 5 days of differentiation. Inlets show nuclei stained by Hoechst. Scale bars: 20 µm. c. As in (b) but detecting MASH1 (also known as ASCL1), a proneural transcription factor. d. As in (b) but detecting ZO-1, marking tight junctions in the rosette centre. e. As in (b) but detecting PAX6, uniformly expressed in the rosette bulk. f. As in (b) but detecting TBR2, sporadically expressed by cells in the rosette periphery. g. As in (b) but detecting AKNA, a centrosomal protein in neural stem and progenitor cells. AKNA+ centrosomes strictly localize to the “apical” pole during interphase. Lookup table of this panel is inverted in comparison with other panels for better visibility. All stainings (a-g) were performed for N = 2 independent experiments.
Extended Data Fig. 2
Extended Data Fig. 2. Spindle size subscaling in differentiating embryonic stem cells (ESCs) is independent of confluency and cell geometry.
a. Volumetric cell analysis, based on training pixel-classifier models in Ilastik to distinguish mitotic cytoplasm via tubulin::GFP. Spindle volume masks were generated via Spindle3D, based on adaptive thresholding of tubulin::GFP. b. Spindle length after binning data into cell volume bins (bin size 500 µm3). Numbers inside the bins show respective n of cells (data sets as in Fig. 1h, n = 5, 208; 57, 1051; 280, 1017; 445, 543; 238, 91; 59, 10 cells for ESCs, DIF conditions binned from 1000 µm3 through 3500 µm3 in 500 µm3 bins, pooled from 9 independent replicates). Boxes denote interquartile ranges, horizontal lines inside boxes show medians, whiskers indicate minima and maxima. Welch’s t-test (two-sided). c. Same as c) but showing spindle width. d. Spindle aspect ratio (spindle length / spindle width). Boxes denote interquartile ranges, horizontal lines inside boxes show medians, whiskers indicate minima and maxima. Data points show individual cells (ESCs n = 1,084 cells, DIF n = 2,920 cells pooled from 9 independent experiments, see Fig. 1h). Welch’s t-test (two-sided), P = 9.3 x 10-45. e. Mitotic cell volume is independent of the local cell confluency. Single data points represent individual cells (ESCs n = 110 cells (yellow) and DIF n = 151 cells (blue) from 3 experiments). rs: Spearman’s correlation coefficient (PESCs = 0.07, PDIF = 0.21). f. Osmolality of the ESCs culturing medium and of the differentiation medium. g. Cell volume occupied by the spindle in ESCs (yellow) and DIF (blue) per differentiation time bin. The circles show the means, error bars show the standard deviation. Welch’s t-test (two-sided). n: data points in each bin. h. Mitotic cells in both differentiation states are spherical. Each data point represents an individual cell (ESCs n = 1,084 (yellow) and DIF n = 2,920 (blue), data pooled from 9 independent experiments). Big circles represent the median of each cell volume bin, the error bars show the interquartile range. The dotted line represents the behaviour of a perfect sphere. i. In cells with comparable cell surface area : cell volume ratios, spindle volume subscales in DIF (blue) when compared with ESCs (yellow). Boxes show interquartile ranges, white lines inside boxes denote medians, whiskers show minima and maxima. n = 395, 176; 697, 1647; 67, 1080; 445, 543; 238, 91; 59, 10 cells for ESCs, DIF conditions binned from 0.3 µm-1 through 0.45 µm-1 in 0.05 µm-1 bins, pooled from 9 independent replicates. d: Cohen’s d. Welch’s t-test (two-sided) for data in each bin. j. Top: Maximum-projected confocal images of mitotic ESCs or DIF (tubulin::GFP in grey) acquired during our automated live-cell imaging protocol (Fig. 1e). Bottom: tubulin::GFP-based intensity profiles of a cross-section between spindle equator and pole in maximum projected confocal images (top, dotted white lines). For consistency, cells were randomly drawn from a pool of cells within the 2500-3000 µm3 cell volume bin (ESCs n = 75 cells (yellow) and DIF n = 75 cells (blue) pooled from 6 independent experiments). Lines denote the means, shaded areas denote the 95% confidence intervals. *: P < 0.05, ***: P < 0.001, ****: P < 0.0001, n.s.: not significant, P > 0.05. d: Cohen’s d. Source data
Extended Data Fig. 3
Extended Data Fig. 3. Microtubule growth speed is independent of spindle length and cell volume.
a. Average single-cell microtubule growth velocities (EB1::tdTomato comets) as a (i) function of spindle length and (ii) cell volume in ESCs (n = 91 cells) or DIF (n = 72 cells). Average single-cell number of EB1::tdTomato spindle bulk comets as a function of (iii) spindle length and (iv) cell volume in ESCs (n = 65 cells) or DIF (n = 47 cells). Average single-cell number of total EB1::tdTomato comets as a function (v) of spindle length and (vi) cell volume in ESCs (n = 65 cells) or DIF cells (n = 47 cells). Data from pooled from 6 independent experiments. Small circles show averages of individual cells, large circles represent medians of binned data, error bars represent interquartile ranges. b. Cellular levels of CKAP2 after 48 h of differentiation relative to ESCs, probed by western blotting and normalized to GAPDH (N = 3, each time loading 2 independent batches of protein extracts). Bars show mean, errors show standard deviation. Welch’s t-test (two-sided), P = 0.99. c. Confocal micrographs (maximum projected, from N = 2 experiments) of methanol-fixed ESCs or DIF at metaphase. Top: Immunostained CKAP2 signal, bottom: tubulin::GFP (grey) and chromatin counterstained by Hoechst (blue). Dotted lines indicate cell boundaries. Scale bar: 5 µm. d. Fluorescent CKAP2 signal on spindle (normalized by total cell CKAP2) summed, as a function of spindle volume. Data points represent single cells (ESCs n = 23 cells and DIF n = 21 cells, data from 2 independent experiments.), large circles denote medians in each bin, the error bars show interquartile ranges. Note that spindle volumes in general are smaller because of methanol fixation. e. Cellular levels of CKAP5 after 48 h of differentiation relative to ESCs, probed by western blotting and normalized to tubulin (N = 4 biological replicates). Bars show mean, errors show the standard deviation, circles show replicates. Welch’s t-test (two-sided), P = 0.36. f. As in b) but showing microtubule depolymerase KIF2C/MCAK. P = 3.7 x 10⁻³. g. As in c) but showing staining for KIF2C/MCAK (N = 2 experiments). h. As in d) but showing KIF2C/MCAK summed spindle signals (ESCs n = 52 cells and DIF n = 74 cells, pooled from 2 independent experiments). Source data
Extended Data Fig. 4
Extended Data Fig. 4. Augmin and TPX2 spindle localization is comparable between the differentiation states.
a. Cellular levels of augmin (subunit HAUS6) after 48 h of differentiation relative to ESCs, probed by western blotting and normalized to tubulin (N = 3 biological replicates). Bars show the mean, errors show the standard deviation, circles show replicates. Welch’s t-test (two-sided), P = 0.57. b. Confocal micrographs (maximum projected, N = 2 experiments) of fixed ESCs or DIF at metaphase. Top: Immunostained HAUS6 signal, bottom: tubulin::GFP (grey) and chromatin counterstained by Hoechst (blue). Dotted lines indicate the cell boundaries. Scale bar: 5 µm. c. Fluorescent HAUS6 signal on spindle (normalized by total cell HAUS6) as a function of spindle volume. Each data point represents a single cell (ESCs n = 159 cells and DIF n = 158 cells pooled from 2 independent experiments), large circles denote medians in each cell volume bin, error bars show interquartile ranges. d. As in a) but showing TPX2 levels (N = 3 biological replicates). P = 0.92. e. As in b) but showing TPX2 immunofluorescence (N = 3 experiments). f. As in c) but showing TPX2 immunofluorescence (ESCs n = 105 cells and DIF n = 141 cells pooled from 3 independent experiments). n.s.: not significant, P > 0.05. Source data
Extended Data Fig. 5
Extended Data Fig. 5. Spindle scaling in ESCs is independent of microtubule severing.
a. Cellular levels of spastin after 48 h of differentiation relative to ESCs, probed by western blotting and normalized to tubulin (N = 2, each time loading 2 independent batches of protein extracts). Bars show mean, errors show the standard deviation, circles show replicates. b. Cellular levels of katanin (subunit p80) after 48 h of differentiation relative to ESCs, probed by western blotting and normalized to tubulin (N = 3 biological replicates). Bars show mean, errors show standard deviation, circles show replicates. Welch’s t-test (two-sided), P = 0.03. c. Confocal micrographs (maximum projected, N = 3 experiments) of fixed ESCs or DIF at metaphase. Top: Tubulin::GFP signal, centre: chromatin (Hoechst), bottom: immunostained katanin p60. Dotted lines indicate cell boundaries. Scale bar: 5 µm. d. As in (c) but staining katanin p80 (N = 3 experiments). e. Average katanin p60 signal at spindle poles. Data points show individual cells (ESCs n = 37 cells and DIF n = 38 cells pooled from 3 independent experiments), boxes denote the interquartile ranges, horizontal lines inside the boxes denote the medians, whiskers show the minimum and maximum. Welch’s t-test (two-sided), P = 0.02. f. As in (e) but showing katanin p80 (ESCs n = 156 cells and DIF n = 168 cells pooled from 3 independent experiments). Welch’s t-test (two-sided), P = 1.2 x 10⁻⁸. g. Increased katanin p80 mass in ESCs is independent of spindle volume. Data points show individual cells (ESCs n = 148 cells and DIF n = 155 cells pooled from 3 independent experiments). Large circles show the medians of spindle volume bins (bin size = 100 µm3), error bars show the interquartile ranges. h. Representative western blots (from N = 3 experiments) showing katanin p80 knockdown (and katanin p60 co-depletion, as has been described previously) in ESCs using siRNAs (Katnb1) next to control using scrambled siRNAs (Scrmbl). GAPDH as loading control. i. Confocal micrographs (maximum projected, N = 3 experiments) of fixed ESCs after katanin p80 knockdown (Katnb1) or control (Scrmbl). Top: tubulin::GFP, centre: γ-tubulin immunostaining as spindle pole reference, bottom: immunostained katanin p80. Dotted lines indicate cell boundaries. Scale bar: 5 µm. j. As in f) but showing Katnb1 siRNA-treated ESCs and control ESCs (Scrmbl) (Katnb1 n = 210 cells and Scrmbl n = 154 cells pooled from 3 independent experiments). Welch’s t-test (two-sided), P = 5.5 x 10-49. k. Left: Representative micrographs (maximum projected, N = 3 experiments) of 4 spindle phenotypes in the RNAi experiment. Right: Percentages of the 4 phenotypes in population after Katnb1 siRNA treatment vs. control (Scrmbl). l. Fraction of tubulin::GFP partitioned to spindle bulk. Data points show individual cells (Katnb1 n = 210 cells and Scrmbl n = 154 cells from 3 independent experiments), boxes show interquartile ranges, horizontal bars show medians, whiskers show minima and maxima. Welch’s t-test (two-sided), P = 0.01. m. As in l) but showing spindle volume as a percentage of cell volume. P = 0.2. *: P < 0.05, ****: P < 0.0001, n.s.: not significant, P > 0.05. Source data
Extended Data Fig. 6
Extended Data Fig. 6. The pericentriolar material (PCM) superscales upon differentiation.
a. Confocal micrographs (maximum projected, representative from ESCs n = 113 cells and DIF n = 100 cells pooled from 3 independent experiments) of fixed ESCs or DIF at metaphase. Top: Immunostained CDK5RAP2 signal (inverted grayscale), bottom: immunostained CDK5RAP2 (yellow), tubulin::GFP (grey) and chromatin (Hoechst, blue). Dotted lines indicate cell boundaries. Scale bar: 5 µm. b. As in a) but using CEP192 (representative from ESCs n = 56 cells and DIF n = 44 cells from 1 experiment). c. As in a) but using pericentrin (representative from ESCs n = 89 cells and DIF n = 73 cells pooled from 3 experiments). d. Scaling relationship between cell volume and centrosome volume based on CDK5RAP2. Data points represent single cells (ESCs n = 113 cells and DIF n = 100 cells pooled from 3 independent experiments), large circles denote medians per cell volume bin, the error bars show interquartile ranges. e. As in d) but based on CEP192 (ESCs n = 56 cells and DIF n = 44 cells pooled from 1 experiment). f. As in d) but based on pericentrin (ESCs n = 89 cells and DIF n = 73 cells pooled from 3 experiments). Source data
Extended Data Fig. 7
Extended Data Fig. 7. The cytoplasm in differentiating cells is diluted across all cell sizes.
Scaling relationship between cell volume and cellular mass density. Data points represent single cells (ESCs n = 61 cells, DIF n = 71 cells from 3 independent experiments, same data as in Fig. 5), the large circles denote the medians in each cell volume bin, the error bars show the interquartile ranges. Source data
Extended Data Fig. 8
Extended Data Fig. 8. Biophysical perturbation of cellular mass density modulates spindle scaling.
a. Hypoosmotic treatment of ESCs for live optical diffraction tomography (ODT) or confocal imaging. b. ODT-derived cellular mass densities after hypoosmotic treatment (left: 80/20, right: 75/25, % medium/H2O) of ESCs. Boxes show interquartile ranges, horizontal lines show medians, whiskers show minima and maxima. Data points show individual cells (80/20: n isosmotic: 52 cells, n hypoosmotic: 51 cells pooled from 3 independent experiments, 75/25: n isosmotic: 107 cells, n hypoosmotic: 96 cells pooled from 4 independent experiments). Welch’s t-test (two-sided), Iso vs. Hypo (80%): P = 0.02; Iso vs. Hypo (75%): P = 6.2 x 10⁻⁶. c. Confocal live-cell imaging (central slices) of control ESCs (isosmotic treatment) versus increasing hypoosmotic challenges. Tubulin::GFP in grey, chromatin in blue. Dotted lines show cell boundaries. Scale bar: 5 µm. d. Cell volume-normalized spindle volumes during hypoosmotic challenge of ESCs, fold change relative to control ESCs (Iso). Boxes show interquartile ranges, horizontal lines show medians, whiskers show minima and maxima. Data points show individual cells (n isosmotic: 175 cells, n Hypo (80%): 97 cells, n Hypo (75%): 71 cells, and n Hypo (50%): 37 cells from 5 independent experiments). Welch’s ANOVA and two-sided Games-Howell post-hoc testing, Iso vs. Hypo (80%): P = 0.37; Iso vs. Hypo (75%): P = 1.3 x 10⁻⁷; Iso vs. Hypo (50%): P = 1.7 x 10⁻¹³. e. Data from (d) re-analysed, showing spindle volumes within cell volume bins (n = 24, 17, 2, 0; 69, 49, 15, 7; 63, 25, 32, 20; 15, 6, 16, 8; 4, 0, 6, 2 for Iso, Hypo (80%), Hypo (70%), and Hypo (50%) conditions, respectively, binned from 2,000 µm3 through 4,000 µm3 in 500 µm3 bins). Circles show means, error bars show standard deviation. Horizontal grey lines indicate mean value of the control ESCs (Iso). f. Boxplots and data as (d) but re-analysed showing spindle aspect ratios (length/width). Welch’s ANOVA and two-sided Games-Howell post-hoc testing, Iso vs. Hypo (80%): P = 0.15; Iso vs. Hypo (75%): P = 2.9 x 10⁻⁹; Iso vs. Hypo (50%): P < 1.0 x 10-100. g. Hyperosmotic treatment of DIF for live optical diffraction tomography (ODT) or confocal imaging. h. ODT-derived cellular mass densities after hyperosmotic treatment (left: +50 mM Sorbitol, right: +100 mM Sorbitol) of DIF, untreated ESCs as additional control. Boxes show the interquartile ranges, horizontal lines show medians, whiskers show minima and maxima. Data points show individual cells (+50 mM Sorbitol: n ESCs: 12 cells, n isosmotic DIF: 13 cells, n hyperosmotic DIF: 13 cells pooled from 1 independent experiment, +100 nM Sorbitol: n isosmotic DIF: 15 cells, n hyperosmotic: 15 cells from 1 independent experiment) Welch’s ANOVA and two-sided Games-Howell post-hoc testing, ESCs vs. DIFIso: P = 6.3 x 10⁻³; ESCs vs. DIF50mM Sorbitol: P = 0.60; ESCs vs. DIF100mM Sorbitol: P = 0.04. i. Cell volume-normalized spindle volumes during hyperosmotic challenge of DIF (fold change relative to ESCs). Boxes show interquartile ranges, horizontal lines show medians, whiskers show minima and maxima. Data points show individual cells (n ESCs: 58 cells, n isosmotic DIF: 91 cells, n hyperosmotic DIF (50 mM): 100, n hyperosmotic DIF (100 mM): 22 pooled from 2 independent experiments). Welch’s ANOVA and two-sided Games-Howell post-hoc testing, ESCs vs. DIFIso: P = 5.3 x 10⁻⁴; ESCs vs. DIF50mM Sorbitol: P = 0.99; ESCs vs. DIF100mM Sorbitol: P = 0.90. j. Composite chart showing the cell volume-normalized spindle volumes (fold changes relative to controls) as a function of the mean cellular mass density (as fold change relative to controls). Circles show means, error bars show standard error of the mean. Data merged from this figure and Fig. 6 (n ESCs: 181 cells and n DIF: 119 cells pooled from 5 independent experiments; n ESCs+Iso: 175, n ESCs+Hypo80%: 97, n ESCs+Hypo75%: 71, n ESCs+Hypo50%: 37 pooled from 5 independent experiments; n DIF+Iso: 91 cells, n DIF+50mM: 100 cells, n DIF+100mM: 22 cells pooled from 2 experiments). *: P < 0.05, **: P < 0.01, ***: P < 0.001, ****: P < 0.0001, n.s.: not significant, P > 0.05. Source data

Similar articles

Cited by

References

    1. Thompson, D. W. On Growth and Form (Cambridge Univ. Press, 1992).
    1. Valdez, V. A., Neahring, L., Petry, S. & Dumont, S. Mechanisms underlying spindle assembly and robustness. Nat. Rev. Mol. Cell Biol.24, 523–542 (2023). - PMC - PubMed
    1. Wühr, M. et al. Evidence for an upper limit to mitotic spindle length. Curr. Biol.18, 1256–1261 (2008). - PMC - PubMed
    1. Greenan, G. et al. Centrosome size sets mitotic spindle length in Caenorhabditis elegans embryos. Curr. Biol.20, 353–358 (2010). - PubMed
    1. Courtois, A., Schuh, M., Ellenberg, J. & Hiiragi, T. The transition from meiotic to mitotic spindle assembly is gradual during early mammalian development. J. Cell Biol.198, 357–370 (2012). - PMC - PubMed

LinkOut - more resources