

Integrated analysis of oral rinse-derived and plasma circulating tumour DNA for mutation profiling and outcome prediction with oral squamous cell carcinoma
- PMID: 40514434
- PMCID: PMC12166076
- DOI: 10.1038/s41698-025-00976-9
Integrated analysis of oral rinse-derived and plasma circulating tumour DNA for mutation profiling and outcome prediction with oral squamous cell carcinoma
Abstract
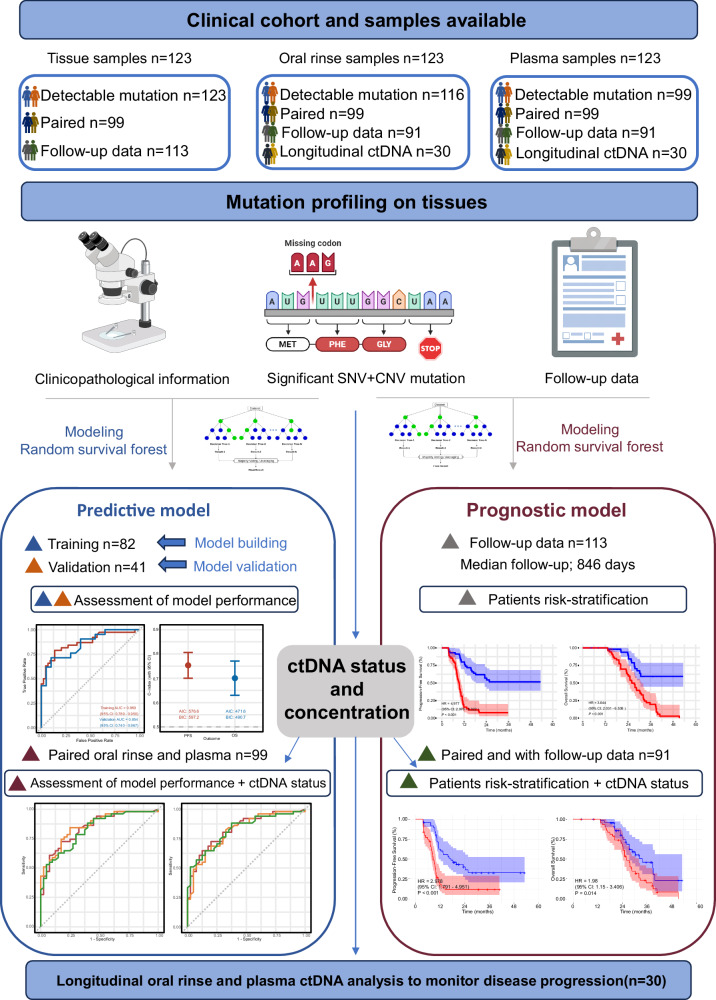
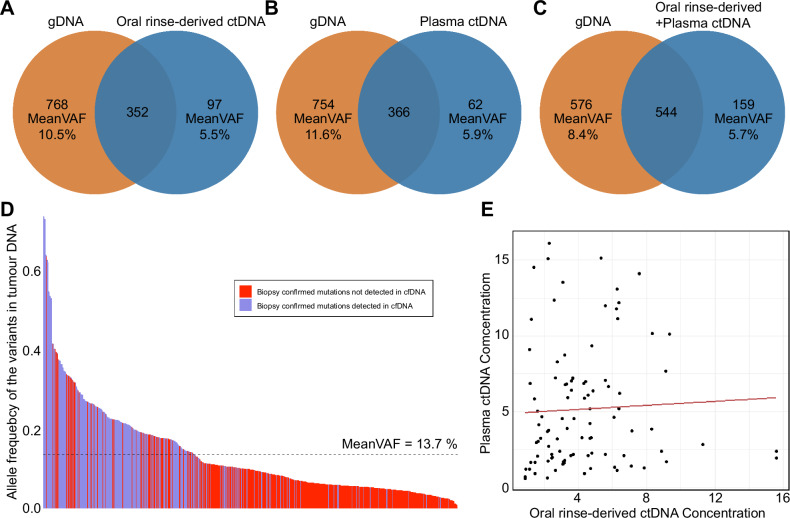
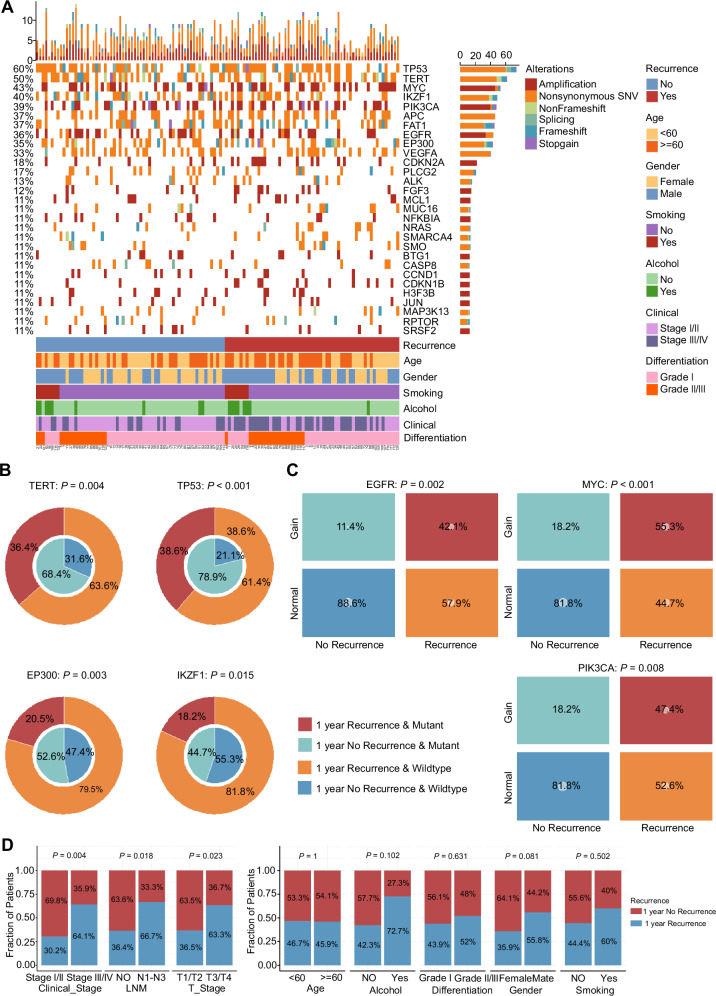
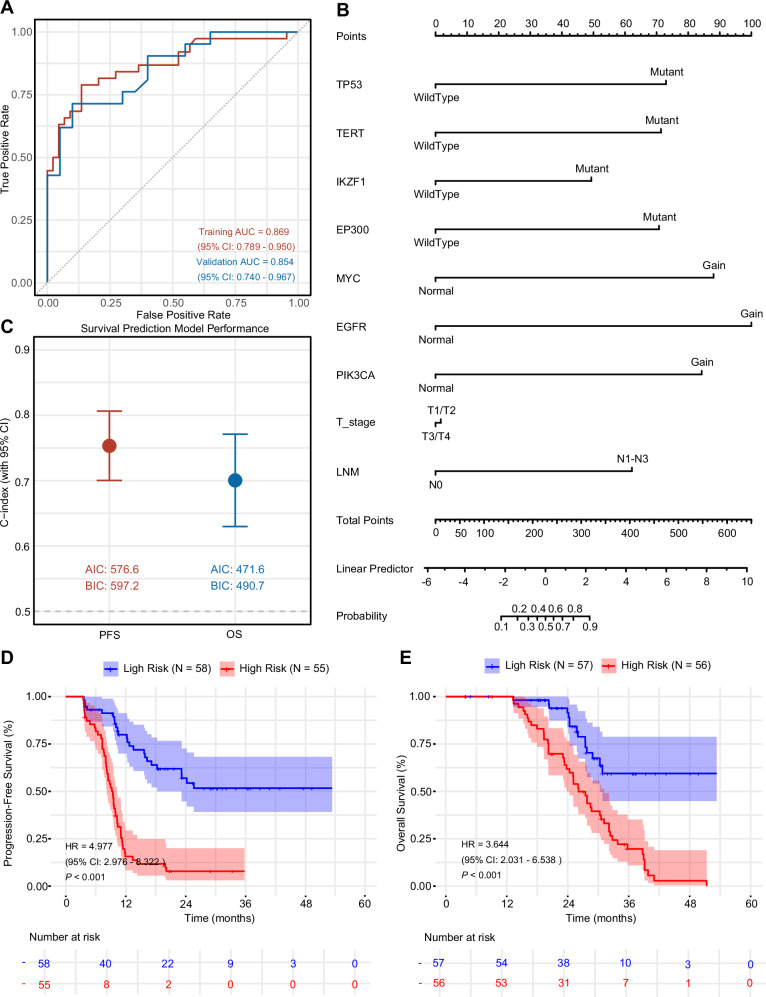
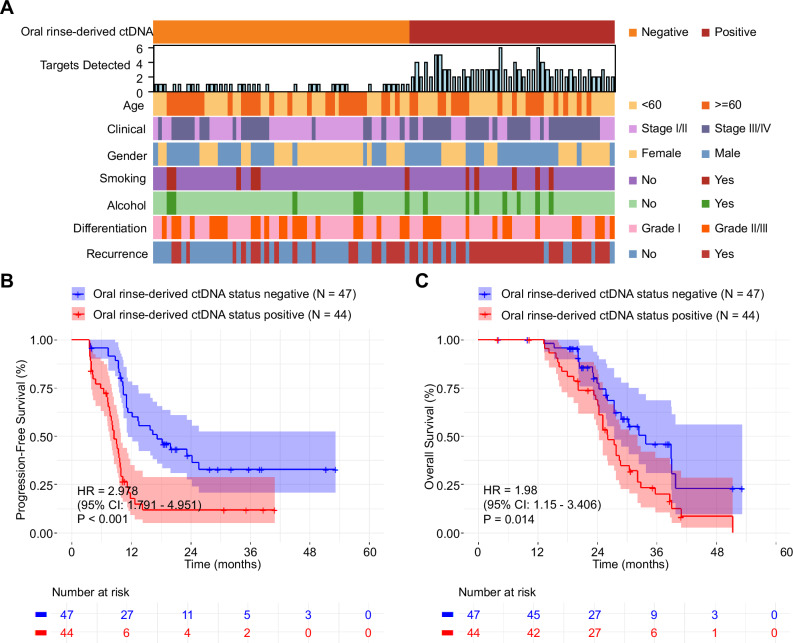
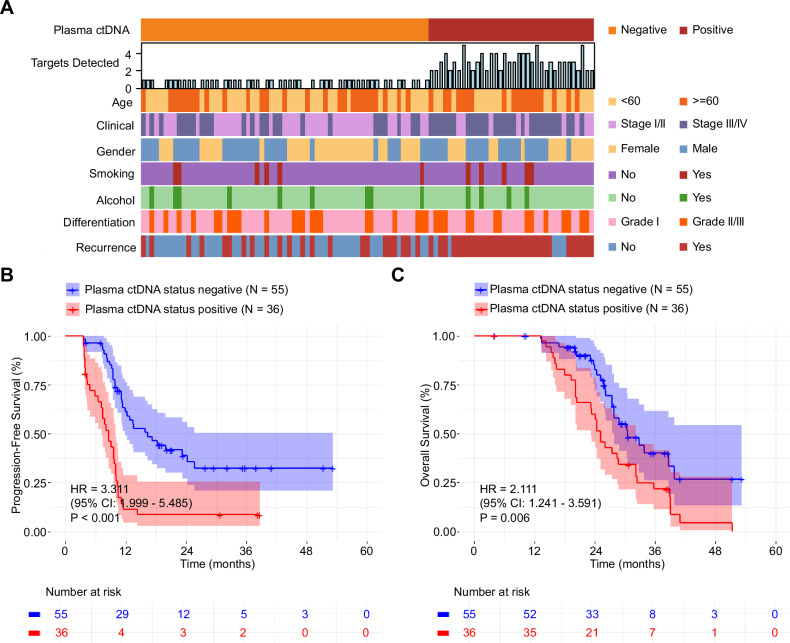
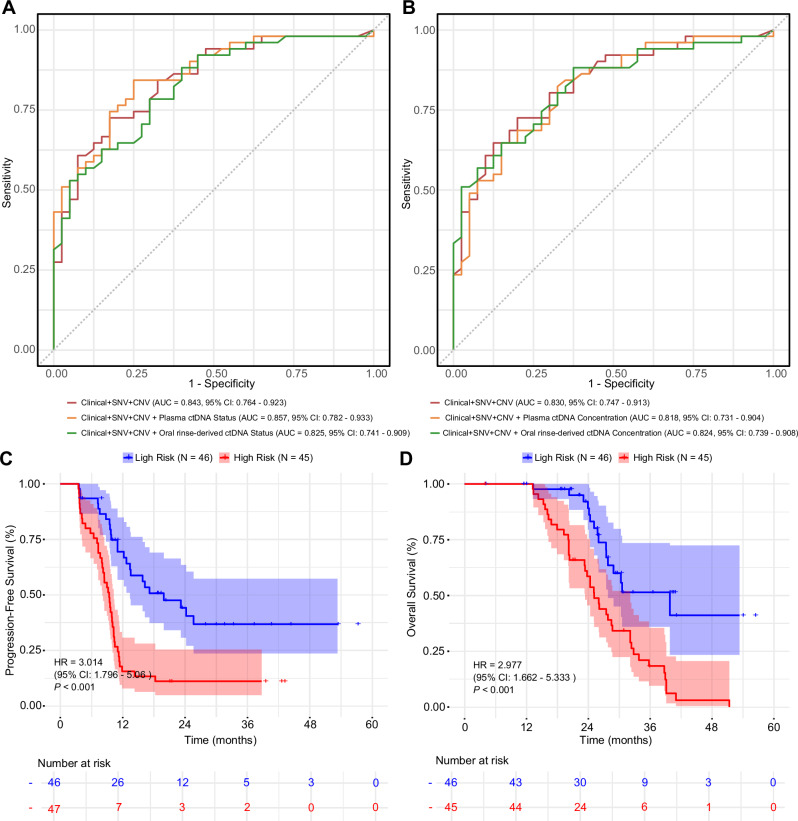
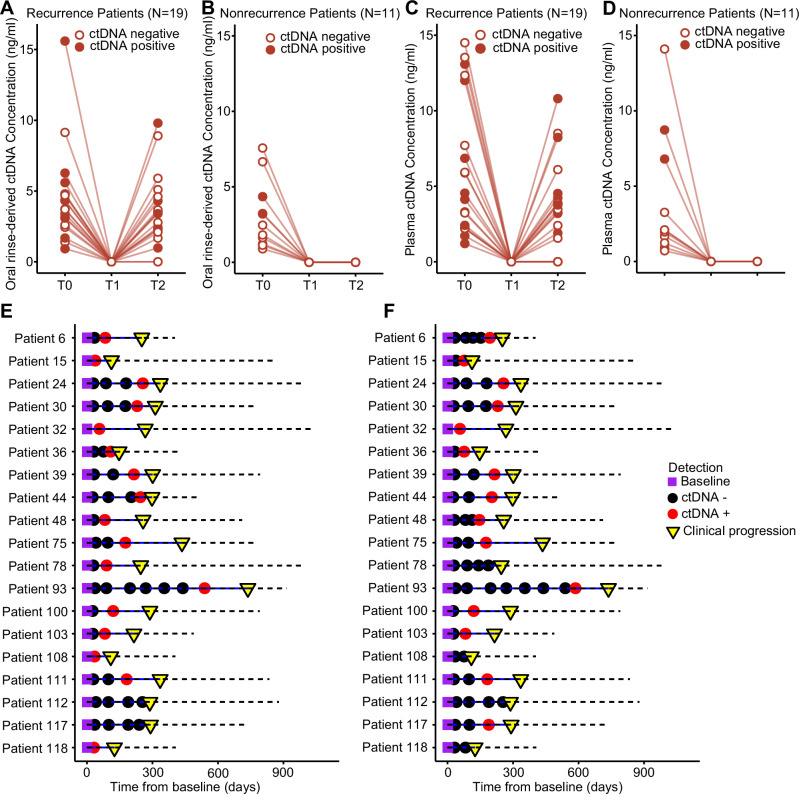
This study evaluates the potential of oral rinse-derived and plasma circulating tumour DNA (ctDNA) in HPV-negative oral squamous cell carcinoma (OSCC), where early recurrence occurs in a significant proportion of patients, contributing to poor prognosis. Analysis of paired tissue, oral rinse, and plasma samples from 123 patients revealed ctDNA detection rates of 94.3% in oral rinse and 80.5% in plasma samples. Combined testing improved mutation detection sensitivity to 48.6%. A machine learning model integrating seven mutated genes (TP53, TERT, IKZF1, EP300, MYC, EGFR, PIK3CA) and clinical factors demonstrated robust prediction of recurrence (validation AUC: 0.854) and survival outcomes. Integration of pretreatment plasma ctDNA status further enhanced predictive performance. In longitudinal analysis, ctDNA detected recurrence approximately four months before clinical manifestation. These findings suggest that integrated ctDNA analysis offers improved mutation profiling and outcome prediction, potentially enabling earlier interventions in OSCC.
© 2025. The Author(s).
Conflict of interest statement
Competing interests: The authors declare no competing interests.
Figures
Similar articles
-
Construction of a risk stratification model integrating ctDNA to predict response and survival in neoadjuvant-treated breast cancer.BMC Med. 2023 Dec 12;21(1):493. doi: 10.1186/s12916-023-03163-4. BMC Med. 2023. PMID: 38087296 Free PMC article.
-
Cerebrospinal fluid circulating tumour DNA genotyping and survival analysis in lung adenocarcinoma with leptomeningeal metastases.J Neurooncol. 2023 Oct;165(1):149-160. doi: 10.1007/s11060-023-04471-8. Epub 2023 Oct 28. J Neurooncol. 2023. PMID: 37897649 Free PMC article.
-
The Landscape of Actionable Genomic Alterations by Next-Generation Sequencing in Tumor Tissue Versus Circulating Tumor DNA in Chinese Patients With Non-Small Cell Lung Cancer.Front Oncol. 2022 Feb 22;11:751106. doi: 10.3389/fonc.2021.751106. eCollection 2021. Front Oncol. 2022. PMID: 35273907 Free PMC article.
-
Role of circulating tumor DNA and cell-free DNA biomarkers in diagnosis and prognosis of oral cancer - a systematic review.BMC Oral Health. 2025 Apr 11;25(1):522. doi: 10.1186/s12903-025-05898-3. BMC Oral Health. 2025. PMID: 40217229 Free PMC article.
-
The role of molecular biomarkers in the diagnosis, prognosis, and treatment stratification of oral squamous cell carcinoma: A comprehensive review.J Liq Biopsy. 2025 Jan 4;7:100285. doi: 10.1016/j.jlb.2025.100285. eCollection 2025 Mar. J Liq Biopsy. 2025. PMID: 40027232 Free PMC article. Review.
References
-
- Sung, H. et al. Global Cancer Statistics 2020: GLOBOCAN estimates of incidence and mortality worldwide for 36 cancers in 185 countries. CA Cancer J. Clin.71, 209–249 (2021). - PubMed
-
- Gatta, G. et al. Prognoses and improvement for head and neck cancers diagnosed in Europe in early 2000s: The EUROCARE-5 population-based study. Eur. J. Cancer51, 2130–2143 (2015). - PubMed
-
- de Bree, R. et al. Detection of locoregional recurrent head and neck cancer after (chemo)radiotherapy using modern imaging. Oral. Oncol.45, 386–393 (2009). - PubMed
LinkOut - more resources
Full Text Sources
Research Materials
Miscellaneous
