. 2025 Jun 13;9(1):182.
doi: 10.1038/s41698-025-00993-8.

Augmenting precision medicine via targeted RNA-Seq detection of expressed mutations

Affiliations

Augmenting precision medicine via targeted RNA-Seq detection of expressed mutations

Dan Li et al. NPJ Precis Oncol. .

Abstract

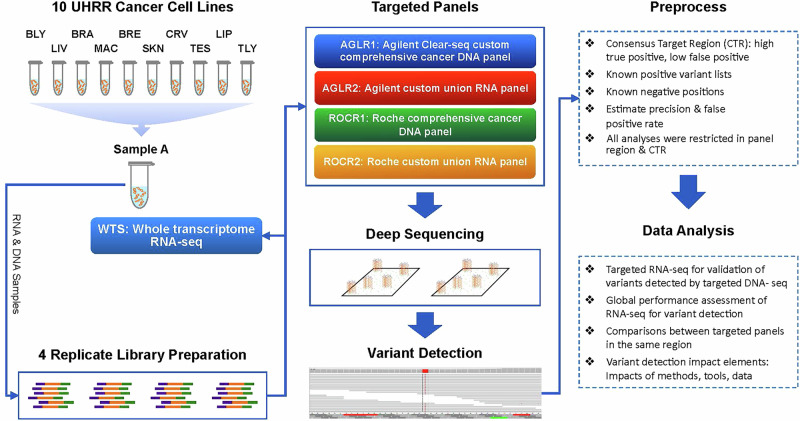
In precision medicine, DNA-based assays are currently necessary but not always sufficient for predicting therapeutic efficacy of cancer drugs based on the mutational findings in a patient's tumor specimen. Most drugs target proteins, but it is challenging and not yet cost-effective to perform high-throughput proteomics profiling, including mutational analysis, on cancer specimens. RNA may be an effective mediator for bridging the "DNA to protein divide" and provide more clarity and therapeutic predictability for precision oncology. While RNA sequencing (RNA-seq) has been increasingly used alongside DNA cancer mutation screening panels to assess the impact of variants on gene transcript expression and splicing, comprehensive evaluations of RNA panels and the integration of expressed mutation data analytics to supplement DNA panels are still limited. In this study, we conducted targeted RNA-seq on a reference sample set for expressed variant detection to explore its potential capability to complement DNA variant results or detect variants independently. The results indicated that, with a carefully controlled false positive rate ensuring high accuracy, RNA-seq uniquely identified variants with significant pathological relevance that were missed by DNA-seq, demonstrating its potential to uncover clinically actionable mutations. On the other hand, while some variants were detected by both approaches, others were missed by one or the other, reflecting either the nature of these variants or limitations of the bioinformatics tools used. Variants missed by RNA-seq are often not expressed or expressed at very low levels, suggesting they may be of lower clinical relevance. Incorporating RNA-seq into clinical biomarker panels will ultimately advance precision medicine and improve patient outcomes by improving the strength and reliability of somatic mutation findings for clinical diagnosis, prognosis and prediction of therapeutic efficacy.


Conflict of interest statement

Competing interests: The authors declare the following potential competing financial interests: Author N.N., A.B.L., and C.P.P. were employees of Agilent Technologies, Inc., but declares no non-financial competing interests. Authors D.L., J.L., D.J.J.Jr., D.B., G.C., J.F., B.G., W.J., D.P.K, R.K., P.L., C.E.M., C.M., B.P., T.A.R., R.M., S.M.E.S., A.S., H.U.T., J.C.W., P.R.B., and J.X. declare no financial or non-financial competing interests. UHRR is a commercial product of Agilent, and sample A DNA is a potential product of Agilent Technologies, Inc.

Figures

Fig. 1
Fig. 1. Study design.
Matched RNA and DNA reference samples were extracted and sequenced using four targeted panels, with library replicates for comprehensive comparison of variant detection against the known variants characterized in the DNA reference sample. The DNA reference sample was constructed by an equal mass mixture of the DNA samples extracted from the ten cancer cell lines used to make the RNA reference sample, i.e., Agilent Universal Human RNA Reference (UHRR) sample. Although AGLR1 and ROCR1 were originally designed as DNA panels, RNA was also captured after the reverse transcription to cDNA and sequenced using these panels to assess their applicability for variant detection. AGLR2 and ROCR2 were specially designed for comprehensive analysis. These research panel designs incorporated targets from eight established onco-panels and included additional gene sets considered of interest to the community, forming the basis of these custom union panels. See our data descriptor paper for details. In comparison, whole transcriptome RNA-seq (WTS) with poly(A) enrichment was also conducted for UHRR.
Fig. 2
Fig. 2. Using RNA-seq results to verify and prioritize DNA variants.
a The numbers of different types of calls reported by various panels without controlling the FPR. The “true set” was established in our previous study using the same reference samples. Variants not included in the “true set” were categorized as uncharacterized calls. The blue line represents verified true variants that are targeted and sequenced by the specific panels (AGLR or ROCR), meaning they fall within the regions targeted by the probes in the panels. b Comparison of expression levels between two groups of known positive variants: those detected and those missed by targeted RNA-seq across different panels. The number of reads (Y axis) was set to zero if a call was absent in the expression results. A Wilcoxon Rank Sum Test was applied, resulting in a significant p-value of 2.2e-16 for all panels. c Known positive variants missed by targeted RNA-seq data. Not-expressed: not detectably expressed. For example, it may be fairly expressed but the bait performance is poor. Low-VAF: calls were expressed but had a VAF < 2%, Low-DP: expressed calls with VAF ≥ 2% but had a DP < 20, Low-ADP: expressed calls with VAF ≥ 2% and DP ≥ 20, but ADP < 2 (=1). d Comparison of average recall values across panels, considering conditions with non-stringent cutoff versus where the FPR was reduced to 50 per million bases.
Fig. 3
Fig. 3. Independent variant detection using RNA-seq.
a The estimated FPR for each targeted panel and WTS results, restricted to panel regions. Various VAF cutoffs were applied for each panel and data type to achieve an FPR of 5. b Reproducibility measurements of targeted RNA-seq and WTS results, restricted in panel regions, after the FPR to 5 per million bases. c PPV estimates by panel (average), including WTS results within each panel region. The upper bound PPV was calculated by considering all unknown variants as true positives. Conversely, the lower bound PPV was obtained by treating all unknown variants as negatives. This approach provides a range of possible precision values, accounting for the uncertainty in RNA-unique variant classification. d Comparison of recall rates for targeted RNA-seq and WTS results after controlling the FPR to 5 per million bases. Recall is defined as the proportion of known positive variants successfully detected by each panel, highlighting performance differences across sequencing methods.
Fig. 4
Fig. 4. Comparison analysis of variant detection between AGLR2 and ROCR2 in the overlapping region (replicate 1 as an example).
a The number of variants detected in the overlapping region by AGLR2 and ROCR2 excluding known FP calls. b Comparison of the log2 variant depth (larger symbol sizes indicate lower variant position depths) and VAF for common variants shared between AGLR2 and ROCR2 in the overlapping region. c Distributions of total DP and VAF per variant category, comparing panel-unique and common variants to both. d Percentage of the four types of panel-unique variants explaining why the other panel missed them.
Fig. 5
Fig. 5. Impact of bioinformatics factors on variant detection.
a The number of variants detected in each individual library, including known positive, false positive, and uncharacterized calls, comparing single-library and merged-library approaches, with ROCR2 as an example. MR1 + 2 represents the library prepared by merging replicates 1 and 2 of ROCR2. b Comparison of the average number of calls detected by individual callers used in this study in AGLR2 and ROCR2 without and with controlling the FPR to 5 per million bases. c The average numbers of total and known positive calls detected by pipelines based on different aligners in each panel. The error bars represent the variability across four replicated libraries, calculated as the standard deviation of the data. d The number of variants (excluding FP calls) detected by different pipelines after controlling the FPR to 5 per million bases. An impressive number of variants were found to be aligner-specific or shared by two aligners across all panels.

References

    1. Lilyquist, J. et al. Common genetic variation and breast cancer risk—past, present, and future. Cancer Epidemiol. Biomark. Prev.27, 380–394 (2018). - PMC - PubMed
    1. Ko, Y.-A. et al. Genetic-variation-driven gene-expression changes highlight genes with important functions for kidney disease. Am. J. Hum. Genet.100, 940–953 (2017). - PMC - PubMed
    1. Zhang, Y. et al. Genetic variations in cancer-related significantly mutated genes and lung cancer susceptibility. Ann. Oncol.28, 1625–1630 (2017). - PMC - PubMed
    1. Ipe, J. et al. High-throughput assays to assess the functional impact of genetic variants: a road towards genomic-driven medicine. Clin. Transl. Sci.10, 67 (2017). - PMC - PubMed
    1. Wilkerson, M. D. et al. Integrated RNA and DNA sequencing improves mutation detection in low purity tumors. Nucleic Acids Res.42, e107–e107 (2014). - PMC - PubMed

LinkOut - more resources