. 2025 Jul;28(7):1418-1435.
doi: 10.1038/s41593-025-01973-8. Epub 2025 Jun 13.

Myelin-axon interface vulnerability in Alzheimer's disease revealed by subcellular proteomics and imaging of human and mouse brain

Affiliations

Myelin-axon interface vulnerability in Alzheimer's disease revealed by subcellular proteomics and imaging of human and mouse brain

Yifei Cai et al. Nat Neurosci. 2025 Jul.

Abstract

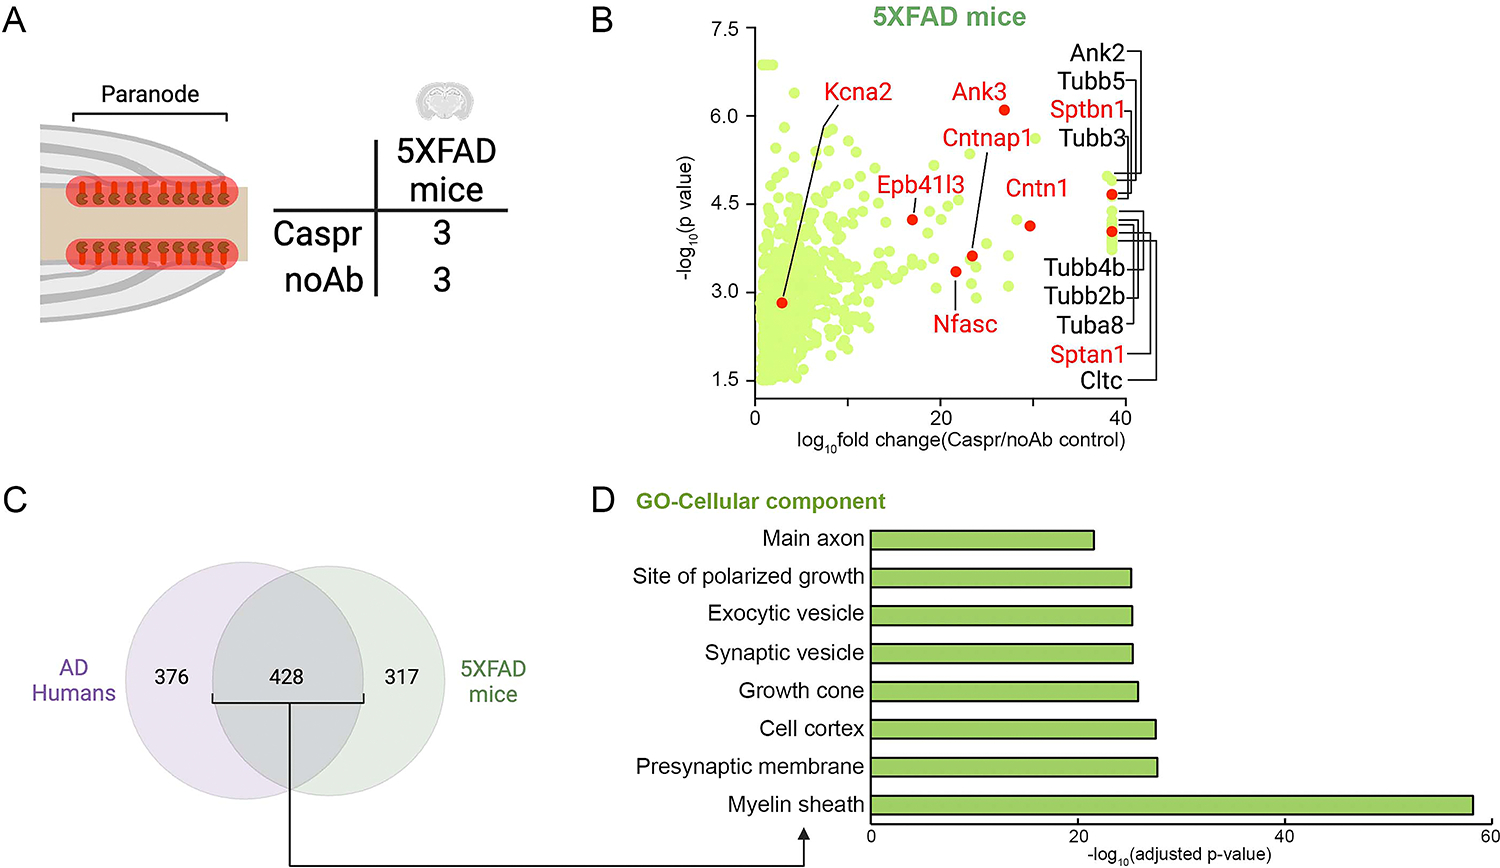
Myelin ensheathment is essential for rapid axonal conduction, metabolic support and neuronal plasticity. In Alzheimer's disease (AD), disruptions in myelin and axonal structures occur, although the underlying mechanisms remain unclear. We implemented proximity labeling subcellular proteomics of the myelin-axon interface in postmortem human brains from AD donors and 15-month-old male and female 5XFAD mice. We uncovered multiple dysregulated signaling pathways and ligand-receptor interactions, including those linked to amyloid-β processing, axonal outgrowth and lipid metabolism. Expansion microscopy confirmed the subcellular localization of top proteomic hits and revealed amyloid-β aggregation within the internodal periaxonal space and paranodal/juxtaparanodal channels. Although overall myelin coverage is preserved, we found reduced paranode density, aberrant myelination and altered paranode positioning around amyloid-plaque-associated dystrophic axons. These findings suggest that the myelin-axon interface is a critical site of protein aggregation and disrupted neuro-glial signaling in AD.


Conflict of interest statement

Competing interests: The authors declare no competing interests.

Figures

Extended Data Figure 1.
Extended Data Figure 1.. Expression of myelin marker proteins in AD versus controls from snRNAseq and bulk proteomics studies
Fold changes in myelin marker protein expression in human AD frontal cortex (including prefrontal cortex and frontal gyrus) were extracted from recent snRNA-seq and bulk proteomics datasets [11, 14, 16, 17]. RNA and protein expression levels in oligodendrocyte clusters are shown in the three left columns and two right columns, respectively. Abbreviation: n.s. = not significant, sig. = significant.
Extended Data Figure 2.
Extended Data Figure 2.. AI-guided myelin quantification in Cnp-EGFP-5XFAD and Cnp-EGFP-WT mice
A. Myelin in Cnp-EGFP-5XFAD mice and Cnp-EGFP-WT mice was quantified using AI-guided segmentation of immunofluorescence confocal images. B. Representative images showing tiled confocal images of brains from Cnp-EGFP-WT and Cnp-EGFP-5XFAD mice. Myelin (grey) was labeled by anti-GFP, and lysosomes/dystrophic neurites (red) were labeled by anti-Lamp1. Brain regions used for quantification are marked by yellow boxes. Low zoom and high zoom representative images with myelin (anti-GFP), AI-generated masks and objects. Scale bars: full-tiled images = 500 μm; low zoom myelin images = 100 μm; high zoom images = 5 μm. C. Quantification of myelin volume and mean fluorescence intensity in regions of interest for Cnp-EGFP-5XFAD mice (n = 4) and Cnp-EGFP-WT mice (n = 5); (Mann Whitney test, two-tailed). Abbreviations: RSPd = Retrosplenial area, dorsal part; PTLp = Posterior parietal association areas; DG = dentate gyrus. Error bars indicate SEM.
Extended Data Figure 3.
Extended Data Figure 3.. Super-resolution STED microscopy demonstrates spatial precision of proximity labeling
A. Bead imaging illustrates the resolution difference between confocal microscopy (250 nm) and STED microscopy (50 nm). Scale bar = 250 nm. B-C. Representative confocal and STED images of proximity labeling in human postmortem brains showing (B) paranodes (anti-CASPR, magenta) and (C) internodes (anti-MAG, magenta), with biotinylated proteins detected by streptavidin (green); scale bars: (B) 500 nm, (C) 5 μm. D. A representative line plot shows the radius measurements of signals from the secondary antibody channel (magenta) and the streptavidin channel (green). E. A dot plot showing the radius ratio between the secondary antibody (magenta) and streptavidin (green). The average radius ratio is 1.07 (SD= 0.1); the orange line indicates the median, with the lower and upper edges representing the 25th (Q1) and 75th (Q3) percentiles. Whiskers extend to the minimum and maximum values within 1.5 times the interquartile range, and outliers (pink circles) are plotted individually (and excluded from analysis). Each dot represents a myelin segment (n = 45).
Extended Data Figure 4.
Extended Data Figure 4.. Correlation analysis of proteomics samples in humans and mice
Correlation analysis for biological replicates of (A) MAG-labeled and (B) CASPR-labeled samples, along with the no-antibody labeled proteomic controls in (A-B) human brains and (C) in mice. Pearson correlation coefficient (R2) values are provided in each comparison box.
Extended Data Figure 5.
Extended Data Figure 5.. Caspr-labeled paranode-enriched proteomes in 5XFAD mice
A. Schematic illustrating the experimental design. B. Partial volcano plot of proteomic hits in paranode-enriched samples from 5XFAD mice. Known paranode-related hits are shown in red and other hits in green. The gene names of the top 10 proteomic hits and known paranodal proteins are indicated. C. Venn diagram showing the number of paranode-enriched proteomic hits shared between AD humans and 5XFAD mice. D. Gene Ontology cellular component (GO-CC) analysis of the shared hits between AD humans and mice, displaying the top 8 GO-CC terms. Quantifications in panels B and D were performed two-sided.
Extended Data Figure 6.
Extended Data Figure 6.. Top 100 hits in the CASPR-labeled paranode-enriched proteome and MAG-labeled myelin-axon interface proteome in unaffected human brains
(A) The top 100 proteomic hits identified in the paranode-enriched proteome. Proteins known to be expressed in the paranode are marked with an asterisk (“*”): SPTAN1 [124], SPTBN1 [125, 126], CNTN1 [127, 128], CNTNAP1 [35], ANK3 [21, 129], NFASC [130], and SCN2A [131]. Proteins known to be expressed in the node of Ranvier and juxtaparanode are marked with a hash (“#”): TNR [1], ACTN4 [132], SPTBN4 [1], VCAN [1], NCAM1 [133], CNTNAP2 [130], SPTB [134], CNTN2 [1], HAPLN2 [1], NCAN [1], EPB41L2 [1]. (B) The top 100 proteomic hits identified in the myelin-axon-interface proteome. Proteins known to be expressed at the myelin-axon interface are marked with an asterisk (“*”): CNP [135], CNTN1 [127, 128], CNTNAP1 [35], NFASC [130], NCAM1 [133], MOG [135], MAG [–38], SEPTIN7 [136], NRCAM [137], CNTN2 [–38], PLP1 [20], CNTNAP2 [1], LGI3 [138], SEPTIN8 [139], CADM4 [20, 140], ADAM22 [138], SEPTIN2 [139, 141], SEPTIN4 [139]. Proteins known to be related to myelin or axon are marked with a hash (“#”): DPYSL2 [142], INA1 [143], IGSF8 [144, 145], STX1B [146], BIN1 [147], SNAP25 [148], NCAM2 [149], NDRG1 [150, 151], CRMP1 [152], BCAS1 [153], KCNAB2 [154], LGI1 [155], MAPT [156], GPM6A [157], CAP1 [158], PLEKHB1 [159].
Extended Data Figure 7.
Extended Data Figure 7.. Integrative pathway enrichment analysis of paranode and myelin-axon interface proteomes using the ActivePathways method
(A-B) The Enrichment Map depicts a network of pathways (FDR < 0.05) where edges connect pathways sharing many genes. Node size reflects the number of genes in each pathway, and node color indicates the dataset contribution (combined AD and control). Theme labels were curated based on the main pathways represented in each subnetwork. Only subnetworks with at least four pathways connected by edges are shown. Grey nodes indicate combined evidence of pathway enrichment in which the respective pathways were detected in the integrative analysis but not detected in either the AD or Control proteomes alone.
Extended Data Figure 8.
Extended Data Figure 8.. Cell-cell communication analysis revealing ligand-receptor interaction at the myelin-axon interface
A-B. (A) Cell clustering and (B) cell type annotation of snRNAseq data from AD human frontal cortex (Braak stage 6) and controls (Braak stage 0). C. Enrichment analysis shows that myelin-axon interface proteomics (MAG or CASPR-labeled) are highly enriched in neurons and oligodendrocytes, but not in other cell types (related to Figure 5B). Each row depicts contingency tables for each hypergeometric test (from top to bottom: p-values: 0.0005275, 0.0007784, 0.009328, 0.0001295). In these rows, values with two decimal places indicate residuals and the size of the circles; positive residuals denote that the observed values were more frequent than expected, while negative residuals indicate lower-than-expected frequencies. Quantifications were performed two-sided. D-E. Violin plots showing RNA expression levesl of ligand-receptor pairs in (D) control human postmortem brains (Braak stage 0) and (E) AD human postmortem brains (Braak stage 6).
Extended Data Figure 9.
Extended Data Figure 9.. Paranode-enriched and myelin-axon interface Alzheimer’s disease proteomes reveal unique subcellular changes not observed by bulk proteomics or single cell RNA transcriptomics
Heatmaps display (A) Paranode Alzheimer’s-associated proteomes (PAPs) and (B) Myelin-axon interface Alzheimer’s proteomes (MAPs). Heatmap denotes log10 (spectral counts). Comparison between PAPs or MAPs and bulk proteomics data (middle panel, Johnson et al., 2022 [16]), or single nuclei RNA sequencing transcriptomics (right panels, Mathys et al., 2019 [11]) were performed. Both bulk proteomics and snRNAseq data were obtained from their original studies. Neuronal cell types (yellow box) and oligodendrocyte/OPC (green box) were highlighted in the snRNAseq data. Abbreviations: FC = fold change; DEG = differentially expressed genes. (A and B) Quantifications of subcellular proteomic data derived from this study were performed two-sided.
Extended Data Figure 10.
Extended Data Figure 10.. Diagram of myelin-axon disruption in AD
A. Diagram illustrating how amyloid toxicity to axons and myelin (#1 and #2) may lead to axonal spheroid formation (a), myelin paranode/juxtaparanode disruption (b), protein perturbation at the myelin-axon interface (c) and amyloid accumulation at the interface (d). Together, these events may create a vicious cycle of dysregulated myelin-axon crosstalk and degeneration (#3). B. Diagram outlining potential signaling pathways that contribute to myelin-axon disruption, based on findings from myelin-axon interface proteomics and imaging validations.
Figure 1.
Figure 1.. AI-guided confocal imaging analysis revealed myelin paranode pathology in AD human postmortem brains
A. Workflow for paranodes, myelin and axons analysis in human postmortem brains. B. Immunofluorescence labeling of myelin (PLP1, grey) in AD human brains and age-matched controls. Scale bar = 200 μm. C. Raw immunofluorescence staining of myelin (PLP1, grey), and AI-generated masks (yellow) and myelin objects (blue). D-E. Quantification of (D) normalized myelin volume and (E) mean grey intensity comparing AD human brains (n = 6) to controls (n = 9). Mann Whitney test. F. Immunofluorescence of axons (SMI312, green) in AD brains and controls. Scale bar = 200 μm. G. Raw immunofluorescence of axons (SMI312, green), and AI-generated masks (yellow) and axon objects (blue). H-I. Quantification of (H) normalized axon volume and (I) mean grey intensity comparing AD brains (n = 7) versus controls (n = 6). Mann Whitney test. J. Raw immunofluorescence of paranodes (CASPR, green) in AD brains and controls. Scale bar=50 μm. Raw paranode staining (CASPR, green) and AI-generated mask (yellow) and paranode objects (blue). K and L. Quantification of paranodes in AD brains (n = 10) and controls (n = 8). Paranodes were binned into 3 categories according to their length: 0–5 μm, 5–10 μm and > 10 μm. (K) To compare paranode density between human AD versus control, unpaired t-test (two-tailed) was performed: “0–5 μm”: p-value = 0.002; “5–10 μm”: p-value = 0.008; “10+”: p-value = 0.711 (n.s.). To compare the number of paranodes in human AD or control, respectively, one-way ANOVA was performed. In human controls, the number of paranodes of “0–5 μm” v.s. “5–10 μm” (p-value = 0.043), and “0–5” v.s. “10+” (p-value < 0.0001), “5–10 μm” v.s. “10+” (p-value < 0.0001). In human AD, “0–5” v.s. “5–10 μm” (p-value = 0.896), “0–5” v.s. “10+” (p-value < 0.0001), “5–10 μm” v.s. “10+” (p-value < 0.0001). (L) To compare the fluorescence intensity of paranode labeling between human AD versus control, unpaired t-test (two-tailed) was performed: “0–5 μm”: p-value = 0.103; “5–10 μm”: p-value = 0.272; “10+”: p-value = 0.743. M. Paranode labeling (green, CASPR labeled) in human AD and controls. Scale bar 5 μm. N. Abnormal separation of paranode (grey, CAPSR labeled) compared to normal paranode in AD human brains. Scale bar 5 μm. O. Quantile-quantile (Q-Q) plot shows comparison of paranode size (volume) between human AD versus control, Welch t-test (two-tailed) was performed. P-R. Quantification of myelin density in Cnp-EGFP-5XFAD mice (n = 4) and control (n = 5). (Q) Normalized myelin volume and (R) mean grey intensity. Mann Whitney test was performed. Error bars indicated SEM and quantifications were performed two-sided in all experiments.
Figure 2.
Figure 2.. Proximity labeling of paranodes and the myelin-axon interface in AD human brains and mice
A. Schematic of the proximity labeling pipeline showing biotinylation of paranode-enriched (anti-CASPR) and myelin-axon interface (anti-MAG) proteins in human postmortem brains and mice. Postmortem human frontal cortex (highlighted in pink) was used. B-C. Representative confocal images of proximity labeling for (B) paranodes and (C) myelin-axon interface. Biotinylated proteins are visualized by streptavidin (grey). Controls without H2O2 biotin-Tyramide, or antibody showed no streptavidin signal. Scale bar = 5 μm. D-E. Western blots showing detection of the bait proteins: (D) CASPR and (E) MAG, as well as the pulled-down biotinylated proteins revealed by streptavidin-HRP. CASPR and MAG were not detected in the no-antibody controls (D-E), or in the no-biotinylation control (E).
Figure 3.
Figure 3.. Subcellular paranode proteomics in AD human postmortem brains and mice
A. Schematic of the proximity labeling proteomics pipeline for paranodes in AD postmortem brains and 5XFAD mice. B. Protein detection and statistical cutoff in human AD, controls and 5XFAD mice. C. Receiver operating characteristic (ROC) curves for human AD, controls and 5XFAD mice. Proteins were ranked by fold change relative to no-antibody controls. True positives denote paranode-related proteins, while false positives include nuclear, mitochondrial and other non-paranode-related proteins. The ROC curve Wilson/Brown test showed P < 0.0001 for all groups. D. Venn diagram showing shared and unique proteomic hits among AD humans, controls, and 5XFAD mice datasets. E-F. Volcano plots of (E) paranode-enriched proteomics and (F) myelin-axon interface proteomics in AD humans versus unaffected controls. The gene names of the top 10 hits with greatest fold changes are labeled. In (E), known paranode proteomic hits are highlighted in red, and in (F), known myelin or myelin-axon interface proteins are highlighted in blue. Quantifications in panels B, C, E and F were performed two-sided. G. Venn diagrams comparing paranode-enriched proteomes (CASPR-labeled) with myelin-axon interface proteomes (MAG-labeled) in unaffected human controls. Selected known paranode proteins are shown in red, while known myelin paranode proteins are shown in blue. H. Venn diagrams comparing human control myelin-axon interface proteomes (MAG-labeled) with a previously published human myelin (white matter) proteome, highlighting selected unique and shared proteomics hits.
Figure 4.
Figure 4.. Myelin-axon interface proteome reveals protein abnormalities in AD postmortem brains
A-B. Bar charts showing major themes from pathway enrichment analysis using the ActivePathways method, in (A) paranode proteomes and (B) myelin-axon interface proteomes. Bar length represents the number of pathways identified in each theme, with colors indicating FDR values. The names of each bar are curated based on the main pathways of each subnetwork. Pie charts indicate the number of pathways in AD versus control datasets within each subnetwork. Themes related to (A) paranode, myelin, axon and amyloid beta, as well as (B) metabolism and myelin-axon are highlighted in red, blue and magenta. C-D. Scatter plots of (C) paranode-enriched proteomics and (D) myelin-axon interface proteomics in AD human brains, ranked by the ratio of anti-bait protein samples versus no-antibody controls. The gene names of the top proteomic hits are labeled; novel top hits were further examined by immunofluorescence expansion microscopy (see Figure 6). E. Schematic outlining the statistical pipeline used to compare CASPR-labeled or MAG-labeled proteomes between AD human brains and unaffected controls (quantifications were performed two-sided). F-G. Scatter plots showing (F) PAP (paranode-Alzheimer’s proteome) and (G) MAP (myelin–axon interface Alzheimer’s proteome) hits that are up- or down-regulated in AD compared to controls. Gene names of the top novel hits examined by expansion microscopy are shown (see Figure 6). H. Enrichment map of pathways and processes for differentially expressed PAP and MAP proteins. The network indicates pathways as nodes connected by edges and grouped into subnetwork themes if the pathways share many genes. I. IPA pathway analysis showing the top 10 central nervous system-related signaling pathways enriched in PAP and MAP.
Figure 5.
Figure 5.. Cell-cell communication analysis reveals potential AD-associated ligand-receptor interactions at the myelin-axon interface
A. Workflow of a novel cell-cell communication (CCC) analysis pipeline that integrates subcellular proteomics with snRNAseq data to reveal ligand-receptor interactions at the myelin-axon interface in AD human brains and controls. B. Intersection of proteins from subcellular proteomics (paranode proteomics or myelin-axon interface proteomics) with neuron-oligodendrocyte CCC proteins. C. Subcellular proteomics informed ligand-receptor pairs at the myelin-axon interface. Source and target cell types indicate the cells expressing the ligand or receptor. Pairs unique to AD are shown in purple; pairs in both AD and controls in brown and pairs unique to controls in pink. D. Examples of ligand-receptor pairs at the myelin-axon interface, with cell-type-specific RNA expression of each gene retrieved from the snRNAseq dataset [12]. E. Schematic of selected ligand-receptor pairs at the myelin-axon interface: known pairs in blue, predicted pairs in yellow, and predicted pairs detected only in AD in red (full list in Supplementary Table S4). F. Workflow for predicting downstream signaling influenced by the ligand-receptor interactions. G. Predicted downstream biological processes induced by ligand-receptor interactions at the myelin-axon interface in AD and controls.
Figure 6.
Figure 6.. Expansion microscopy demonstrates expression of proteomic hits at the myelin-axon interface
A. Schematic of the expansion microscopy (ExM) pipeline applied to AD human frontal cortex. B-C. Pie charts showing that (B) all 12 tested proteomics hits were detected at the myelin-axon interface, and (C) among these, 6 had high expression, 5 medium and 1 low. D. ExM showing Transferrin (TF, green) with high expression at the paranode in AD brain (myelin (PLP and MBP, grey) and axon (NFH, red)); inset (d’) shows a coronal view of TF (green) within a myelin sheath (grey). E. ExM showing ATP8A1 (green) with medium expression at the paranode and along the internode. Myelin (PLP and MBP, grey) and axons (NFH, red). ATP8A1 was also detected on unmyelinated axons (red). F. ExM image showing ALCAM (green), a top hit from the MAG-labeled proteome in AD, with high expression within the myelin sheath (grey). G-H. ExM images of top PAP proteomic hits in AD: (G) HYOU1 (green) with medium and (H) ACSL4 (green) with high expression within myelin sheaths (PLP and MBP, grey). I-J. ExM images of top MAP proteomic hits in AD: (I) HAPLN1 (green) with high expression in myelin (grey) and (J) NUDCD3 (green), with high expression in the axons. J-K. (J) Representative ExM images showing NUDCD3 (green) in AD and controls within myelin and axons. (K) Quantification shows significantly higher NUDCD3 expression in AD compared to controls (n = 3 brains per group; unpaired t test, p = 0.0463). Error bars indicate SEM; quantification was two-sided. Scale bars: 10 μm.
Figure 7.
Figure 7.. Expansion microscopy reveals amyloid deposition at the paranode
A. Schematic of the expansion microscopy (ExM) pipeline in AD-model mice. B. ExM image showing amyloid fibers (4G8, red) forming spirals along axons (Thy1-YFP, green) in Thy1-YFP-5XFAD mice. Inset (b’) showing enlarged view of individual channels. C. ExM image showing amyloid fibers (4G8, red) that terminate in paired helical coils along axons (Thy1-YFP, green). Inset (c’) show enlarged view of each channel. D. ExM image showing a helical amyloid coil (4G8, red) at a myelin paranode (Caspr, green). Inset (d’) showing enlarged view of each channel. Inset (d”): sagittal view showing the amyloid fiber wrapped around the Caspr positive axon (green). E. ExM image showing an amyloid spiral (4G8, red) along a myelinated axon (CNPase, green). F. Quantification of the percentage of axons with amyloid spirals and coils in 5XFAD mice (n = 4; unpaired t-test; error bas=SEM. G. Confocal image showing an amyloid spiral and coil (4G8, red) along an axon (NFH, green) associated with paranodes (yellow arrowheads) and juxtaparanodes (blue arrowheads) (CASPR and Kv7.3, grey). H and h’. ExM images showing that amyloid paranodal coils (4G8, red) are sometimes associated with enlarged axons (SMI34, green). Scale bar (B-E and H) = 5 μm and (G)=10 μm. I. Schematic summarizing the association of amyloid fibers at the internode (#1) and the paranode and juxtaparanode (#2) of myelinated axons, as revealed by ExM.
Figure 8.
Figure 8.. Myelin paranode abnormalities associated with axonal pathology in AD humans and mice
A. Axonal spheroids (green) form around amyloid plaques (red) and are associated with markedly delayed or blocked axonal electric conduction [80]. B. Myelin (green) wraps around an axonal spheroid in AD brain. Scale bar= 1 μm. C. In 5XFAD mice, myelin (Plp, grey) wraps around axonal spheroids (Lamp1, red); neurofilament (SMI312, green) and amyloid plaque (ThioS, blue) are also shown. Scale bar= 5 μm. D. Myelinated axonal spheroids are significantly larger than unmyelinated ones (paired t-test (parametric, two-tailed), p< 0.008, n = 3). E-F. Myelin (green) wraps around axonal spheroids (Lamp1, red) in (E) Cnp-EGFP-5XFAD mice and (F) AD human brain (PLP1). Paranode (Caspr, grey) is associated with spheroids in both humans and mice. Amyloid plaque (ThioS, blue). Scale bar=5 μm. G. Approximately 80% of myelinated axonal spheroids (PAAS) are Caspr positive (n = 3). H. Comparison of Caspr-positive versus negative spheroid area in 5XFAD mice (Caspr-positive = 9.477, Caspr-negative = 90.523, SD = 1.801, n = 3) and AD humans (Caspr-positive = 11.20, Caspr-negative = 88.80, SD = 7.405, n = 3). I. Less than 3% of total paranodes are associated with spheroids in AD humans (n = 3). J-L. Images showing intrusion of CASPR-positive paranodes into axonal spheroids (red) in (J) AD human brains and (K-L) mice. (L’) Intruded myelin (green) is associated with paranodal marker CAPSR (red) and juxtaparanodal marker Kv 1.2 (grey). (J-L) Scale bar=5 μm. M. Myelin (green) wraps around several spheroids (red) to form a large, myelinated spheroid cluster (related to Supplementary Figure S13A). Scale bar=5 μm. (M’) Inset (blue box) shows a pair of paranodes (green) on a myelinated axonal spheroid (M): one half of the paranode (red arrow) is severely disrupted while the other half (blue arrow) remains intact; axonal cytoskeleton (yellow) extends into the spheroid. (M”) Schematic of aberrant myelination of axonal spheroids. N. Newly formed oligodendrocyte (BCAS1-positive, grey; a large blue arrowhead indicates the cell body) myelinate spheroids (LAMP1, red, small blue arrowheads) in CNP-mEGFP-5XFAD mice; mature myelin is labeled by CNP-mEGFP (green). O and o’. One large spheroid (LAMP1, red) is myelinated by mature myelin (CNP-positive, green, blue asterisk), while BCAS1-positive newly formed myelin wraps around an adjacent spheroid (LAMP1, red, yellow asterisk) and partially covers the CNP positive spheroid (blue asterisk) as well as a small spheroid (LAMP1, red, blue arrowhead). Scale bars (N) 10 μm; (O) 5 μm. P. Comparison of the proportion of BCAS1-positive versus CNP-positive spheroid area in 5XFAD mice (n = 4; unpaired t-test). Q. Comparison of spheroid size as a function of BCAS1-positive versus CNP-positive myelin coverage in 5XFAD mice (n = 4; unpaired t-test). Error bars indicate SEM; all quantifications were two-sided.

References

    1. Lubetzki C, Sol-Foulon N, and Desmazieres A, Nodes of Ranvier during development and repair in the CNS. Nat Rev Neurol, 2020. 16(8): p. 426–439. - PubMed
    1. Nave KA and Werner HB, Ensheathment and Myelination of Axons: Evolution of Glial Functions. Annu Rev Neurosci, 2021. 44: p. 197–219. - PubMed
    1. Monje M, Myelin Plasticity and Nervous System Function. Annu Rev Neurosci, 2018. 41: p. 61–76. - PubMed
    1. Hill RA, Li AM, and Grutzendler J, Lifelong cortical myelin plasticity and age-related degeneration in the live mammalian brain. Nat Neurosci, 2018. 21(5): p. 683–695. - PMC - PubMed
    1. McKenzie IA, et al. , Motor skill learning requires active central myelination. Science, 2014. 346(6207): p. 318–22. - PMC - PubMed

Methods-only references

    1. Oakley H, et al. , Intraneuronal beta-amyloid aggregates, neurodegeneration, and neuron loss in transgenic mice with five familial Alzheimer’s disease mutations: potential factors in amyloid plaque formation. J Neurosci, 2006. 26(40): p. 10129–40. - PMC - PubMed
    1. Feng G, et al. , Imaging neuronal subsets in transgenic mice expressing multiple spectral variants of GFP. Neuron, 2000. 28(1): p. 41–51. - PubMed
    1. Harris MA, et al. , The Gene Ontology (GO) database and informatics resource. Nucleic Acids Res, 2004. 32(Database issue): p. D258–61. - PMC - PubMed
    1. Dhaunchak AS, et al. , A proteome map of axoglial specializations isolated and purified from human central nervous system. Glia, 2010. 58(16): p. 1949–60. - PubMed
    1. Binder JX, et al. , COMPARTMENTS: unification and visualization of protein subcellular localization evidence. Database (Oxford), 2014. 2014: p. bau012. - PMC - PubMed

Extended Data Figure Reference

    1. Voas MG, et al. , alphaII-spectrin is essential for assembly of the nodes of Ranvier in myelinated axons. Curr Biol, 2007. 17(6): p. 562–8. - PubMed
    1. Zhang C, et al. , Membrane domain organization of myelinated axons requires betaII spectrin. J Cell Biol, 2013. 203(3): p. 437–43. - PMC - PubMed
    1. Susuki K, et al. , Glial betaII Spectrin Contributes to Paranode Formation and Maintenance. J Neurosci, 2018. 38(27): p. 6063–6075. - PMC - PubMed
    1. Colakoglu G, et al. , Contactin-1 regulates myelination and nodal/paranodal domain organization in the central nervous system. Proc Natl Acad Sci U S A, 2014. 111(3): p. E394–403. - PMC - PubMed
    1. Boyle ME, et al. , Contactin orchestrates assembly of the septate-like junctions at the paranode in myelinated peripheral nerve. Neuron, 2001. 30(2): p. 385–97. - PubMed

MeSH terms

Substances

LinkOut - more resources