. 2025 Jun 13;23(1):282.
doi: 10.1186/s12964-025-02291-z.

Proteomic analysis of hydrogen peroxide-treated human chondrocytes shows endoplasmic reticulum stress, cytoskeleton remodeling, and altered secretome composition

Affiliations

Proteomic analysis of hydrogen peroxide-treated human chondrocytes shows endoplasmic reticulum stress, cytoskeleton remodeling, and altered secretome composition

Thais Mingatos de Toledo et al. Cell Commun Signal. .

Abstract

Background: Chondrocyte homeostasis is vital for maintaining the extracellular matrix (ECM) and overall cartilage health. In osteoarthritis (OA), for example, oxidative stress resulting from redox imbalances can disrupt chondrocyte homeostasis, leading to cartilage degradation. Hydrogen peroxide (H2O2), a reactive oxygen species (ROS), is a key mediator of oxidative stress and contributes to chondrocyte apoptosis and ECM degradation. Previous studies have explored individual protein responses to oxidative stress; however, a comprehensive proteomic analysis in chondrocytes has not been conducted. In this study, we aimed to assess the global proteomic alterations in chondrocytes exposed to H2O2 using a shotgun proteomics approach, which enables the detection of a broad spectrum of proteomic changes.

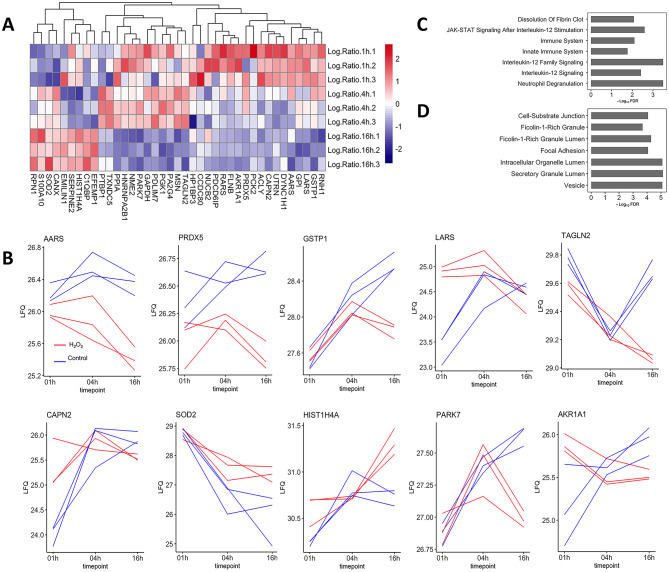
Methods: Chondrocytes were treated with H2O2 for 1, 4, and 16 h followed by protein extraction and processing, including denaturation, alkylation, and trypsin digestion. The peptides were then acidified, desalted, dried, and resuspended for LC-MS/MS. Proteomics data were analyzed using MaxQuant software to identify and quantify proteins. Secretome analysis was performed to examine protein secretion changes under oxidative stress. The statistical significance of all proteomics and secretome data was assessed using a two-tailed Student's t-test with a permutation-based FDR and an S0 parameter of 0.1 in the Perseus software. Other methods, including quantitative PCR, western blotting, and immunofluorescence, were employed to complement the proteomic analysis.

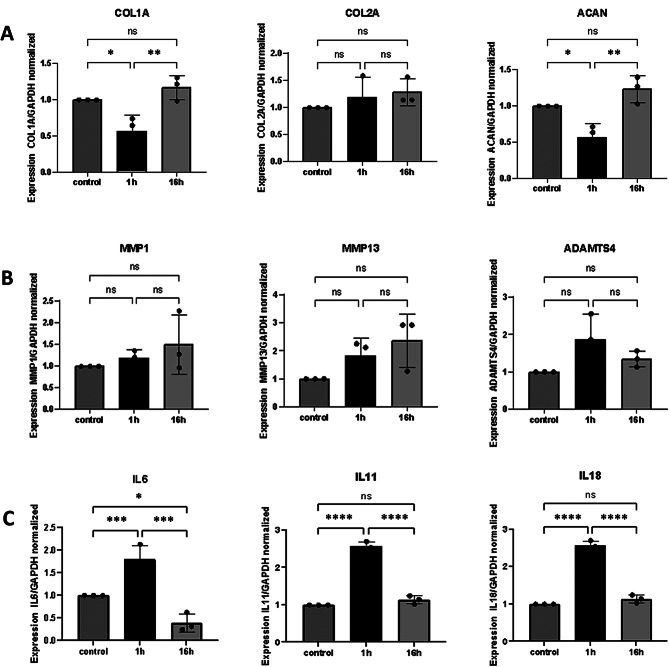
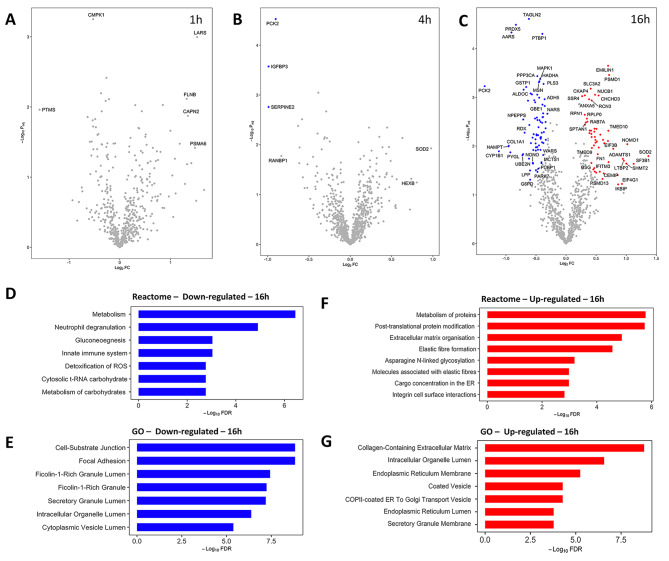
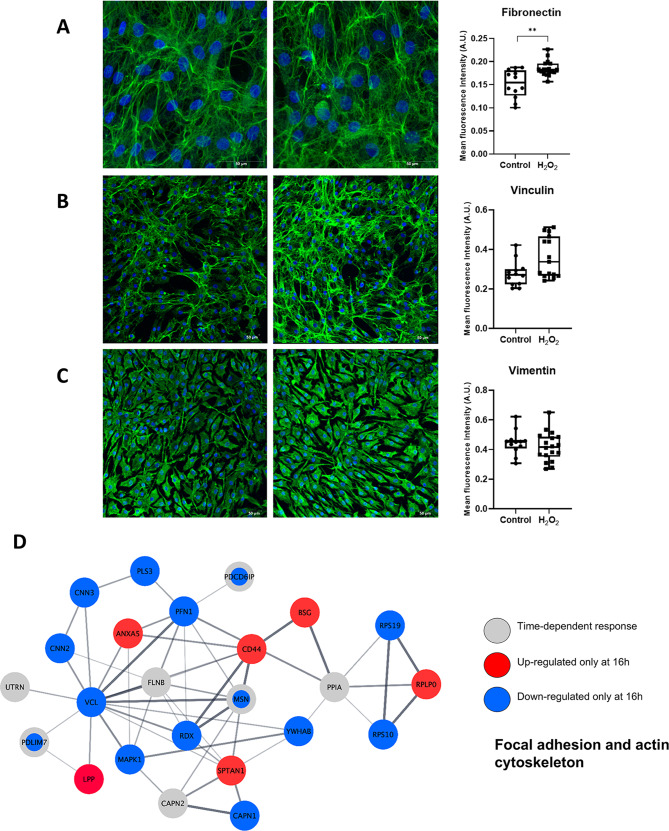
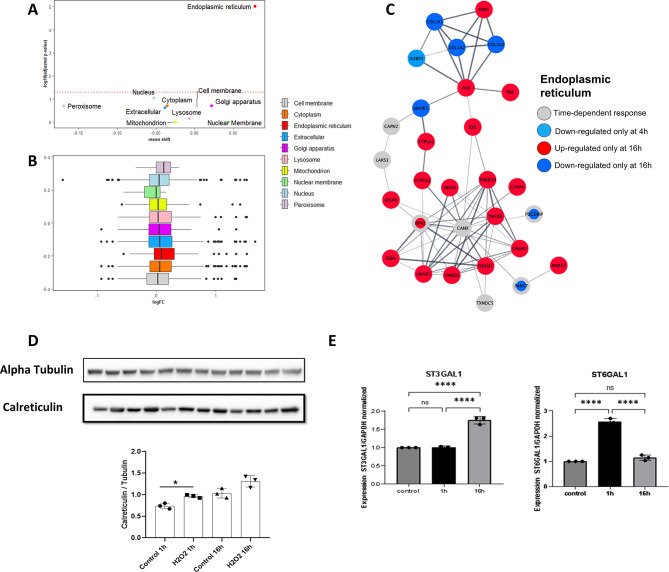
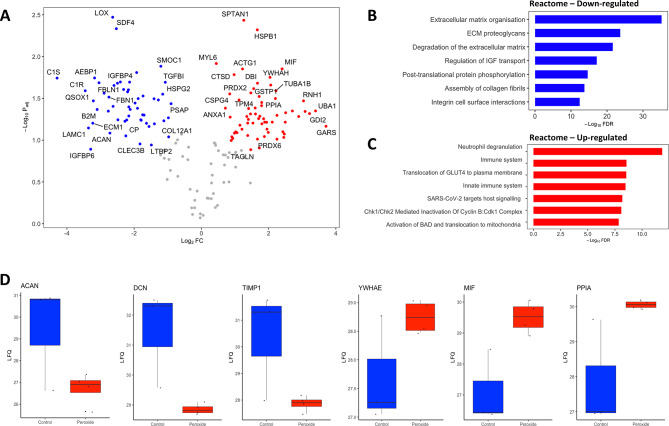
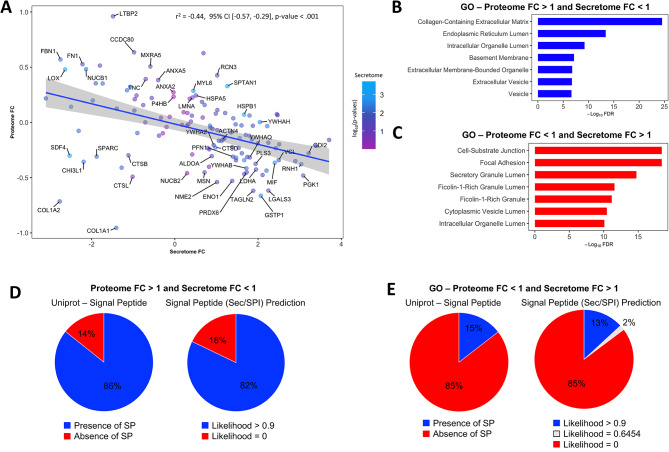
Results: Our findings revealed that oxidative stress primarily affected the endoplasmic reticulum (ER), causing notable alterations in the expression of ER-associated proteins, redox-responsive enzymes, chaperones, and sialyltransferases. These changes increased intracellular accumulation of ECM proteins and decreased secretion into the extracellular environment, indicating impaired protein trafficking and secretion. Additionally, immune-related pathways were activated in the long term, with a short-term upregulation of inflammatory markers, such as interleukin (IL)-6 and IL-18, although the levels of matrix metalloproteinases (MMPs) remained stable, indicating that not only complex inflammatory stimuli, but also oxidative stress responses can disrupt ECM homeostasis.

Conclusions: Our study demonstrates a detailed proteomic view of the stress response of H2O2-treated chondrocytes, highlighting the significant changes in ER function, cytoskeletal remodeling, protein secretion, and immune responses. These changes suggest that oxidative stress impacts ECM balance and can contribute to cartilage disorders, such as OA, through different mechanisms than what is usually observed with inflammatory stimulus, offering new insights into the molecular mechanisms underlying oxidative stress in chondrocytes.


Conflict of interest statement

Declarations. Ethics approval and consent to participate: Not applicable. Consent for publication: Not applicable. Competing interests: The authors declare no competing interests.

Figures

Fig. 1
Fig. 1
Time-dependent alterations in protein abundance triggered by 100 µM of hydrogen peroxide in human chondrocytes. A. Hierarchical clustering of time-dependent alterations (p-value < 0.05) in NHAC-Kn cells after exposure to hydrogen peroxide (n = 3). The color gradient represents z-scored fold changes and columns represent replicates of the different time points. B and C. Enrichment analysis based on Reactome and Gene Ontology (GO; Cellular Component) terms, respectively, for the differentially modulated proteins displayed in the hierarchical clustering analysis. The bar plot shows the 7 most enriched Reactome pathways and GO terms and their respective FDRs. D. Line plots of the log2 LFQ intensities of proteins showing time-dependent alterations in treated samples relative to controls (n = 3, top 10 proteins with the lowest p-values). LFQ, label-free quantification
Fig. 2
Fig. 2
Gene expression analysis in chondrocyte monolayer cells stimulated by H2O2 using quantitative real-time PCR (qPCR). A, B, and C. Bar plot shows a differential expression of ECM genes, including collagen (COL1A and COL2A), aggrecan (ACAN), matrix metalloproteinase (MMP1, MMP13, and ADMTS4), and cytokines (IL6, IL11, and IL18). GAPDH was used as an endogenous control. Data are expressed as the mean ± SD from three independent experiments; * p < 0.05, compared with the control group (without stimulation by H2O2)
Fig. 3
Fig. 3
Time point-specific changes in protein levels triggered by hydrogen peroxide in human chondrocytes. A, B, and C. Volcano plots showing differentially abundant proteins in NHAC-Kn cells after treatment with 100 µM of hydrogen peroxide for 1, 4, and 16 h, respectively (ncontrol = 3, nH2O2 = 5). Significantly up- and downregulated proteins are highlighted in red and blue, respectively. Significance was defined by Perseus software with an FDR value of 0.05 and S0 = 0.1. Labels displaying gene names are shown for proteins with the highest fold changes. D and E. Enrichment analysis based on Reactome and GO (Cellular Component) terms, respectively, for the down-regulated proteins 16 h post-exposure to hydrogen peroxide. The bar plot shows the 7 most enriched Reactome pathways and GO components, as well as their respective FDRs. F and G. Enrichment analysis based on Reactome and GO (Cellular Component) terms for the up-regulated proteins 16 h post-exposure to hydrogen peroxide. The bar plot shows the 7 most enriched Reactome pathways and GO components, as well as their respective FDRs
Fig. 4
Fig. 4
Hydrogen peroxide contributes to cytoskeleton remodeling in human chondrocytes. Immunofluorescence of chondrocytes was used to visualize morphology aspects after H2O2 treatment. A. Image of chondrocytes stained with DNA probe DAPI to visualize nuclei (blue) and Alexa fluor 488 secondary antibody to visualize Fibronectin (green). Scale bar 100 μm. B. Image of chondrocytes stained with DNA probe DAPI to visualize nuclei (blue) and Alexa fluor 488 secondary antibody to visualize Vinculin (green). Scale bar 100 μm. C. Image of chondrocytes stained with DNA probe DAPI to visualize nuclei (blue) and Alexa fluor 488 secondary antibody to visualize Vimentin (green). Scale bar 100 μm. D. String network displaying protein-protein interactions between cytoskeleton proteins with altered fold changes across time or differential abundance between biological conditions at specific time points. The selection of cytoskeleton and cell adhesion proteins was based on GO annotation
Fig. 5
Fig. 5
Hydrogen peroxide leads to ER stress in human chondrocytes. (A) Compartment-specific proteomic analysis of the log2 fold changes in hydrogen peroxide-treated NHAC-Kn cells relative to controls. Proteins were assigned to their respective compartments according to GO-terms and each compartment was tested for difference against the whole proteome (Wilcoxon rank sum test with 5% FDR correction). The y-axis displays − log10Adjusted p-value and the x-axis shows the mean log2 fold change shift. (B) Box plots showing the distributions of fold changes across different subcellular compartments. The fold changes were utilized for the compartment-specific proteomic analysis. (C) STRING network displaying protein-protein interactions between ER proteins with altered fold changes across time or differential abundance between biological conditions at specific time points. The selection of ER proteins was based on GO annotation on the STRING website. (D) Bar plots represent the densitometric quantification of Western blot bands for Calreticulin. Protein levels were normalized to the corresponding loading control (alpha Tubulin) and are expressed as arbitrary units in each group (ncontrol = 3, n H2O2 = 3). Data are presented as mean ± SD from three independent experiments. Statistical significance was assessed using an unpaired student’s t-test, where p < 0.05 was considered significant. Significant differences between control and treated groups are indicated by asterisks (*p < 0.05, **p < 0.01). (E) Gene expression profiles of sialyltransferases ST3Gal1 and ST6Gal1 were determined after 1–16 h of incubation in the presence or absence of hydrogen peroxide. Data are represented as mean ± SD from three independent experiments and asterisks indicate significant differences between groups (p < 0.05)
Fig. 6
Fig. 6
Alterations in secretome composition resulted from the hydrogen peroxide-triggered intracellular changes in human chondrocytes. (A) Volcano plots displaying differentially abundant proteins in the conditioned medium of NHAC-Kn cells after treatment with 100 µM of hydrogen peroxide for 16 h (ncontrol = 3, nH2O2 = 4). Significantly up- and downregulated proteins are shown in red and blue, respectively. Significance was defined using the Perseus software with an FDR value of 0.05 and S0 = 0.1. Labels showing gene names are shown for proteins with the highest fold changes. (B) Enrichment analysis based on Reactome terms for proteins upregulated in the secretome of NHAC-Kn cells 16 h post-exposure to hydrogen peroxide. The bar plot shows the 7 most enriched Reactome pathways and their respective FDRs. (C) Enrichment analysis based on Reactome terms for proteins downregulated in the secretome of NHAC-Kn cells 16 h post-exposure to hydrogen peroxide. The bar plot shows the 7 most enriched Reactome pathways and their respective FDRs. (D) Box plots of the log2 LFQ intensities of differentially abundant proteins (Student’s t-test, 0.05 FDR correction) in the secretome of hydrogen peroxide-treated NHAC-Kn cells
Fig. 7
Fig. 7
Secretome analysis suggests a negative correlation between the fold changes of intracellular and extracellular proteins. (A) Correlation analysis between proteome and secretome fold changes for proteins detected and quantified in both datasets. The color of each data point represents the p-value of secreted protein changes compared with the control and H₂O₂-treated samples, as indicated by the color gradient. (B) GO term enrichment analysis for proteins with a proteome FC > 1 and a secretome FC < 1. The bar plot shows the top seven enriched terms along with their respective FDRs. (C) Enrichment analysis based on GO terms for proteins found to have a proteome FC < 1 and a secretome FC > 1. The bar plot shows the 7 most enriched terms as well as their respective FDRs. (D) Pie charts representing the proportion of proteins with a proteome FC > 1 and a secretome FC < 1 that contain a signal peptide according to Uniprot and the likelihood of containing a signal peptide based on SignalP predictions. (E) Pie charts representing the proportion of proteins with a proteome FC < 1 and a secretome FC > 1 that contain a signal peptide according to Uniprot and the likelihood of containing a signal peptide based on SignalP predictions

Similar articles

References

    1. Yagi M, Endo K, Komori K, Sekiya I. Comparison of the effects of oxidative and inflammatory stresses on rat chondrocyte senescence. Sci Rep. 2023;13:7697. 10.1038/s41598-023-34825-1. - PMC - PubMed
    1. Chow YY, Chin K-Y. The role of inflammation in the pathogenesis of osteoarthritis. Mediators Inflamm. 2020;2020:8293921. 10.1155/2020/8293921. - PMC - PubMed
    1. Muttigi MS, Han I, Park H-K, Park H, Lee S-H. Matrilin–3 role in cartilage development and osteoarthritis. Int J Mol Sci. 2016;17:590. 10.3390/ijms17040590. - PMC - PubMed
    1. Bello AB, Kim Y, Park S, Muttigi MS, Kim J, Park H, et al. Matrilin3/TGFβ3 gelatin microparticles promote chondrogenesis, prevent hypertrophy, and induce paracrine release in MSC spheroid for disc regeneration. Npj Regen Med. 2021;6:1–13. 10.1038/s41536-021-00160-0. - PMC - PubMed
    1. Ansari MY, Ahmad N, Haqqi TM. Oxidative stress and inflammation in osteoarthritis pathogenesis: role of polyphenols. Biomed Pharmacother. 2020;129:110452. 10.1016/j.biopha.2020.110452. - PMC - PubMed

MeSH terms

LinkOut - more resources