. 2025 Jun 13;20(1):70.
doi: 10.1186/s13062-025-00653-8.

Estrogen receptor alpha dynamics and plasticity during endocrine resistance

Affiliations

Estrogen receptor alpha dynamics and plasticity during endocrine resistance

Aswathy Sivasailam et al. Biol Direct. .

Abstract

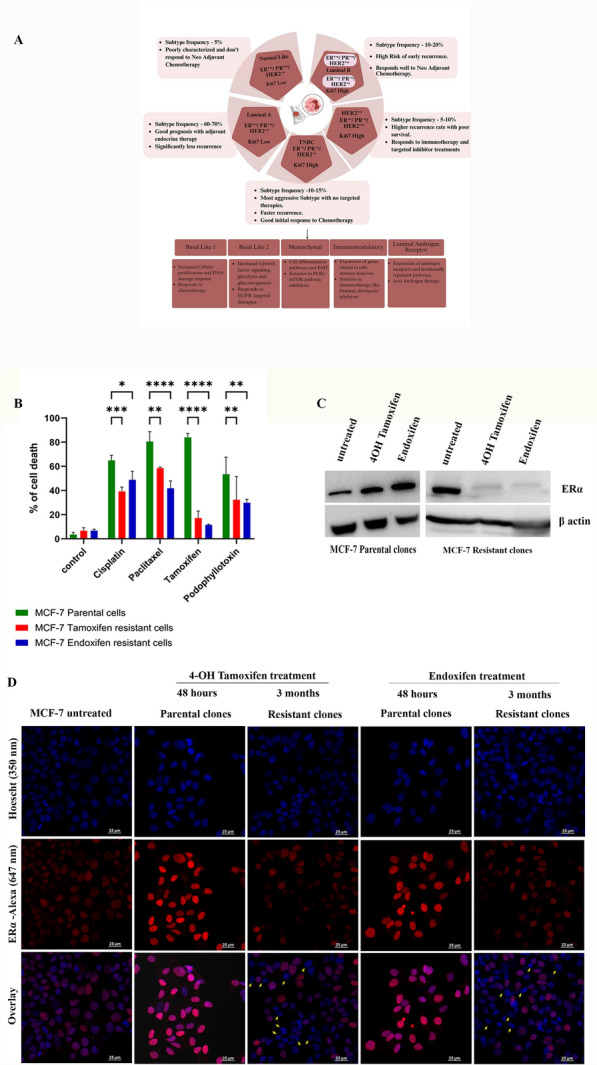
Background: Breast cancer is subdivided into four distinct subtypes based on the status of hormone receptors (HR) and human epidermal growth factor receptor 2 (HER2) as HER2-/HR+, HER2+/HR+, HER2+/HR- and HER2-/HR-. Among this, ERα positive breast cancer, even though they respond to endocrine treatment, half of the patients acquire resistance and progress with metastasis despite ERα status. Spatio-temporal changes in ERα and their loss under treatment pressure have been reported in a subset of patients, which is a serious problem.

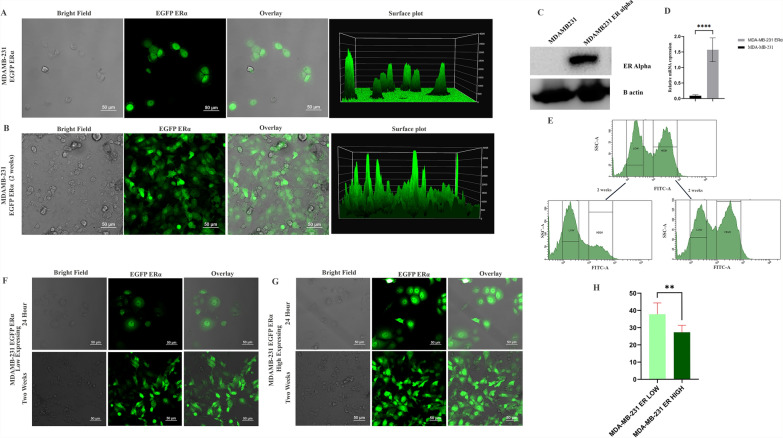
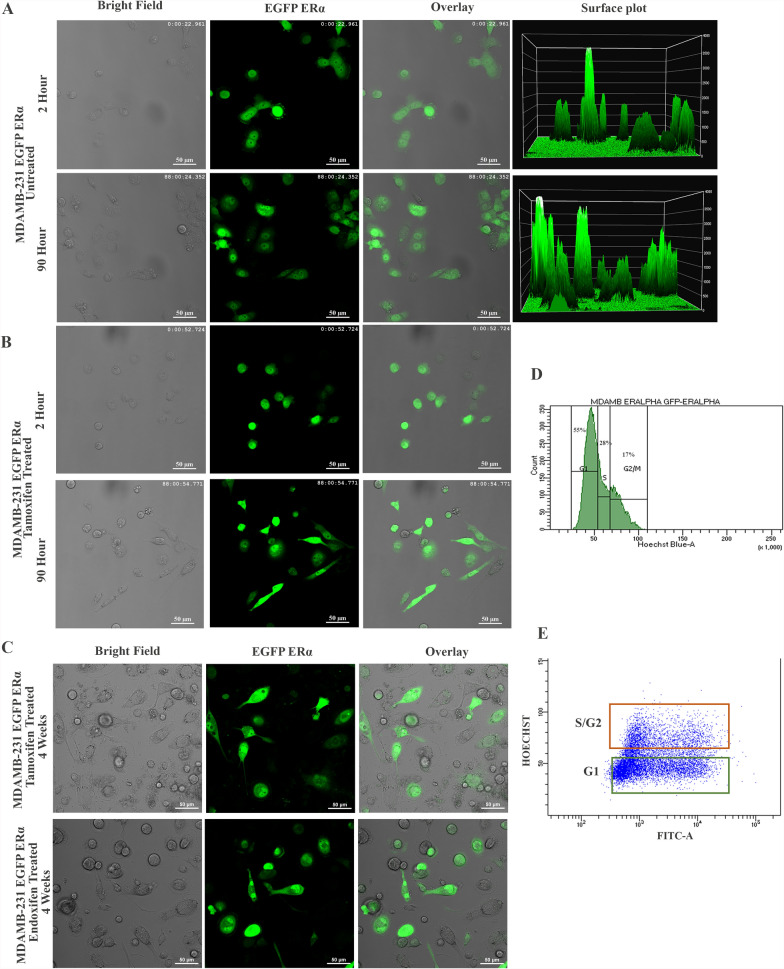
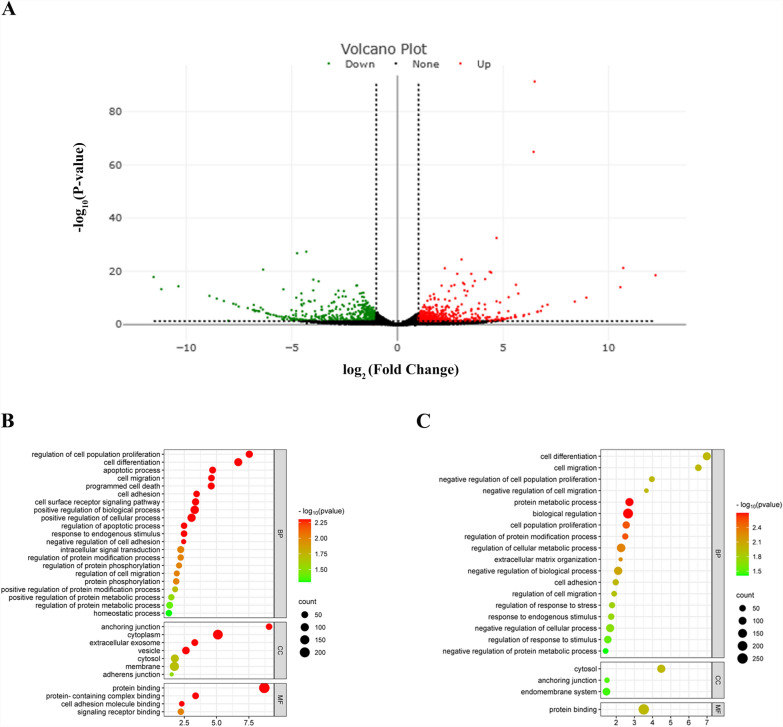
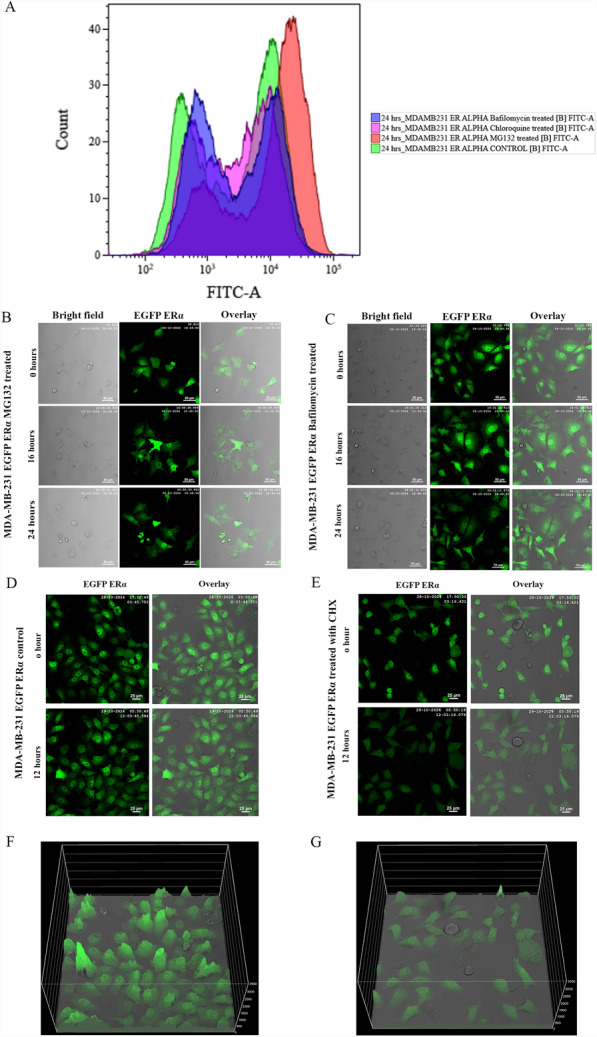
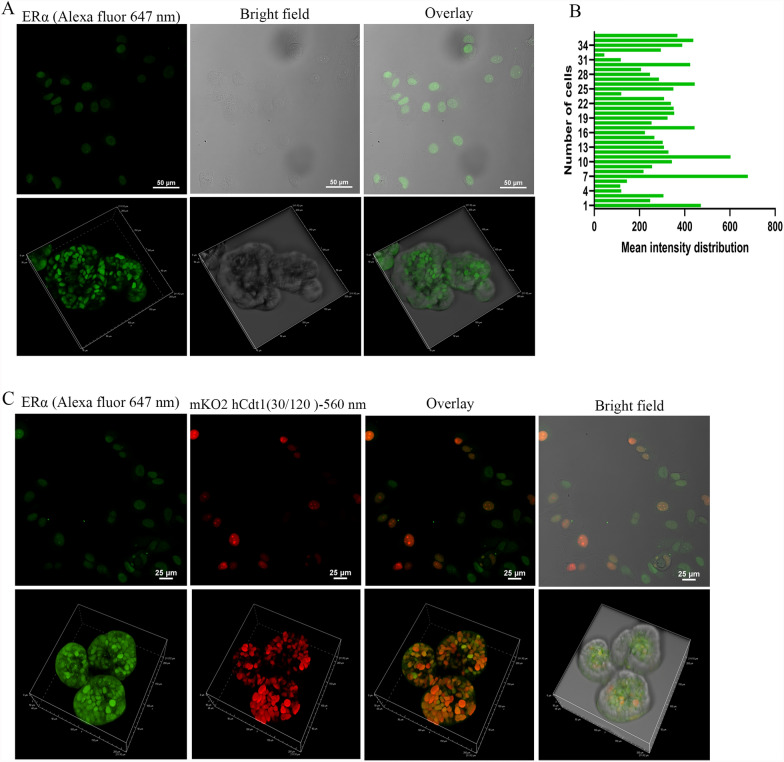
Results: We have demonstrated that in vitro-generated resistance is correlated with the down regulation of ERα. To study the ERα status transition in live cells, triple-negative breast cancer cells were engineered to express EGFP-ERα, which further supported the existence of complex intracellular signaling that regulates ERα plasticity even in unperturbed conditions. Single-cell clones generate heterogeneity and loss of expression depending on proliferative cues. However, the initial response of cells to 4 μM of 4-hydroxytamoxifen and 1 μM of endoxifen involves up-regulation of ERα, likely due to its early effect on the proteasome or autophagy pathway. Supporting this, inhibition of autophagy and the proteasome further enhanced the expression of ERα. Systematic analysis of RNA sequencing of ERα stable cells further confirmed that ERα regulates diverse intracellular signaling networks such as ubiquitin, proteasome pathways, cell proliferation and Unfolded Protein Responses (UPR), implicating its direct role in post-translational protein modifications. Cell cycle indicator probe expressing receptor-positive breast cancer cells confirmed the ERα expression heterogeneity both in 2D and 3D culture in a cell cycle phase-independent manner.

Conclusions: Overall, the study confirms the cell's intrinsic post-transcriptional mechanisms of ERα plasticity that could play a role in receptor heterogeneity and tumor progression under endocrine treatment, which warrants further investigation.

Keywords: Breast cancer; Endocrine resistance; Estrogen receptor alpha (ERα); Real-time imaging; Receptor heterogeneity; TNBC; Tamoxifen; Unfolded protein response.


Conflict of interest statement

Declarations. Competing interests: The authors declare no competing interests.

Figures

Fig. 1
Fig. 1
Cell death and ERα expression comparison in parental and endocrine-resistant clones of MCF-7. A Schematic representation of primary breast cancer molecular subtypes (Normal-like, Luminal A, Luminal B, HER2 enriched, and Triple Negative breast cancer) based on ER, PR, HER2 expression status, and Ki-67 index. The differences among these subtypes are associated with distinct clinical outcomes and differential responses to therapy, contributing to varied drug resistance patterns. B Graphical representation of the percentage of cell death in parental and endocrine-resistant clones (3-month treatment) of MCF-7 exposed to cisplatin, paclitaxel, podophyllotoxin, and higher concentrations of 4OH tamoxifen for 48 h. C Immunoblot for ERα expression in parental (early treatment for 48 h) and endocrine-resistant (3 months of endocrine treatment) clones of MCF-7 cells, and β-actin served as a control. D Confocal images of ERα immunostained (Alexa fluor 647) parental and endocrine-resistant clones of MCF-7 exposed to 4OH tamoxifen and endoxifen. The nucleus is counterstained with Hoechst. The cells with loss of ERα expression are marked with arrows
Fig. 2
Fig. 2
ERα overexpression, heterogeneity, and correlation with doubling time in MDA-MB-231: A EGFP ERα stably expressing in MDA-MB-231 cell line. The representative individual channels, overlay, and surface intensity plots for EGFP are shown. B The panel shows the heterogeneity of the EGFP ERα expression in the MDA-MB-231 EGFP ERα cell line after two weeks. Respective individual channels with overlay and surface intensity plots for EGFP are also shown. C Immunoblot of MDA-MB-231 EGFP ERα and MDA-MB-231 transfected with empty vector, β-actin serves as the control. D. RT-qPCR data showing the transcription levels of ERα in MDA-MB-231 ERα cells and control cells. Values are expressed in mean ± SD (**** p ≤ 0.0001). E. The flow cytometry gating strategy for sorting high and low-ERα expressing populations of MDA-MB-231 EGFP ERα. Heterogeneity dynamics analysis of EGFP ERα in low and high expressing cells after two weeks (lower panel). F, G The confocal microscopic images of sorted cells as low and high-expressing populations after 24 h (F) and 2 weeks (G) of sorting. H Graphical comparison of doubling time between cells with high and low EGFP ERα expression. Values are expressed in mean ± SD (** p ≤ 0.01)
Fig. 3
Fig. 3
ERα dynamics in MDA-MB-231 EGFP ERα cells under endocrine treatment and the effect on cell cycle. A Real-time confocal imaging of MDA-MB-231 EGFP ERα cells to evaluate ERα dynamics under normal conditions (90 h). Representative confocal images and surface intensity plots are shown. B Time-lapse confocal imaging of MDA-MB-231 EGFP ERα cells under 4OH tamoxifen treatment for 90 h. Representative confocal images are shown. C Endpoint confocal images of MDA-MB-231 EGFP ERα cells treated with endoxifen and 4OH tamoxifen for four weeks. D Histogram showing flow cytometric cell cycle analysis of MDA-MB-231 EGFP ERα cells. E Flow cytometry scatter plot showing population distribution using FITC (EGFP ERα) and Hoechst (arbitrary gates)
Fig. 4
Fig. 4
Distribution of the differentially expressed genes (DEGs) as volcano plot and GO enrichment analysis. A Volcano plot showing the distribution of DEGs (−Log10(p-value) vs Log2(Fold Change)). Each dot represents a DEG. The green dots represent the down-regulated, the red dots represent the up-regulated, and the black dots represent non-significantly expressed DEGs (p-adj ≤ 0.05). B, C Functional enrichments of DEGs based on gene ontology (GO) analysis, including significantly enriched terms of biological process (BP), cellular component (CC), and molecular function (MF). The y-axis lists the enrichment terms (false discovery rate [FDR] ≤ 0.05) for the 3 GO categories, and the x-axis represents the Log2(Fold Change) of the DEGs. The colour gradient represents −Log10(P-value), and the dot size represents the DEG count (B upregulated DEGs, C down-regulated DEGs)
Fig. 5
Fig. 5
Effect of proteasomal, autophagy and translational inhibitors on ERα expression dynamics in MDA-MB-231 EGFP ERα cells. A Histogram showing flow cytometric analysis of MDA-MB-231 EGFP ERα cells after treatment with proteasomal inhibitor (MG132), autophagy inhibitor (bafilomycin and chloroquine) for 24 h. B Time-lapse images of MDA-MB-231 EGFP ERα cells, treated with MG132 for 24 h. C Time-lapse MDA-MB-231 EGFP ERα cells treated with bafilomycin for 24 h. D Real-time imaging of MDA-MB-231 EGFP ERα untreated cells and E MDA-MB-231 EGFP ERα cells treated with translational inhibitor, cycloheximide (CHX) for 12 h. The surface intensity plot of untreated control and CHX-treatment is shown in F and G, respectively
Fig. 6
Fig. 6
Comparison of ERα expression heterogeneity in relation to the cell cycle in 2D and 3D cultures of MCF-7. A An immunofluorescence analysis of MCF-7 cells cultured in monolayer and 3D spheroids for the expression of ERα. B The bar graph represents the mean fluorescence intensity of the monolayer. Each bar represents the mean fluorescent intensity of a single cell, to show the expression heterogeneity. C Immunofluorescent confocal images of ERα in MCF-7 Cdt cells cultured in monolayer and 3D spheroids

Similar articles

References

    1. Łukasiewicz S, Czeczelewski M, Forma A, Baj J, Sitarz R, Stanisławek A. Breast cancer-epidemiology, risk factors, classification, prognostic markers, and current treatment strategies-an updated review. Cancers (Basel). 2021;13(17):4287. 10.3390/CANCERS13174287. - PMC - PubMed
    1. Hu Z, Fan C, Oh DS, Marron JS, He X, Qaqish BF, et al. The molecular portraits of breast tumors are conserved across microarray platforms. BMC Genomics. 2006;7:96. 10.1186/1471-2164-7-96. - PMC - PubMed
    1. Calza S, Hall P, Auer G, Bjöhle J, Klaar S, Kronenwett U, et al. Intrinsic molecular signature of breast cancer in a population-based cohort of 412 patients. Breast Cancer Res. 2006;8:R34. 10.1186/BCR1517. - PMC - PubMed
    1. Darida M, Rubovszky G, Kiss Z, Székely B, Madaras B, Horváth Z, et al. Improvement in breast cancer survival across molecular subtypes in Hungary between 2011 and 2020: a nationwide, retrospective study. Front Oncol. 2025;15:1465511. 10.3389/FONC.2025.1465511/PDF. - PMC - PubMed
    1. Pellegrino B, Hlavata Z, Migali C, De Silva P, Aiello M, et al. Luminal breast cancer: risk of recurrence and tumor-associated immune suppression. Mol Diagn Ther. 2021;25:409–24. 10.1007/s40291-021-00525-7. - PMC - PubMed

LinkOut - more resources