. 2025 Jun 30;39(12):e70717.
doi: 10.1096/fj.202401718RR.

Brain-Specific Gata4 Downregulation in Greywick Female Mice Models the Metabolic Subtype of Polycystic Ovary Syndrome

Affiliations

Brain-Specific Gata4 Downregulation in Greywick Female Mice Models the Metabolic Subtype of Polycystic Ovary Syndrome

Sherin A Nawaito et al. FASEB J. .

Abstract

Polycystic ovary syndrome (PCOS) is a heterogenous disorder characterized by reproductive and metabolic abnormalities. PCOS etiology remains poorly understood, although the hypothalamus is suspected to play a central role in many cases. Human genetic studies have also shown an association with the transcription factor-coding gene GATA4, but without providing a functional link. Here, we show that adult Greywick female mice may bridge this gap. These mice phenocopy PCOS with partial penetrance, due to the serendipitous insertion of a Gata4 promoter-driven transgene in a strong enhancer region. Resulting robust transgene expression in subsets of hypothalamic neurons and glia impairs endogenous Gata4 expression, resulting in misexpression of genes linked to the control of fertility and food intake. We also show that this previously overlooked role of GATA4 in the hypothalamus can be replicated by conditional knockout approaches. Overall, this study sheds light not only on PCOS etiology but also on the role played by GATA4 in the central control of reproduction.

Keywords: GATA4; fertility; hypothalamus; metabolism; mouse model; polycystic ovary syndrome.


Conflict of interest statement

The authors declare no conflicts of interest.

Figures
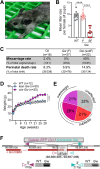
FIGURE 1
FIGURE 1
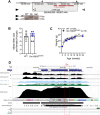
Subsets of Greywick female mice are subfertile and gain extraweight with age. (A) Pigmentation pattern of so‐named Greywick (Gw) mice in the FVB/N genetic background. (B) Average number of pups per litter for adult Gw and WT females (2‐ to 6‐month‐old), after breeding with WT males (n = 10–11 females per group, 2–3 litters per female). F, fertile; subF, subfertile. (C) Comparative table of pregnancy complication‐related parameters. (D) Weight gain as a function of female age (Gw vs. WT; n = 12–30 females per group). (E) Phenotypic distribution of subfertility and overweight in Gw female mice aged between 2 and 6 months (n = 115 females). (F) Overview of the Gw insertion site showing co‐integration of Gata4p[5 kb]‐RFP (2 copies) and tyrosinase (5 copies) transgenes into an 81 bp deletion (dashed box) within Gm10800 on Chr.2 (adapted from the Ensembl website), and confirmatory PCR products for 5′ and 3′ genomic/transgenic boundaries using indicated color‐coded primers. ****p < 0.0001; two‐tailed Welch's t‐test (B) or two‐way ANOVA with Dunnet's post hoc test (C).
FIGURE 2
FIGURE 2
Disruption of Gm10800 is not the cause of the Gw phenotypes. (A) Overview of the Gm10800 locus (adapted from the Ensembl website) showing position of sgRNAs (black arrows) and resulting 1751 bp deletion after CRISPR/Cas9‐mediated deletion and NHEJ repair (dashed box), and genotyping PCR products in mice using indicated color‐coded primers. (B) Average number of pups per litter for Gm10800 KO/KO and WT females (2‐ to 6‐month‐old), after breeding with WT males (n = 10–16 females per group, 2–3 litters per female). (C) Weight gain as a function of female age (Gm10800 KO/KO vs. WT; n = 15–28 females per group). (D) Screenshot from the UCSC genome browser showing key genomic features within and around Gm10800, with position of the Gw insertion site indicated by a dashed red box. ATAC‐seq tracks show chromatin accessibility in forebrain and heart tissues at embryonic day E15, K4me1 and K27ac ChIP‐seq tracks show the signature of an active enhancer in E15 forebrain, and ReMap tracks show aggregate ChIP‐seq data for multiple transcription factors in a wide diversity of cell types. Other tracks at the bottom further show that this region is enriched in satellite repetitive sequences, highly tolerant to single nucleotide variations, and not conserved in any other species.
FIGURE 3
FIGURE 3
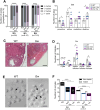
Estrous cycle profile, ovarian histology, and oocyte quality of Gw females are consistent with a PCOS‐like phenotype. (A) Number of estrous cycles per period of 16 days in WT and both lean and overweight (o/w) Gw female mice at 2, 4, and 6 months (m) of age (n = 3–10 females per group). (B) Number of days spent in each phase of the estrous cycle per period of 16 days in WT and both lean and overweight (o/w) Gw female mice at 6 months (m) of age (n = 4–5 females per group). (C) Hematoxylin and eosin staining of ovarian sections from 6‐month‐old ovaries showing a representative follicular cyst (white arrow) in Gw female mice. (D) Quantitative analysis of the number of cysts, corpora lutea (CL), atretic follicles, antral follicles, and other follicles counted on ovarian sections of 6‐month‐old WT and both lean and overweight (o/w) Gw female mice, using images such as those displayed in panel (C). (E) Gross morphology of oocytes collected from 4‐month‐old WT and Gw female mice, after artificially induced ovulation using PMSG and hCG. Arrows point to nonviable oocytes characterized by blurred or fragmented appearance. (F) Quantification of the number and quality of retrieved oocytes after induction of ovulation, using images such as those displayed in panel (E) (n = 5–7 induced females per group). Scale bar, 200 μm (C) and 50 μm (E). *p < 0.05, **p < 0.01, ****p < 0.0001; chi‐squared tests (A and F) or two‐tailed Welch's t‐test (B and D).
FIGURE 4
FIGURE 4
Hormonal profiles of Gw females are consistent with a PCOS‐like phenotype. (A) Circulating plasma levels of testosterone (left panel), estradiol (middle panel) and LH (right panel) in WT and both lean and overweight (o/w) Gw female mice during metestrus at 2, 4, and 6 months (m) of age (n = 3–11 mice per group). (B) Representative graphs of pulsatile LH levels in tail‐tip blood samples taken every 10 min in 4‐month‐old female WT and Gw mice. Red asterisks indicate pulses. Full data are presented in Figure S5. (C) Statistical analysis of LH pulsatility using graphs such as those displayed in panel B (n = 8 mice per group). *p < 0.05, ***p < 0.001; two‐tailed Welch's t‐test.
FIGURE 5
FIGURE 5
Metabolic parameters of Gw females are consistent with the metabolic subtype of PCOS. (A) Relative size of paraovarian fat pads (red arrows, upper panels) and their H&E‐stained adipocytes (lower panels) in WT and both lean and overweight (o/w) Gw female mice at 6 months of age (representative images of n = 3 per group). (B) Quantitative analysis of paraovarian adipocyte size in 6‐month‐old mice, using images such as those displayed in lower panels in A (n = 3 mice per group, average for three fields of view per sample). (C) Food consumption of 6‐month‐old female mice over a period of 4 days. (D–E) Circulating levels of leptin (at 6 months) (D) and insulin (at 4 and 6 months; (E) in adult female mice after 4 h of fasting. (F, F′) Glucose levels in 6‐month‐old female mice after 4 h of fasting (FBS), and at indicated time points following i.p. injection of a 0.5 U/mL insulin solution (0.5 mU/g of body weight; n = 3–4 mice per group). Data based on area under the curve (AUC) are shown in F′. (G, G′) Glucose levels in 6‐month‐old female mice after 6 h of fasting (FBS), and at indicated time points following i.p. injection of a 0.1 g/mL glucose solution (1 mg/g of body weight; n = 4 mice per group). Data based on area under the curve (AUC) are shown in G′. (H, K) Oil red O staining of neutral lipids (H) and Masson's trichrome staining of collagen (K) in cross‐sections of ovaries from 6‐month‐old female mice (representative images of n = 3 mice per group). (I) Immunofluorescence staining of the ER stress marker IRE1 (red) in cross‐sections of ovaries from 6‐month‐old female mice, with cell nuclei counterstained using DAPI (blue). (J) Quantitative analysis of the number of IRE1‐positive cells in ovarian follicles using images such as those displayed in panel I (n = 3 mice per group, average for five fields of view per sample). Scale bar, 100 μm (A), 200 μm (H), and 50 μm (I). *p < 0.05, **p < 0.01, ****p < 0.0001; one‐way ANOVA with Tukey's post hoc test (B, C, F′, G′), two‐tailed Welch's t‐tests (D and E), or two‐way ANOVA with Tukey's post hoc test (F and G).
FIGURE 6
FIGURE 6
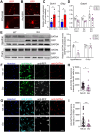
Expression of the Gata4p[5 kb]‐RFP transgene in the hypothalamus of Gw female mice is associated with downregulation of endogenous Gata4. (A) Distribution (upper panel; low magnification) and morphology (lower panel; high magnification) of RFP‐positive cells in preoptic (POA) and anterior (AHA) hypothalamus areas of unfixed/flatmounted hypothalamus from 4‐month‐old Gw female mice is consistent with a GnRH neuron identity (representative of n = 3 mice). (B) Distribution (upper panel; low magnification) and morphology (lower panel; high magnification) of RFP‐positive cells in arcuate nucleus (Arc) and ventromedial hypothalamus (VMH) of unfixed/flatmounted hypothalamus from 4‐month‐old Gw female mice is consistent with an astrocyte identity (representative of n = 3 mice). (C) RT‐qPCR analysis of genes encoding markers of GnRH neurons (Gnrh1) and astrocytes (Gfap) in RFP‐negative and ‐positive hypothalamic cells isolated by FACS from 1‐month‐old Gw mice. Each sample represents cell pools recovered from the hypothalamus of three mice (n = 3 samples per group, 9 mice total). (D) RT‐qPCR analysis of Gata4 expression in developing brain (e11.5) as well as pubertal (2 weeks) and adult (4 months) Arc nucleus, microdissected after slicing in brain matrix (n = 3–5 mice per group). (E) Western blot analysis of GATA4 protein levels in whole hypothalamus and ovary from 4‐month‐old WT and Gw female mice (n = 3–4 mice per group), with accompanying quantification shown on the right. (F) Representative confocal images of NeuN+ hypothalamic neurons (green) co‐stained for Hoechst (blue), RFP (white), and GATA4 (red) after dissociation from 1‐month‐old heterozygous (het. ctl) and homozygous Gw hypothalamus and 7 days of culture (n = 3 mice per group). A negative control image is presented in Figure S10A. (G) Representative confocal images of S100β + hypothalamic astrocytes (green) costained for Hoechst (blue), RFP (white), and GATA4 (red) after dissociation from 1‐month‐old heterozygous (het. ctl) and homozygous Gw hypothalamus and 7 days of culture (n = 3 mice per group). A negative control image is presented in Figure S10B. (H, I) Quantification of GATA4 protein levels in cultured hypothalamic cells based on intensity of immunofluorescence staining, using images such as those displayed in panels (F, G) (n = 3 mice per group, 3–5 fields of view per sample). Scale bar, 100 μm (upper panels in A, B), 25 μm (lower panels in A, B), and 50 μm (F, G). *p < 0.05, **p < 0.01, ****p < 0.0001; two‐tailed Welch's t‐tests.
FIGURE 7
FIGURE 7
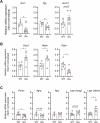
Multiple markers of hormonal feedback, GnRH release, and food intake are dysregulated in the hypothalamus of Gw female mice. (A–C) RT‐qPCR analysis of sex hormone receptor‐coding genes (A), GnRH pulse generator‐coding genes (B), and food intake‐associated neuropeptide‐coding genes (C) in 4‐month‐old Arc nucleus, microdissected from WT and Gw mice after slicing in brain matrix (n = 3–5 mice per group). *p < 0.05, **p < 0.01; two‐tailed Welch's t‐tests.
FIGURE 8
FIGURE 8
Brain‐specific knockout of Gata4 in either neurons or astrocytes phenocopies the subfertility phenotype of Gw female mice. (A) Overview of conditional knockout strategies and experimental design for assessment of fertility and bodyweight in resulting tamoxifen‐treated Gata4 LoxP/LoxP ; Nestin‐CreERT2 Tg/+ and Gata4 LoxP/LoxP ; GFAP‐CreERT2 Tg/+ female mice (vs. Gata4 LoxP/LoxP Cre‐negative controls). (B) Validation of tamoxifen‐induced Cre activity in hypothalamic cells, based on Rosa26 locus‐driven YFP expression in tamoxifen‐treated Nestin‐CreERT2 Tg/+ ; Rosa26 [FloxedSTOP]YFP/+ (upper panel) and GFAP‐CreERT2 Tg/+ ; Rosa26 [FloxedSTOP]YFP/+ (lower panel) female mice (1 week after tamoxifen administration at 1 month of age), respectively. (C) Western blot analysis of GATA4 protein levels in whole hypothalamus of 4‐month‐old control and tamoxifen‐treated Gata4 LoxP/LoxP ; Nestin‐CreERT2 Tg/+ and Gata4 LoxP/LoxP ; GFAP‐CreERT2 Tg/+ female mice (representative images of n = 6 mice per group), with accompanying quantification shown on the right. (D) Average number of pups per litter for tamoxifen‐treated conditional Gata4 knockout females and respective littermate controls (2‐ to 4‐month‐old), after breeding with WT males (n = 6–10 females per group, 2–3 litters per female). F, fertile; subF, subfertile. (E) Bodyweight of 4‐month‐old (4 m) and 6‐month‐old (6 m) tamoxifen‐treated conditional Gata4 knockout female mice and respective littermate controls, before breeding (n = 8–21 females per group). (F) Comparative table of pregnancy complication‐related parameters. Scale bar, 50 μm. *p < 0.05, ***p < 0.001, ****p < 0.0001; two‐tailed Welch's t‐tests.

References

    1. Escobar‐Morreale H. F., “Polycystic Ovary Syndrome: Definition, Aetiology, Diagnosis and Treatment,” Nature Reviews. Endocrinology 14 (2018): 270–284. - PubMed
    1. Teede H. J., Tay C. T., Laven J. J. E., et al., “Recommendations From the 2023 International Evidence‐Based Guideline for the Assessment and Management of Polycystic Ovary Syndrome,” Journal of Clinical Endocrinology and Metabolism 108 (2023): 2447–2469. - PMC - PubMed
    1. Stener‐Victorin E., Teede H., Norman R. J., et al., “Polycystic Ovary Syndrome,” Nature Reviews. Disease Primers 10 (2024): 27. - PubMed
    1. Crespo R. P., Bachega T., Mendonca B. B., and Gomes L. G., “An Update of Genetic Basis of PCOS Pathogenesis,” Archives of Endocrinology and Metabolism 62 (2018): 352–361. - PMC - PubMed
    1. Ruddenklau A. and Campbell R. E., “Neuroendocrine Impairments of Polycystic Ovary Syndrome,” Endocrinology 160 (2019): 2230–2242. - PubMed

Substances

LinkOut - more resources