. 2025 Jul 1;37(7):koaf148.
doi: 10.1093/plcell/koaf148.

Polycomb repressive complex 2 facilitates the transition from heterotrophy to photoautotrophy during seedling emergence

Affiliations

Polycomb repressive complex 2 facilitates the transition from heterotrophy to photoautotrophy during seedling emergence

Naseem Samo et al. Plant Cell. .

Abstract

The seed-to-seedling transition represents a key developmental and metabolic switch in plants. Catabolism of seed storage reserves fuels germination and early seedling emergence until photosynthesis is established. The seed-to-seedling developmental transition is controlled by Polycomb repressive complex 2 (PRC2). However, the coordination of PRC2 activity and its contribution to transcriptional reprogramming during seedling establishment remain unknown. By analyzing H3K27me3 re-distribution and changes in gene transcription in the shoot and root tissues of heterotrophic and photoautotrophic Arabidopsis (Arabidopsis thaliana) seedlings, we reveal 2 phases of PRC2-mediated gene repression. The first phase is independent of light and photosynthesis and results in the irreversible repression of the embryo maturation program, marked by heterotrophy and reserve storage molecule biosynthesis. The second phase is associated with the repression of metabolic pathways related to germination and early seedling emergence, and H3K27me3 deposition in this phase is sensitive to photosynthesis inhibition. We show that preventing the transcription of the PRC2-repressed glyoxylate cycle gene ISOCITRATE LYASE promotes the vegetative phase transition in PRC2-depleted plants. Our findings underscore a key role of PRC2-mediated transcriptional repression in the coordinated metabolic and developmental switches that occur during seedling emergence and emphasize the close connection between metabolic and developmental identities.


Conflict of interest statement

Conflict of interest statement. None declared.

Figures

Figure 1.
Figure 1.
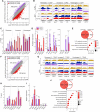
3- and 7-DAG seedlings display distinct gene transcription and H3K27me3 distribution patterns. A) Assimilation of atmospheric CO2 is initiated after 3 DAG. Plants were cultivated in artificial air (δ13C = −40‰). Roots and shoots were analysed separately from 3 DAG. DCMU: photosynthesis-inhibited control. Each point represents a biological replicate; error bars: ±SD; N = 3. B) Schematic representation of experimental setup. Wild-type seedlings were cultivated on growth medium (MS) supplemented with DCMU (MS + DCMU), or DCMU + 1% sucrose (MS + Suc + DCMU). Scale bar: 1 mm. Tissue samples: S—shoot; R—root; Cultivation conditions: P—photoautotrophic; H—heterotrophic; D—DCMU; 3–3-DAG seedling; 7–7-DAG seedling. The illustrative images of MS seedlings in panel B) are also used in Fig. 6G. C) Numbers of DEGs in analysed sample comparisons. D) Overlap of genes enriched for H3K27me3 (H3K27me3 targets) in the shoot and root samples. DAG—day after germination.
Figure 2.
Figure 2.
Heterotrophic growth reduces H3K27me3 in 7-DAG tissues. A) Log2 H3K27me3/H3 (K27/H3) enrichment in gene bodies (±0.6 kb) of H3K27me3 target genes in wild-type shoot or root. Plotted are H3K27me3 target genes (T70) identified in at least 1 of the shoot samples (“Shoot” panel) or root samples (“Root” panel). Sample labels correspond to Fig. 1B. TSS—transcription start site; TTS—transcription termination site. B) H3K27me3/H3 enrichment in H3K27me3 target genes (T70) in 7-DAG shoot (S-P) and root (R-P). Each dot represents a gene; green and orange dots represent genes that lose H3K27me3 in 7-DAG heterotrophic shoot (S-H/S-P) and root (R-H/R-P), resp. P-values (hypergeometric test): significance of overlap (enrichment or depletion) between shoot (green) or root (ochre) genes and genes losing H3K27me3 in respective heterotrophic samples. C) H3K27me3/H3 enrichment in H3K27me3 target genes (T70) in 3-DAG (S-P3) and 7-DAG (S-P) photoautotrophic shoot. Each dot represents a gene; blue or red dots represent genes that gain or lose H3K27me3, respectively, in 7-DAG heterotrophic compared with photoautotrophic shoot (S-H/S-P). P-values (hypergeometric test): significance of overlap between genes that lose H3K27me3 in heterotrophic shoot (S-H/S-P) and genes that gain H3K27me3 between 3 and 7 DAG. D) H3K27me3/H3 enrichment in H3K27me3 target genes (T70) in 3-DAG (R-P3) and 7-DAG (R-P) photoautotrophic root. Each dot represents a gene; blue or red dots represent genes that gain or lose H3K27me3, respectively, in 7-DAG heterotrophic compared with photoautotrophic root (R-H/R-P). Outer black diagonal lines in B—D delineate log2 fold-change ± 0.6. DAG—day after germination.
Figure 3.
Figure 3.
H3K27me3 and transcriptional reprogramming in shoot and root tissues between 3 and 7 DAG. A) and F) H3K27me3/H3 enrichment in target genes in 3-DAG and 7-DAG photoautotrophic shoot (S-P3, S-P; resp.) A) or root (R-P3, R-P; resp.) F). Genes enriched for H3K27me3/H3 in at least 1 sample are displayed. Outer black diagonal lines in B—D delineate log2 fold-change ± 0.6. B) and G) Genome browser display of selected genes showing the distribution of H3, H3K27me3 (“K27”), and H3K27me3/H3 (“K27/H3”) in 3-DAG and 7-DAG wild-type shoot B) or root G). The Y-axis scale of the respective H3, K27 and K27/H3 tracks compared at 3 DAG and 7 DAG is identical. ACT2, a non-PRC2-target gene, serves as a negative control. C) and H) ChIP-qPCR confirmation of ChIP-seq. C) genes with decreased (BLH2, TCP2, NGA2, FUM2), increased (FLC, ELIP1, PLT5, ICL, PCK1), and unchanged (LEC1, LEC2, ABI3, FUS3) H3K27me3 between 3- and 7-DAG shoot. H) genes with decreased (AGL21 and HRS1), increased (PSAH2 and PGRL1B), or unchanged (LHCA2, GLK1 and PSAD1) H3K27me3 between 3- and 7-DAG root. ACT7 serves as negative control with no H3K27me3 enrichment. Bars: mean ± SD; N = 3 technical replicates. D) and I) Transcription (RT-qPCR) of genes analysed in C) and H), respectively. Bars: mean ± SD; N = 3 biological replicates. Letters above bars: statistical significance levels at P < 0.01; Student’s t test. ND—not detected. E) and J) Gene ontology enrichment of 7-DAG H3K27me3 target genes (T70) transcriptionally downregulated from 3 to 7-DAG in the shoot E) or root J). S-P: 7-DAG shoot; R-P: 7-DAG root. BP categories are shown; GO display cutoff: fold enrichment > 1.5; p(Bonferroni) < 0.05. DAG—day after germination.
Figure 4.
Figure 4.
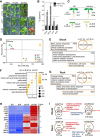
PRC2 is required for photoautotrophic growth. A) Wild type (WT; a-f) and clf swn (cs; g-n) plants cultivated in photoautotrophic (P) and mixotrophic (M) conditions for 7, 14 and 28 days. Sudan Red 7B (fat- red) staining (j, n) is used to detect embryonic lipids. Scale bar = 1 mm (a, d, g, h, k, l), 2 mm (i, j, m, n), 5 mm (b, e), 1 cm (c, f). B)  13CO2 content in the shoot before and after 1-hr cultivation in 13CO2-enriched air. WT and cs shoots of 10-DAG seedlings cultivated in photoautotrophic (P) and mixotrophic (M) growth conditions are shown. Approximately 1.1 atom% of 13C in all WT and cs represents natural abundance of 13CO2 in atmospheric air. Bars: mean ± SD; N = 3 biological replicates. Letters above bars: P < 0.05; two-way ANOVA with Bonferroni post hoc test. C) Experimental setup of transcriptome analyses of seedlings 5 to 6 DAG. 9-DAG cs and 7-DAG WT is used to account for the delay in cs germination. S—shoot; R—root; P—photoautotrophic; M—mixotrophic; MS—½ Murashige and Skoog medium; suc—sucrose. D) RNA-Seq PCA plot: RPKM values of all genes. E) Schematic representation of genes and enriched GO biological processes upregulated in cs photoautotrophic (cs-S-P) and mixotrophic (cs-S-M) shoots compared with respective WT shoots (S-P and S-M). GO summary cutoff: p(Bonferroni) < 0.05. F) Biological processes upregulated in mixotrophic (cs-S-M) compared with photoautotrophic (cs-S-P) cs shoot. GO summary cutoff: p(Bonferroni) < 1e-06. G) Schematic representation of genes and enriched GO biological processes upregulated in cs photoautotrophic (cs-R-P) and mixotrophic (cs-R-M) roots compared with respective WT roots (R-P and R-M). GO display cutoff: p(Bonferroni) < 0.05. H) Expression of embryo and flower development genes in WT and cs. Z-scored RPKM; asterisks (*): significantly different transcription related to corresponding WT (FDR < 0.05, DESeq2). I) Photoautotrophic cs seedlings resemble heterotrophic WT seedlings. p(hyp): P-value—hypergeometric test of enrichment; ratio of observed/expected indicated in brackets. Summary of GO biological processes enriched among genes commonly dysregulated in photoautotrophic cs and DCMU-treated WT tissues. GO summary cutoff: fold enrichment > 3; p(Bonferroni) < 0.05. Full GO graphs are shown in Supplementary Fig. S8. DAG—day after germination.
Figure 5.
Figure 5.
The transcriptome and primary metabolome of PRC2-depleted clf swn (cs) seedlings resembles embryo maturation and seed germination developmental stages. A) Comparison of DEGs in 9-DAG photoautotrophic (cs-S-P) and mixotrophic (cs-S-M) cs seedling shoots to genes transcribed in dry seed and seedling establishment stages (Silva et al. 2016). P-values of hypergeometric tests for gene set overlaps: enrichment and impoverishment compared to overlaps expected by chance are distinguished. DS—dry seed, 6H—six hours of imbibition, TR—testa rupture, RP—radicle protrusion, RH—root hair emergence stage, GC—greening cotyledon stage, OC—open cotyledons stage (cf. full dataset comparison in Supplementary Fig. S9, B and C). B) RT-qPCR-based determinations of transcript abundances of genes involved in embryo maturation and metabolic pathways marking seedling emergence in photoautotrophic (S-P2 and S-P) and mixotrophic (S-M2 and S-M) WT shoot at 2- and 7-DAG and photoautotrophic (cs-S-P) and mixotrophic (cs-S-M) cs shoot at 9-DAG. Mutant sampling was delayed to adjust mutant development to 7-DAG WT. The heatmap represents z-score normalized relative expression mean of 3 biological replicates. Letters (a—e): statistical significance at P < 0.05, based on a two-way ANOVA. C) Heatmap of selected relative metabolite abundances in WT photoautotrophic (S-P) and mixotrophic (S-M) shoots of WT seedlings compared with respective cs shoot samples cs-S-P and cs-S-M. Z-score normalized means are represented; N = 5 biological replicates. Asterisks (*): statistical significance at P < 0.05 (adjusted) based on ANOVA and Tukey's HSD test. Black asterisks indicate significant difference among genotypes (cs-S-P vs. S-P and cs-S-M vs. S-M), yellow asterisks indicate significant differences induced by mixotrophy (S-M vs. S-P and cs-S-M vs. cs-S-P). Clusters (CL) 1 to 6 correspond to Supplementary Fig. S9F, i.e. the complete heatmap of all 85 metabolites. D) Spearman correlation between the primary metabolomes of photoautotrophic (P) and mixotrophic (M) WT and cs shoot samples and samples representing 25 stages of seed maturation, dry seeds (DS) and 5 stages of seed germination sampled at 24, 36, 48, 60, and 72 h after imbibition(Ginsawaeng et al. 2021). Metabolite data were maximum-scaled per metabolite and dataset to a 0 to 100 numerical range. Negative correlation (−1 minimum correlation coefficient, blue), noncorrelated (0, white), and positive correlation (+1 maximum correlation coefficient, red). Asterisks (*): significant differences between replicates of correlation coefficients (Student’s t-test, P < 0.05, 2-tailed, heteroscedastic) tested against the respective WT photoautotrophic (S-P) replicates. DAG—day after germination.
Figure 6.
Figure 6.
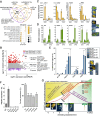
PRC2 coordinates developmental and metabolic reprogramming in several phases of seedling establishment. A) Identification of H3K27me3-target genes that contribute to reversal to lipid accumulating (embryo maturation) phase in mixotrophically-grown clf swn seedlings. Comparison of gene sets marked by H3K27me3 at 3-DAG (S-P3), genes upregulated in mixotrophic cs shoot compared with respective WT (cs-S-M Up), genes upregulated in photoautotrophic cs shoot compared with respective WT (cs-S-P Up) and gene upregulated in mixotrophic compared with photoautotrophic cs shoot (cs-S-M/cs-S-P Up). Selected key regulators of embryo development are highlighted among 564 protein-coding genes. GO analysis of 564 genes that contribute to the metabolic/developmental reversal. GO display cutoff: fold enrichment > 1.5; p(Bonferroni) < 0.05. B) Identification of genes marked by H3K27me3 at 3 and/or 7-DAG that contribute to the cs shoot phenotype during photoautotrophic growth. Y-axis: fold-change (FC) H3K27me3/H3 enrichment in 7-DAG (S-P) compared with 3-DAG (S-P3) WT shoot; X-axis: FC expression of DEGs upregulated in cs (cs-S-P) compared with WT (S-P) photoautotrophic shoot. Expression log2 FC cutoff is 0.6. Each dot represents a gene: 126 genes (48 transcription factor genes—TFs) gain H3K27me3 between 3- and 7-DAG WT shoot and are upregulated in cs; 72 genes that lose H3K27me3 between 3- and 7-DAG WT shoot and are upregulated in cs; 805 genes (111 TFs) with unchanged levels of H3K27me3 between 3- and 7-DAG WT shoot are upregulated in cs. H3K27me3/H3 log2 FC cut-off is 0.6. Selected key developmental or metabolic regulators are highlighted. C) Expression of genes marked with H3K27me3 by 3 DAG. D) Expression of genes gaining H3K27me3 between 3 and 7 DAG. C) and D) qRT-PCR analysis of selected gene transcription in 3 seed development stages (“seed”: 1—mature green, 2—mature yellowing, 3—mature desiccating), dry seeds (DS) and 4 stages of seedling germination (DAG: 1, 3, 5 and 7). Representative seeds/seedlings are shown on the right. Scale bar = 0.5 mm (seed); 1 mm (seedling). Bars: mean ± SD; N = 3 biological replicates. Letters above bars: statistical significance at P < 0.05; one-way ANOVA with Bonferroni post hoc test. ND—not detected. E) H3K27me3 deposition during seed germination is independent of active photosynthesis. ChIP-qPCR of H3K27me3 enrichment at 4 stages of seedling establishment before the onset of photosynthesis: SS, germinated seed (GS), cotyledon emergence (CE) and 4-DAG dark-grown seedling. Bars: mean ± SD; N = 3 biological replicates. Letters above bars: statistical significance at P < 0.05; one-way ANOVA with Bonferroni post hoc test. Representative images of developmental stages analysed are depicted on the right. Scale bar = 0.5 mm (seed); 1 mm (seedling). F) CRISPR-Cas9 mutagenesis of ICL in clf swn genetic background (cs icl) limits the embryonic reversal in cs. RT-qPCR of ICL expression (left). Bars: mean ± SD; N = 3 technical replicates. Penetrance of positive fat-red staining phenotype (right) in cs (icl) seedlings grown in the presence of 1% sucrose. Bars: mean ± SD; N = 3 biological replicates (20 to 30 cs icl seedlings/replicate). Letters above bars: statistical significance at P < 0.05; one-way ANOVA with Bonferroni post hoc test. G) Summary of PRC2 contribution to gene repression at different phases of seedling establishment. Backgrounds represent seed (heterotrophic—yellow) to seedling (photoautotrophic—green) transition. Gray and red lines/font represent increase in H3K27me3 (transcriptional repression) before 3-DAG and between 3 and 7 DAG, respectively. Purple line/font represent decrease in H3K27me3 (transcriptional activation) between 3 and 7 DAG. Representative developmental seed and seedling stages are shown in the bottom; these illustrative images are also used in panel B and in Fig. 1B. DAG—day after germination.

References

    1. Aichinger E, Villar CBR, Farrona S, Reyes JC, Hennig L, Köhler C. CHD3 proteins and polycomb group proteins antagonistically determine cell identity in Arabidopsis. PLoS Genet. 2009:5(8):e1000605. 10.1371/journal.pgen.1000605 - DOI - PMC - PubMed
    1. Andrews S. FastQC: a quality control tool for high throughput sequence data. 2010. https://www.bioinformatics.babraham.ac.uk/projects/fastqc/.
    1. Arsovski AA, Galstyan A, Guseman JM, Nemhauser JL. Photomorphogenesis. Arabidopsis Book. 2012:10(2):e0147. 10.1199/tab.0147 - DOI - PMC - PubMed
    1. Baile F, Gómez-Zambrano ”, Calonje M. Roles of polycomb complexes in regulating gene expression and chromatin structure in plants. Plant Commun. 2022:3(1):100267. 10.1016/j.xplc.2021.100267 - DOI - PMC - PubMed
    1. Baile F, Merini W, Hidalgo I, Calonje M. EAR domain-containing transcription factors trigger PRC2-mediated chromatin marking in Arabidopsis. Plant Cell. 2021:33(8):2701–2715. 10.1093/plcell/koab139 - DOI - PMC - PubMed

MeSH terms

LinkOut - more resources