

Estimating pain visual analogue scale from health assessment questionnaire for rheumatoid arthritis with beta mixture models
- PMID: 40515832
- PMCID: PMC12167326
- DOI: 10.1007/s00296-025-05897-1
Estimating pain visual analogue scale from health assessment questionnaire for rheumatoid arthritis with beta mixture models
Abstract
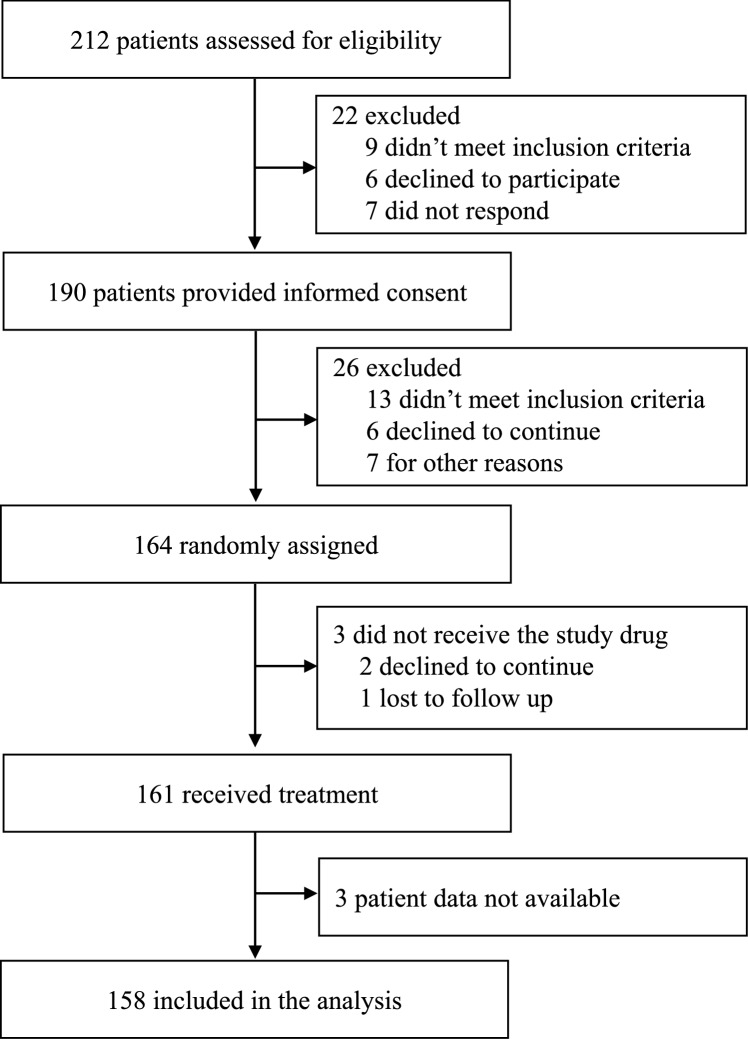
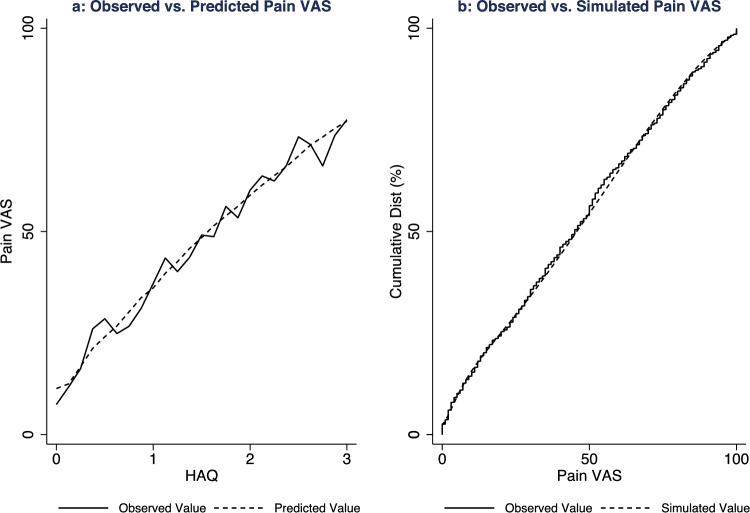
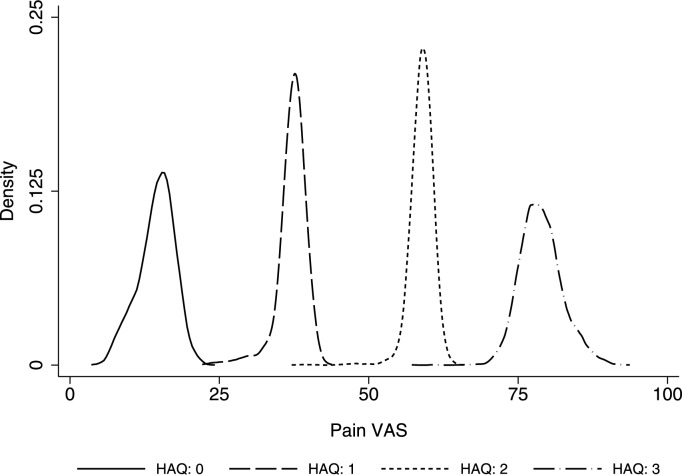
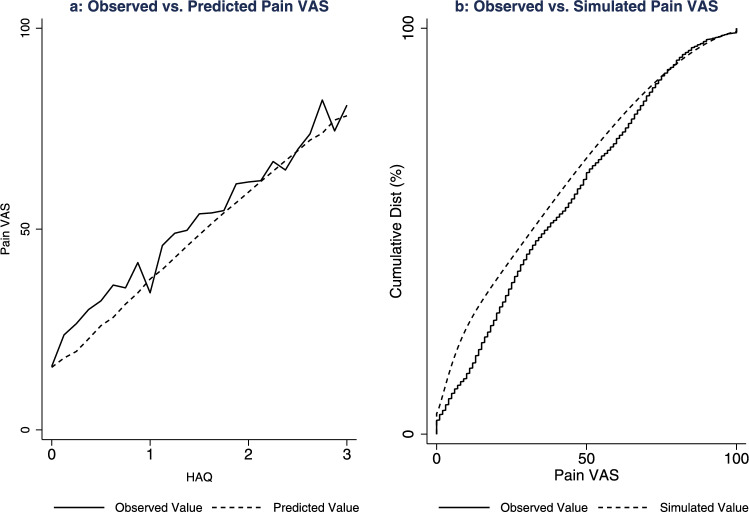
To map from the health assessment questionnaire disability index (HAQ) to the pain visual analogue scale (VAS) for people with rheumatoid arthritis. The estimation sample comprised adults with rheumatoid arthritis and inadequate response to tumour necrosis factor-α inhibitors in a multicentre phase 4 randomised controlled trial. Beta mixture models were estimated with combinations of HAQ and its square, age and sex as independent variables. Bayesian Information Criteria informed the number of components. Model performance (root mean squared error; mean absolute error; pseudo-R2) was estimated by k-fold cross validation. Graphs illustrated mean observed and predicted pain VAS, and cumulative distribution of observed and simulated pain VAS values. For face validity, a probabilistic analysis simulated 5000 pain VAS values at four HAQ scores. For external validation, the performance of the preferred specification was assessed using the Rheumatoid Arthritis Medication Study cohort. There were 1055 observations from 158 participants in the estimation sample (mean age: 55.8; 81% female; mean HAQ: 1.72). The preferred specification was a two-component beta mixture model (probability variables: HAQ, age, sex; main regression variable: HAQ). Visual plots illustrated good fit across the HAQ distribution, and a similar cumulative distribution of observed and predicted pain VAS values. Probabilistic analysis demonstrated that the preferred specification handled uncertainty appropriately. External validation demonstrated that the preferred specification performed well in an independent dataset. Beta mixture models provide accurate non-linear estimates of pain VAS from HAQ scores to support evidence synthesis and resource allocation decision-making for people with rheumatoid arthritis.
Keywords: Beta mixture model; Health assessment questionnaire; Mapping; Pain; Patient-reported outcomes; Rheumatoid arthritis; Visual analogue scale.
© 2025. The Author(s).
Conflict of interest statement
Declarations. Conflict of interest: SPG, SC, FR, ZI, MS, KP, and DP declare no conflicts of interest. AB reports receiving grant funding from Pfizer and BMS, and speaker fees from Galapagos. CP reports receiving honoraria and/or research & development grants from: AbbVie, AnaptysBio, BMS, Janssen/J&J, Kiniksa, Novartis, Pfizer, Sanofi, Roche, and UCB. Ethical approval: All individuals in the R4RA trial dataset and the RAMS external validation dataset provided written informed consent to participate. Ethical approval for the R4RA trial was attained by the institutional review board of each study centre or relevant independent ethics committee (UK Medical Research and Ethics Committee, reference no. 12/WA/0307). Ethical approval for the RAMS study was attained by the Central Manchester NHS Research Ethics Committee (reference 08/H1008/25).
Figures
References
Publication types
MeSH terms
Substances
Grants and funding
LinkOut - more resources
Full Text Sources
Medical
