. 2025 Jun 24;44(6):115832.
doi: 10.1016/j.celrep.2025.115832. Epub 2025 Jun 12.

Transplants foster B cell alloimmunity by relaying extracellular vesicles to follicular dendritic cells

Affiliations

Transplants foster B cell alloimmunity by relaying extracellular vesicles to follicular dendritic cells

Rao Chen et al. Cell Rep. .

Abstract

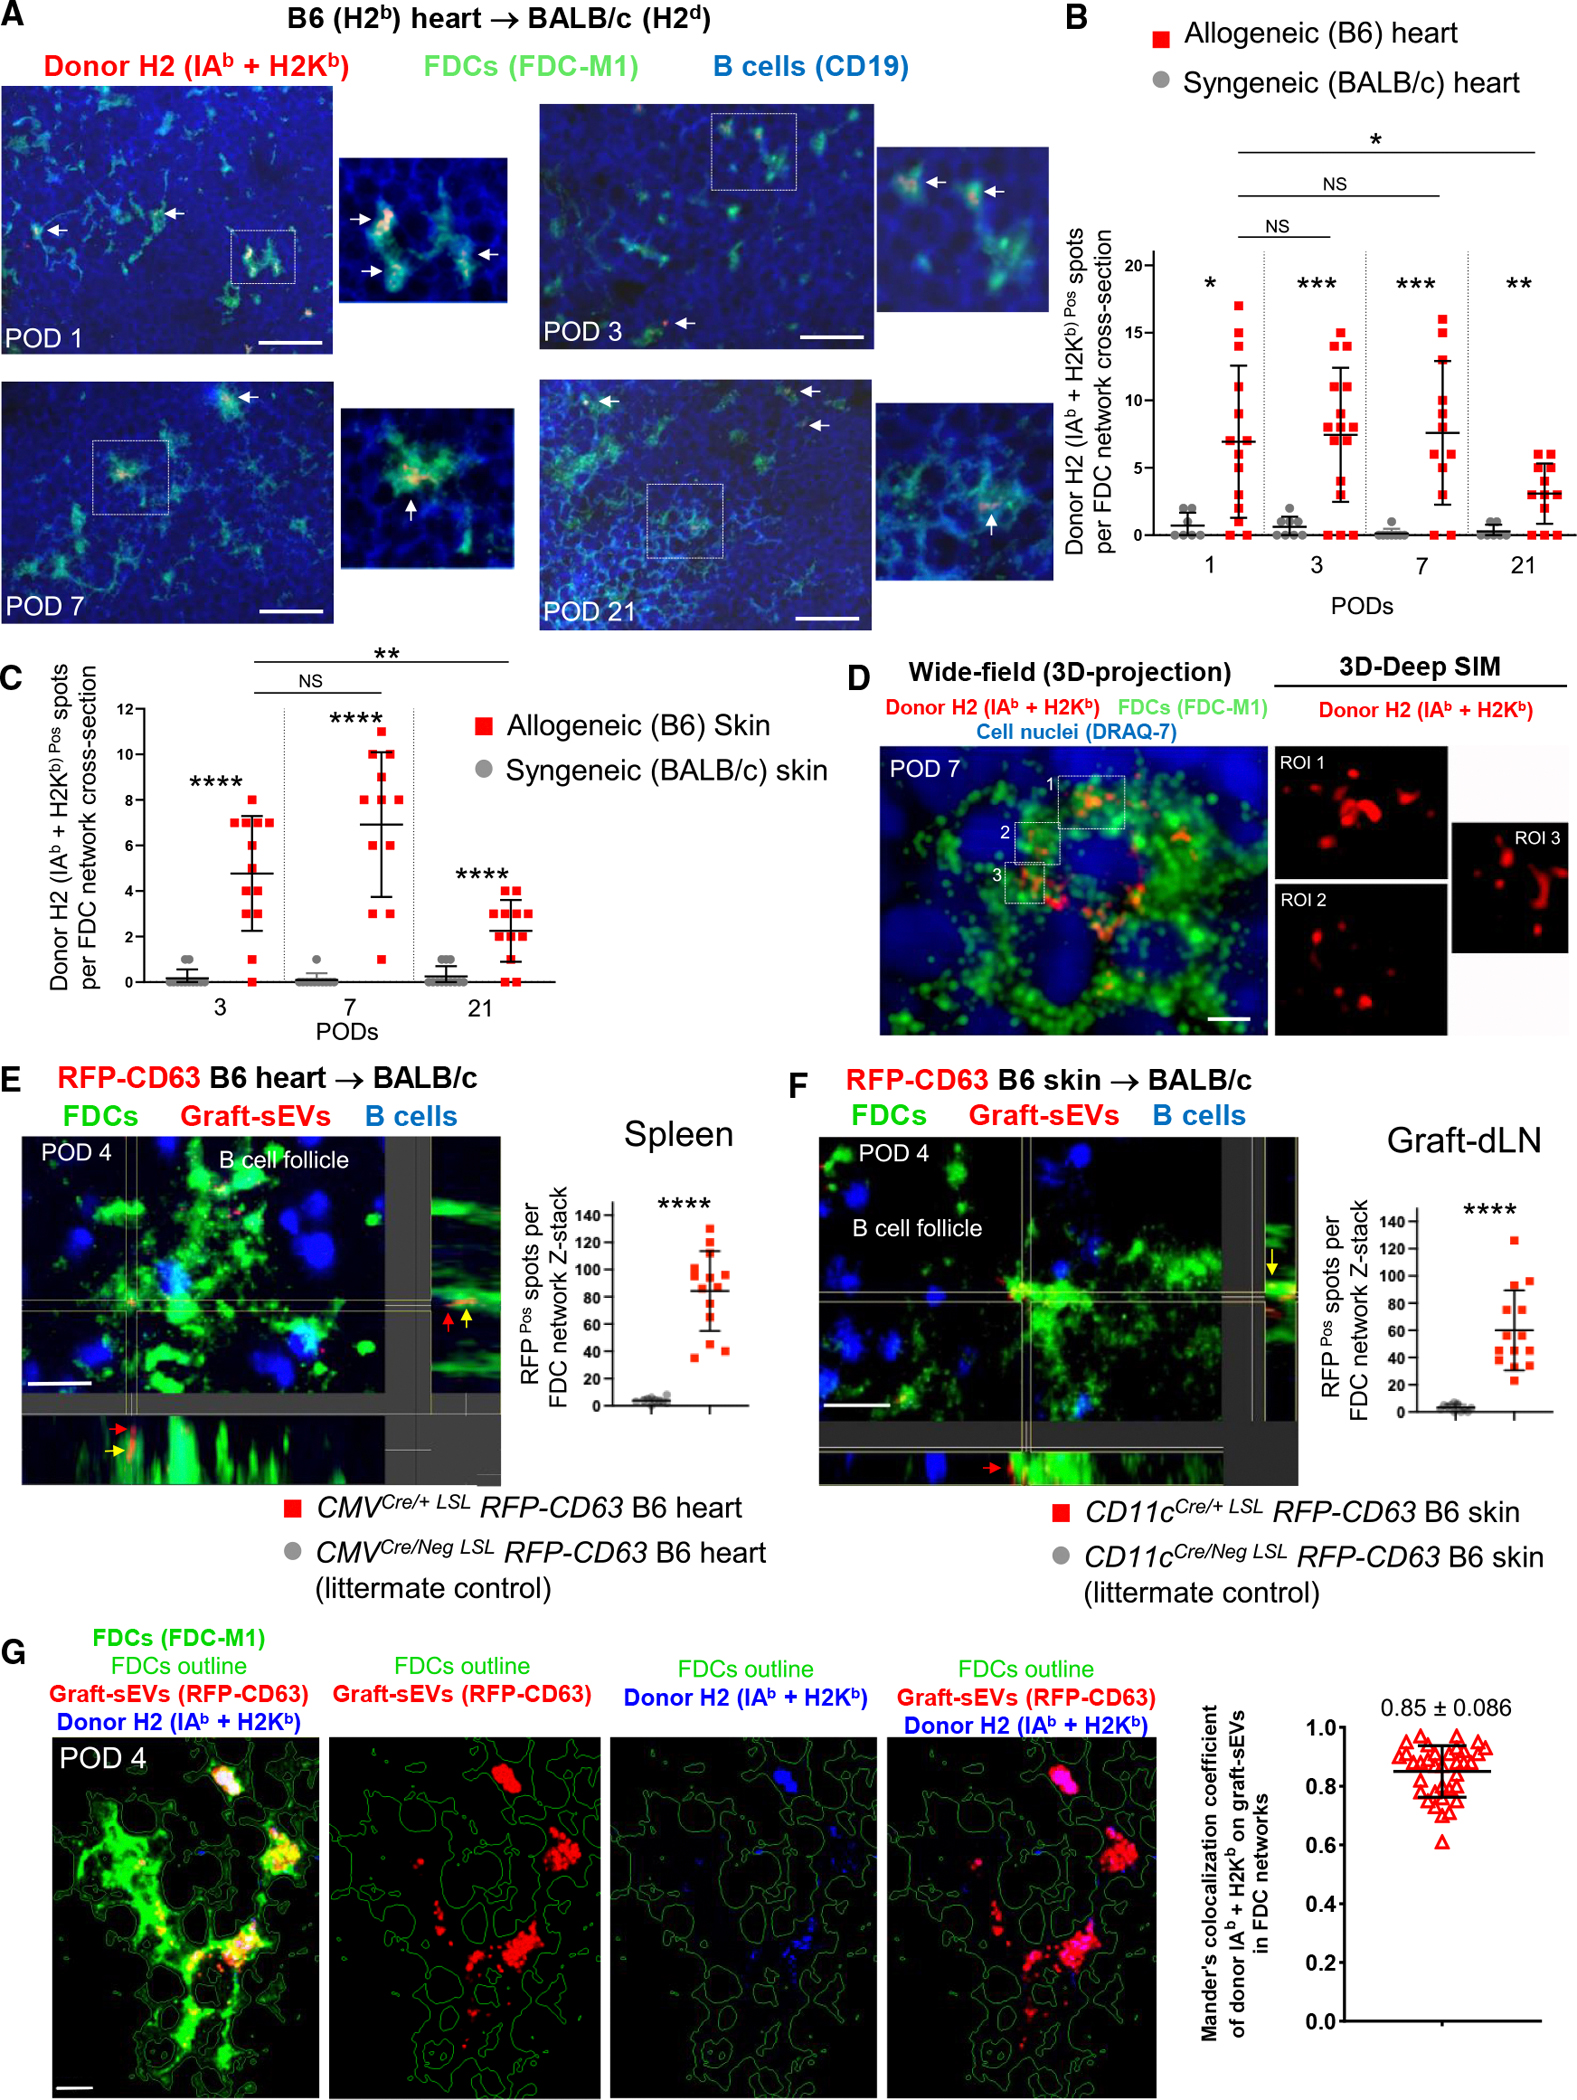
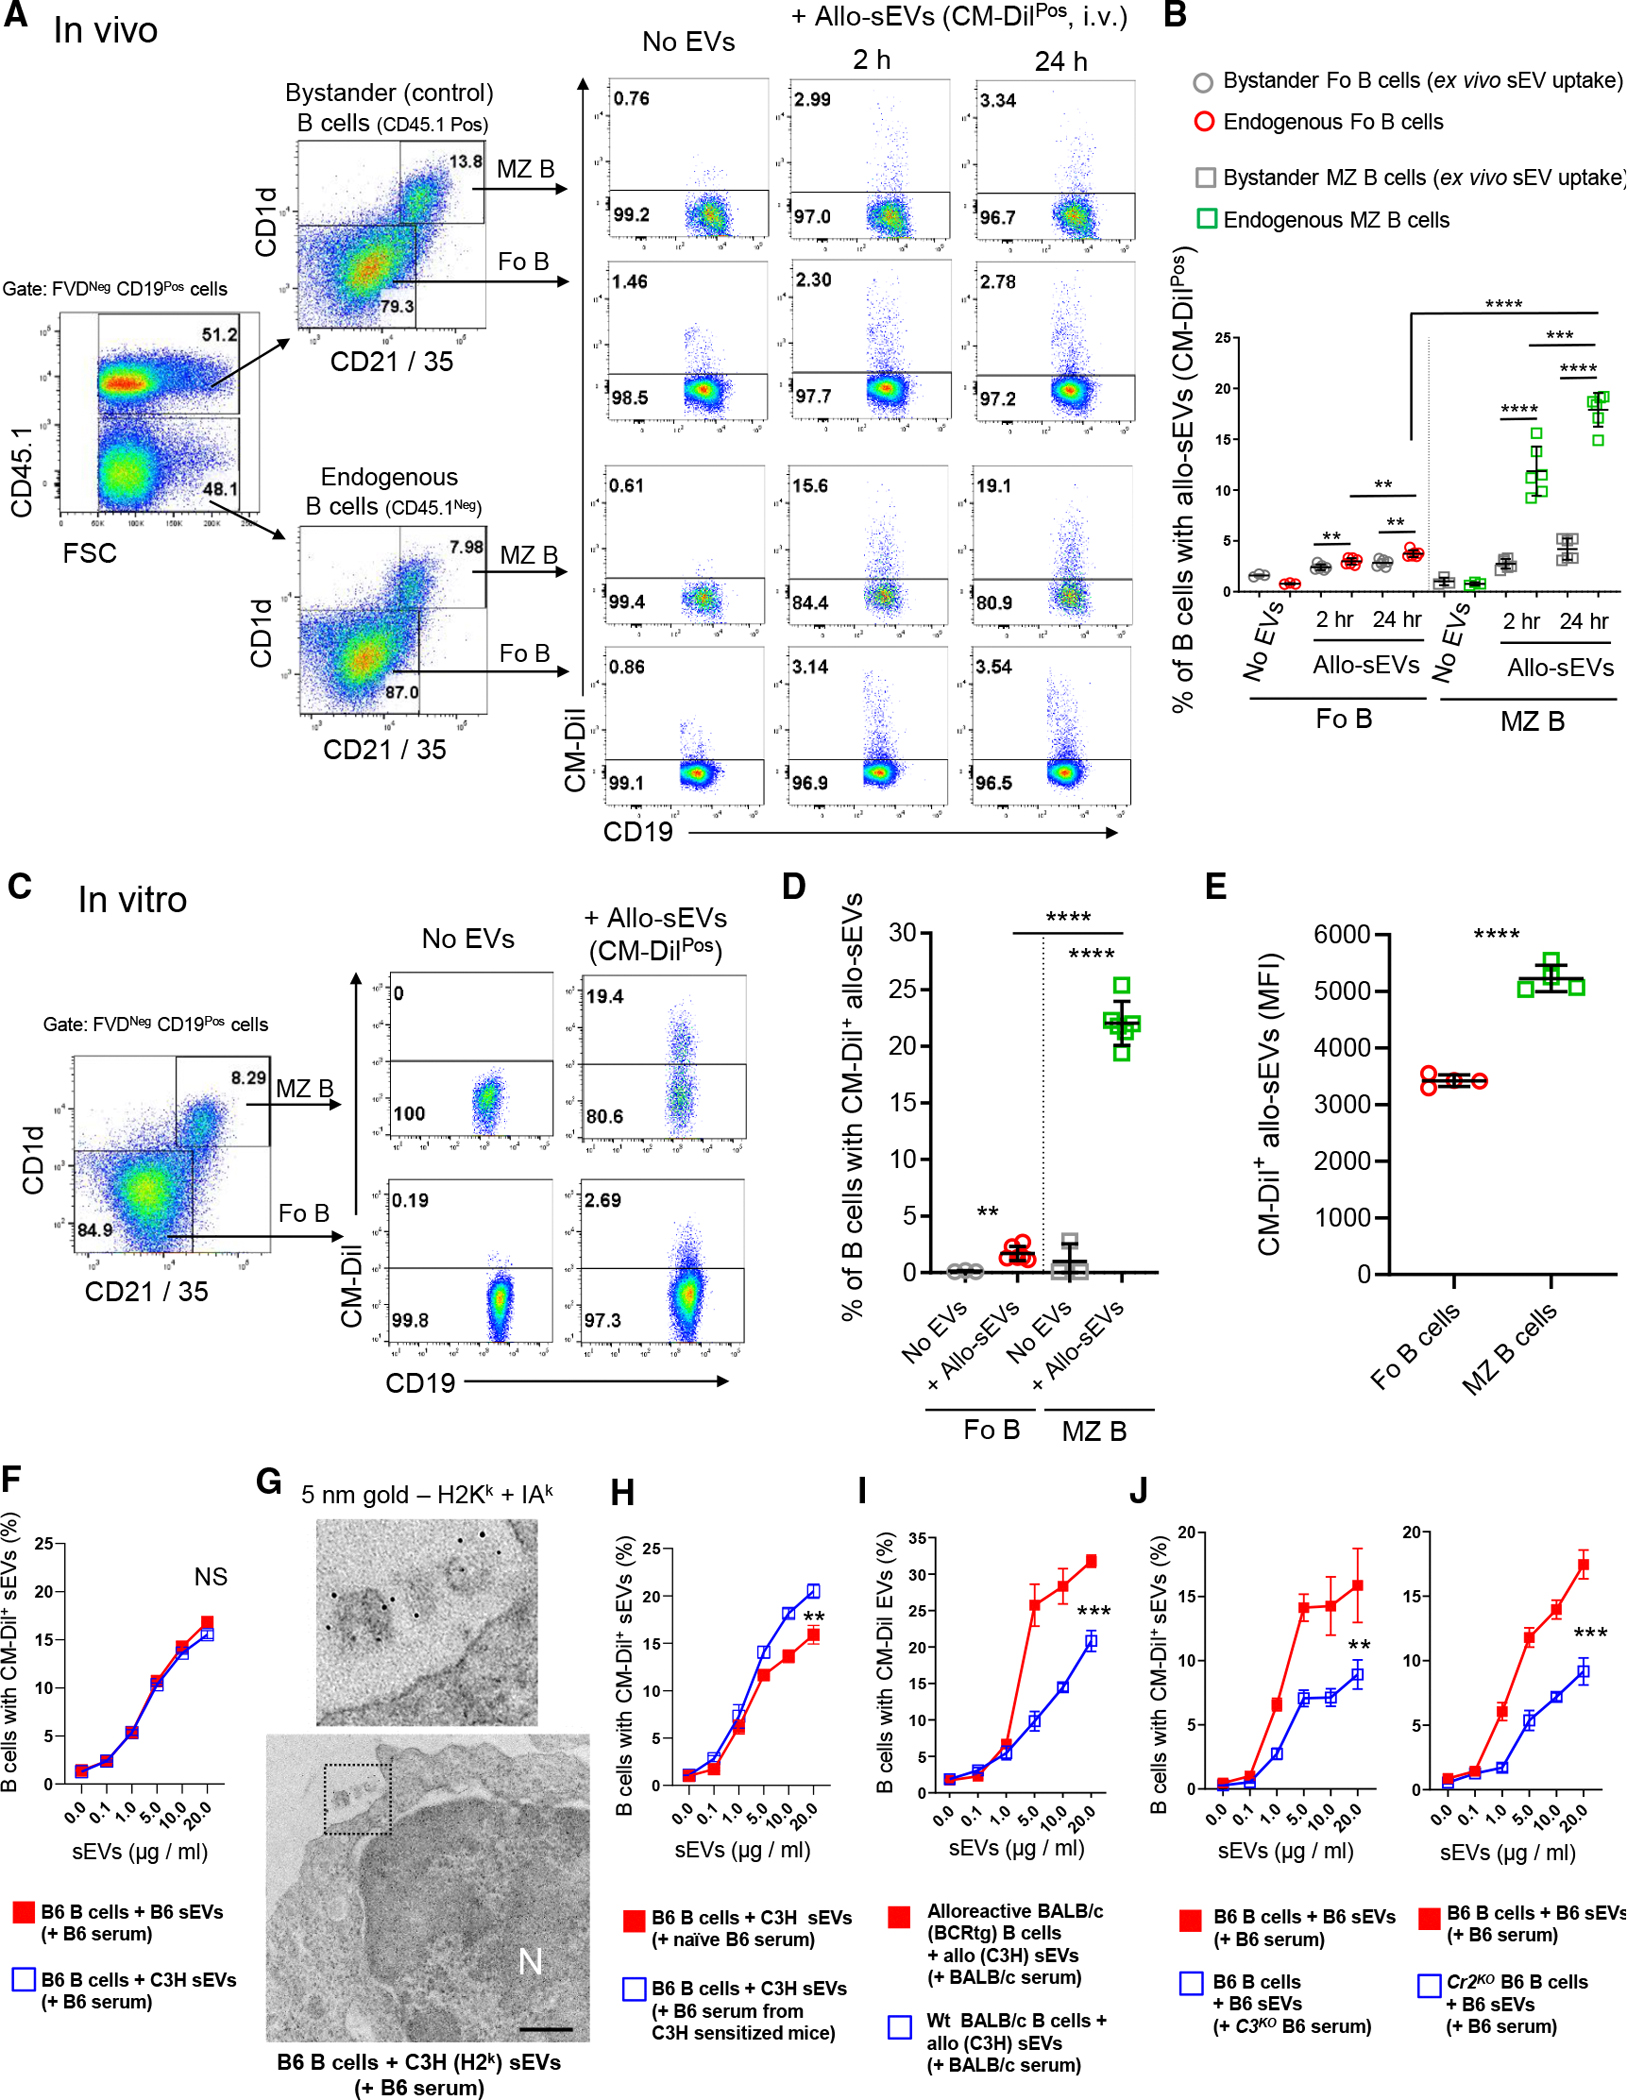
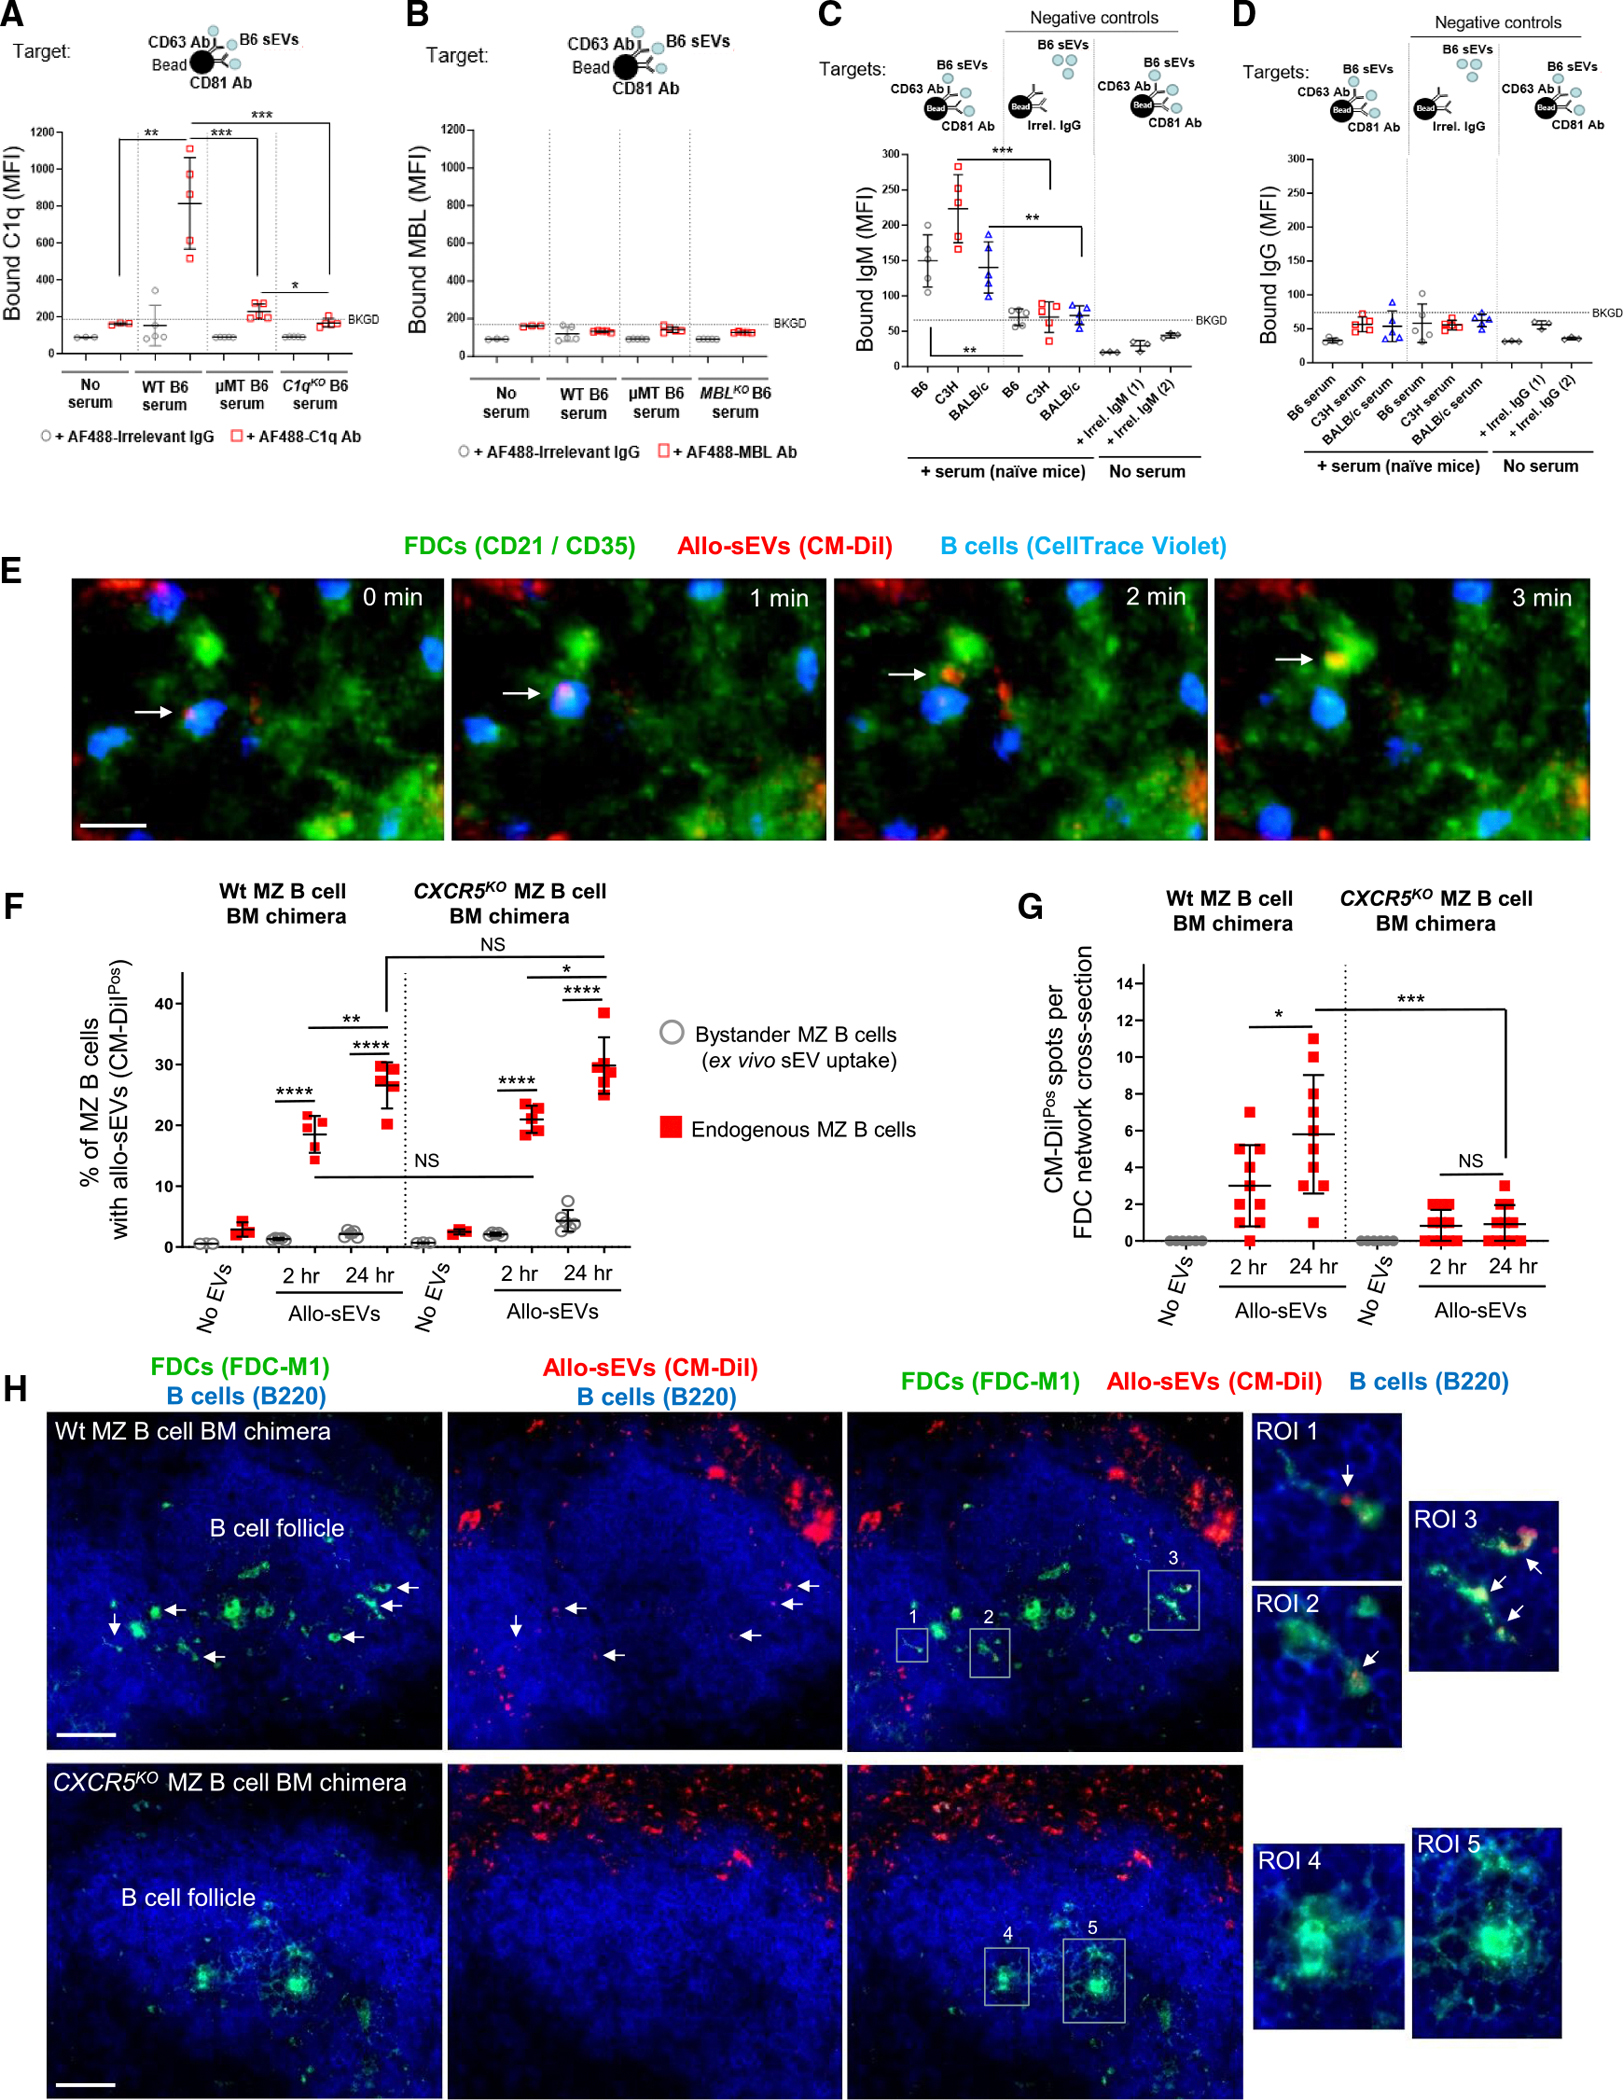
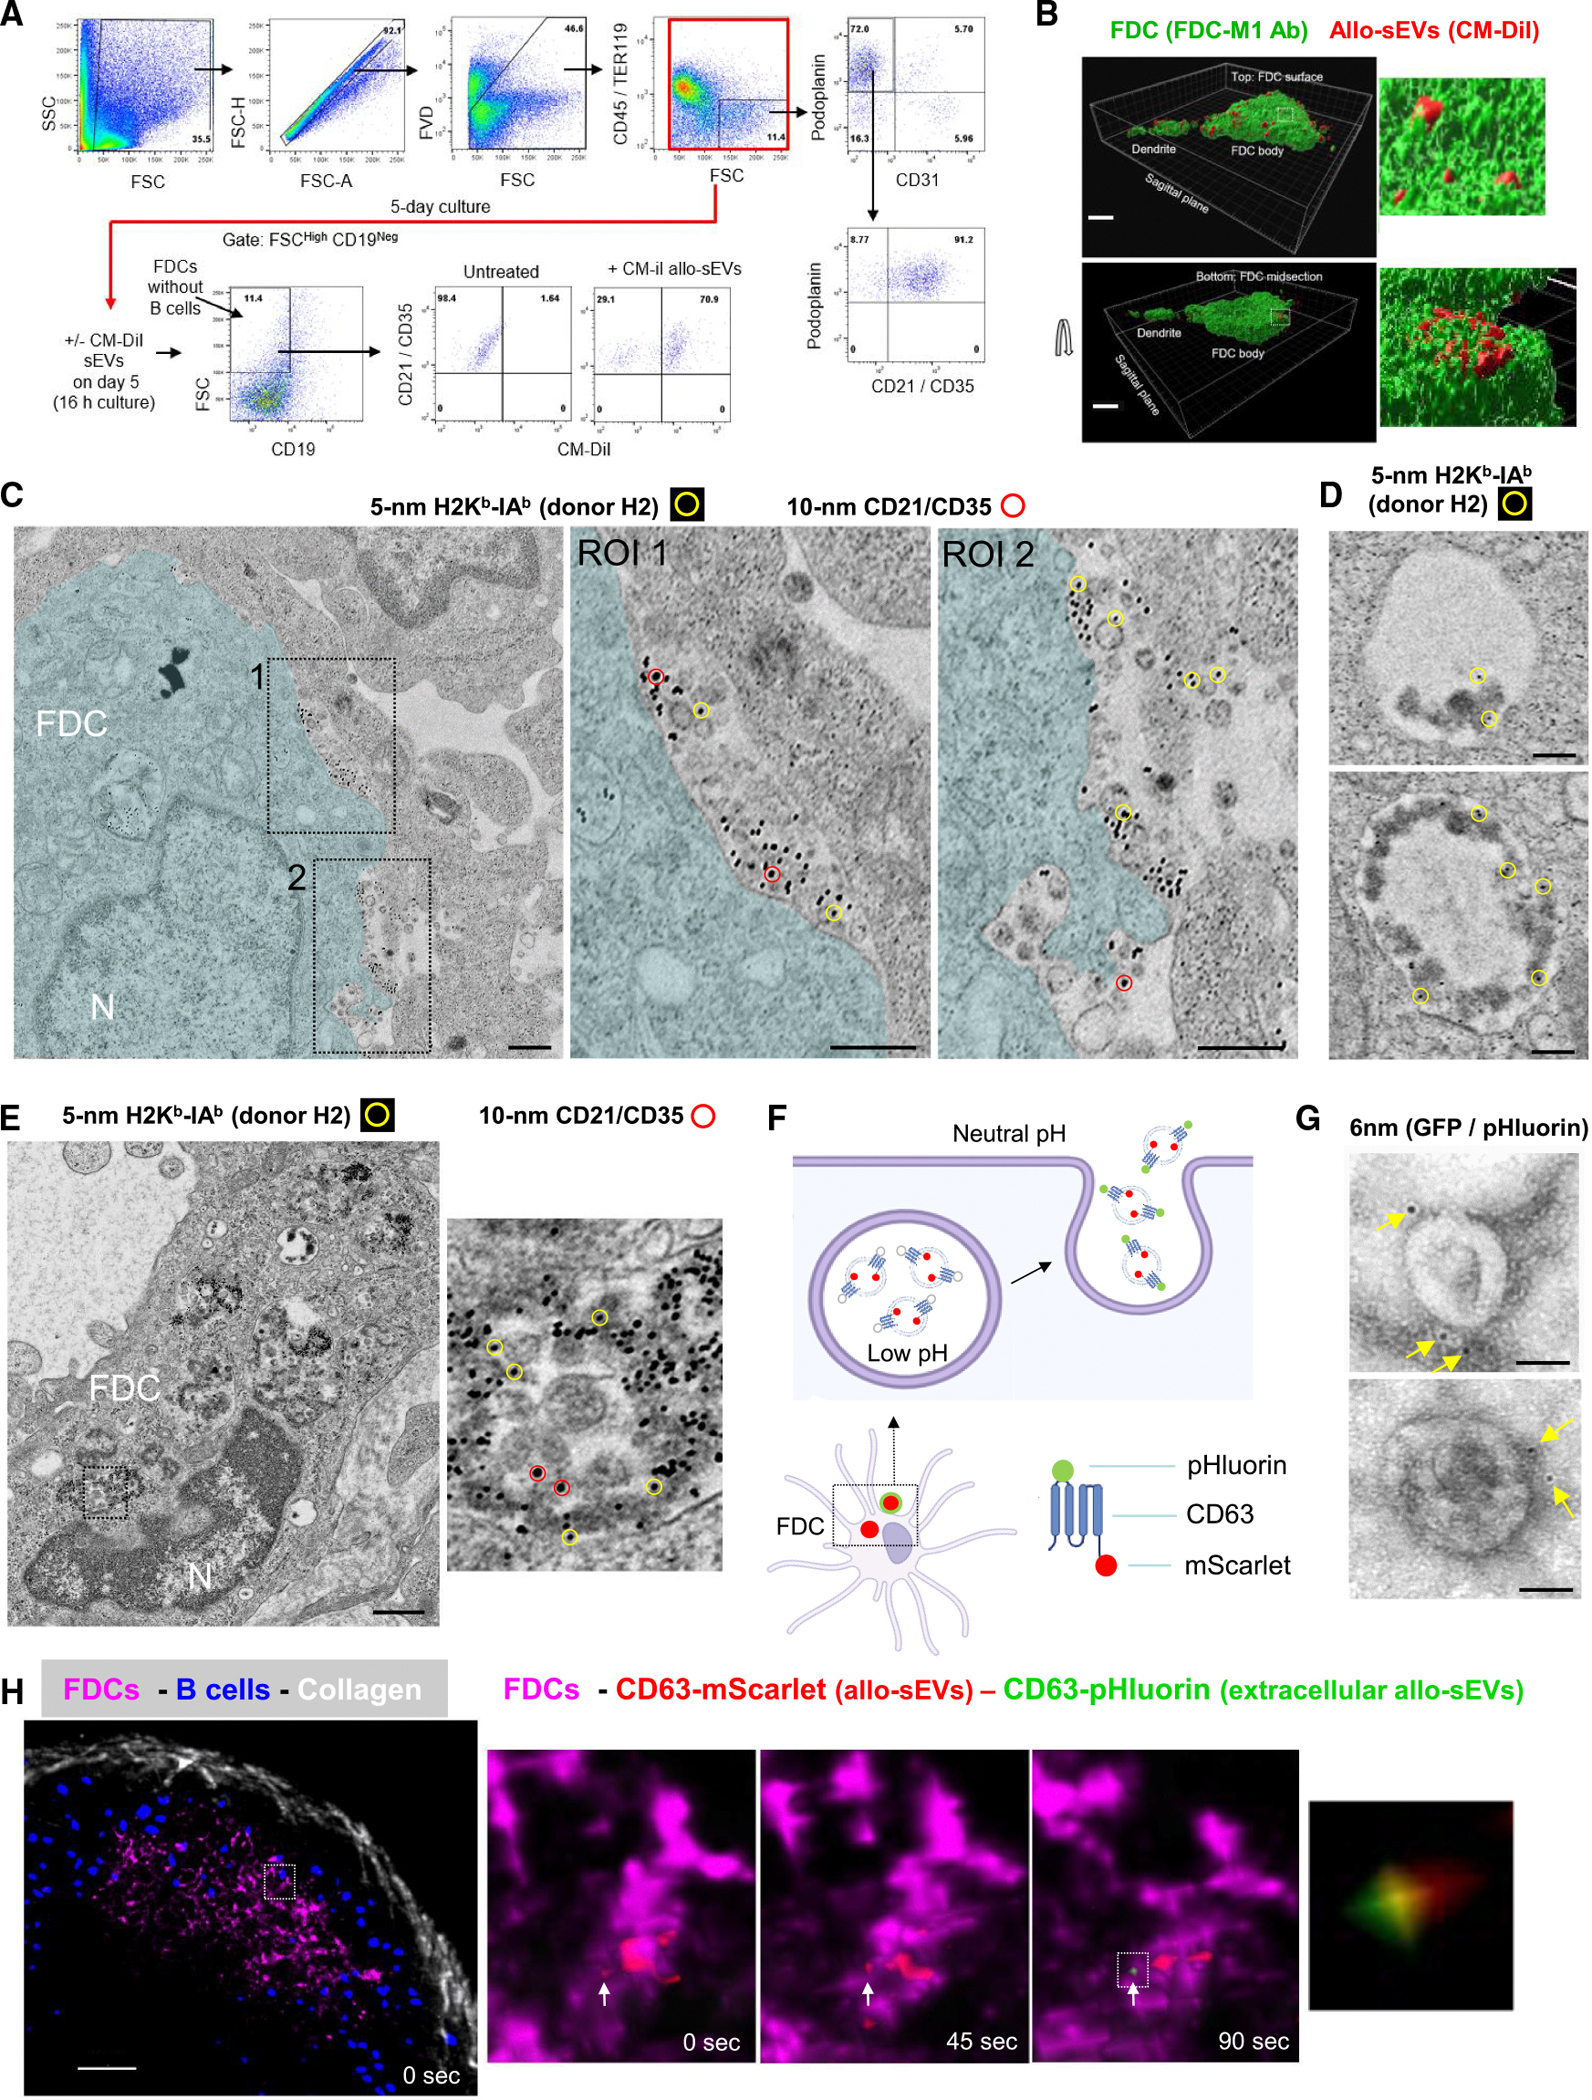
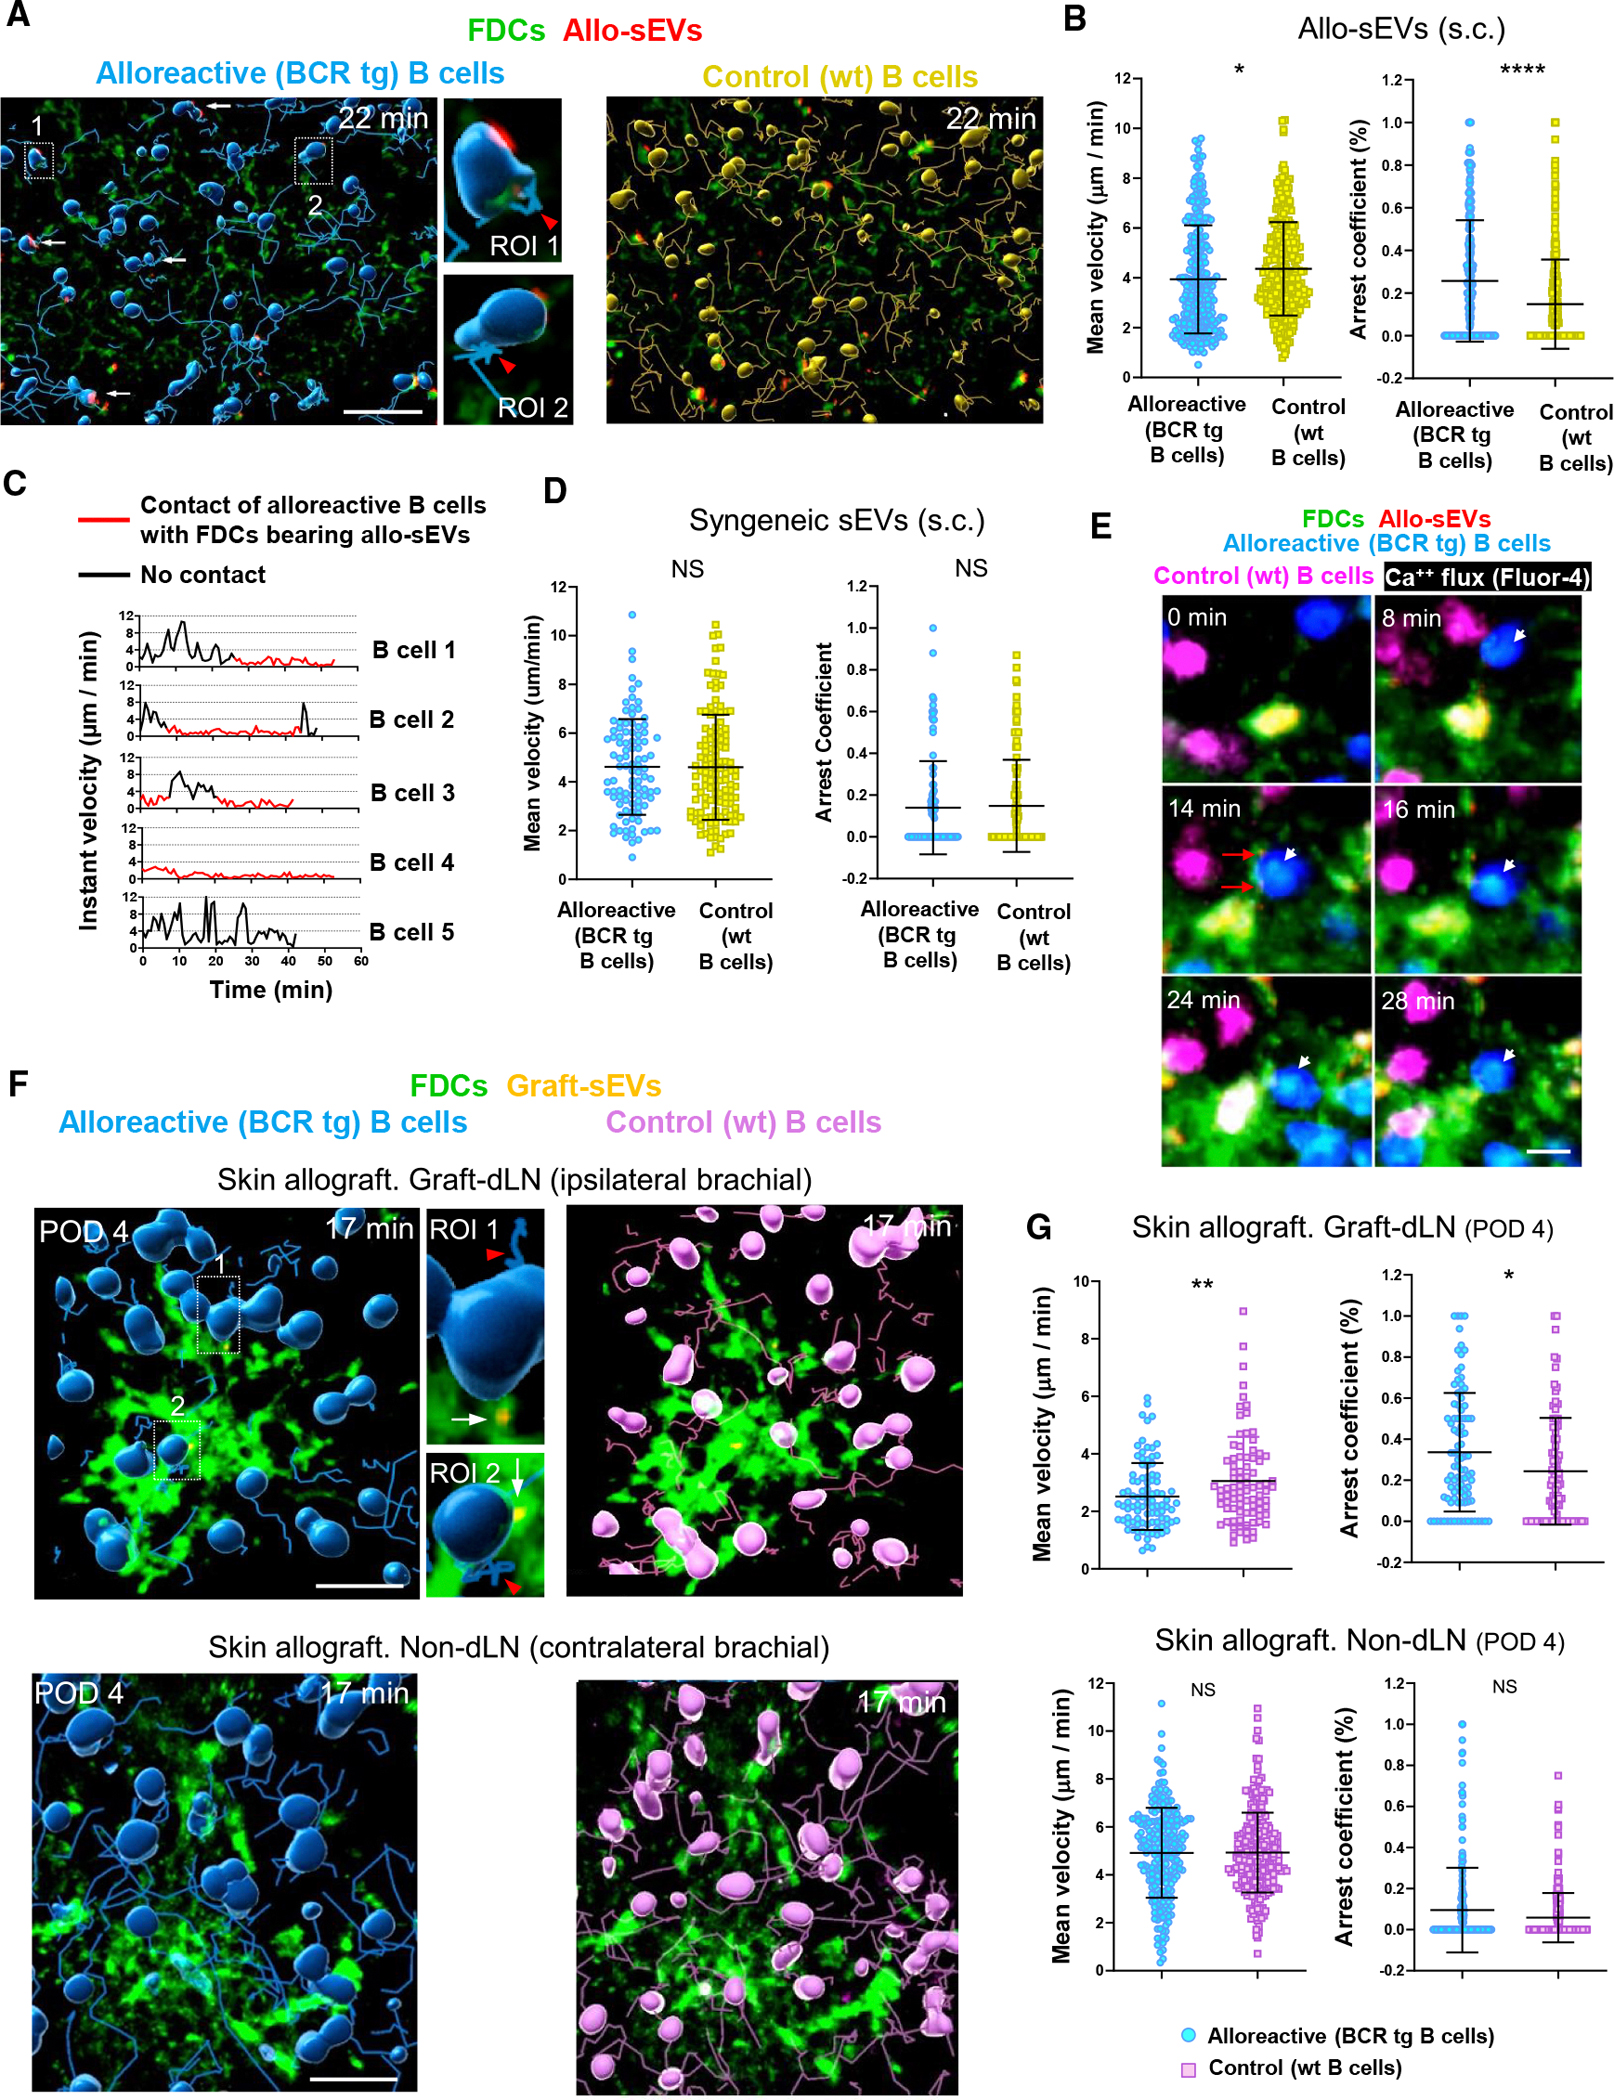
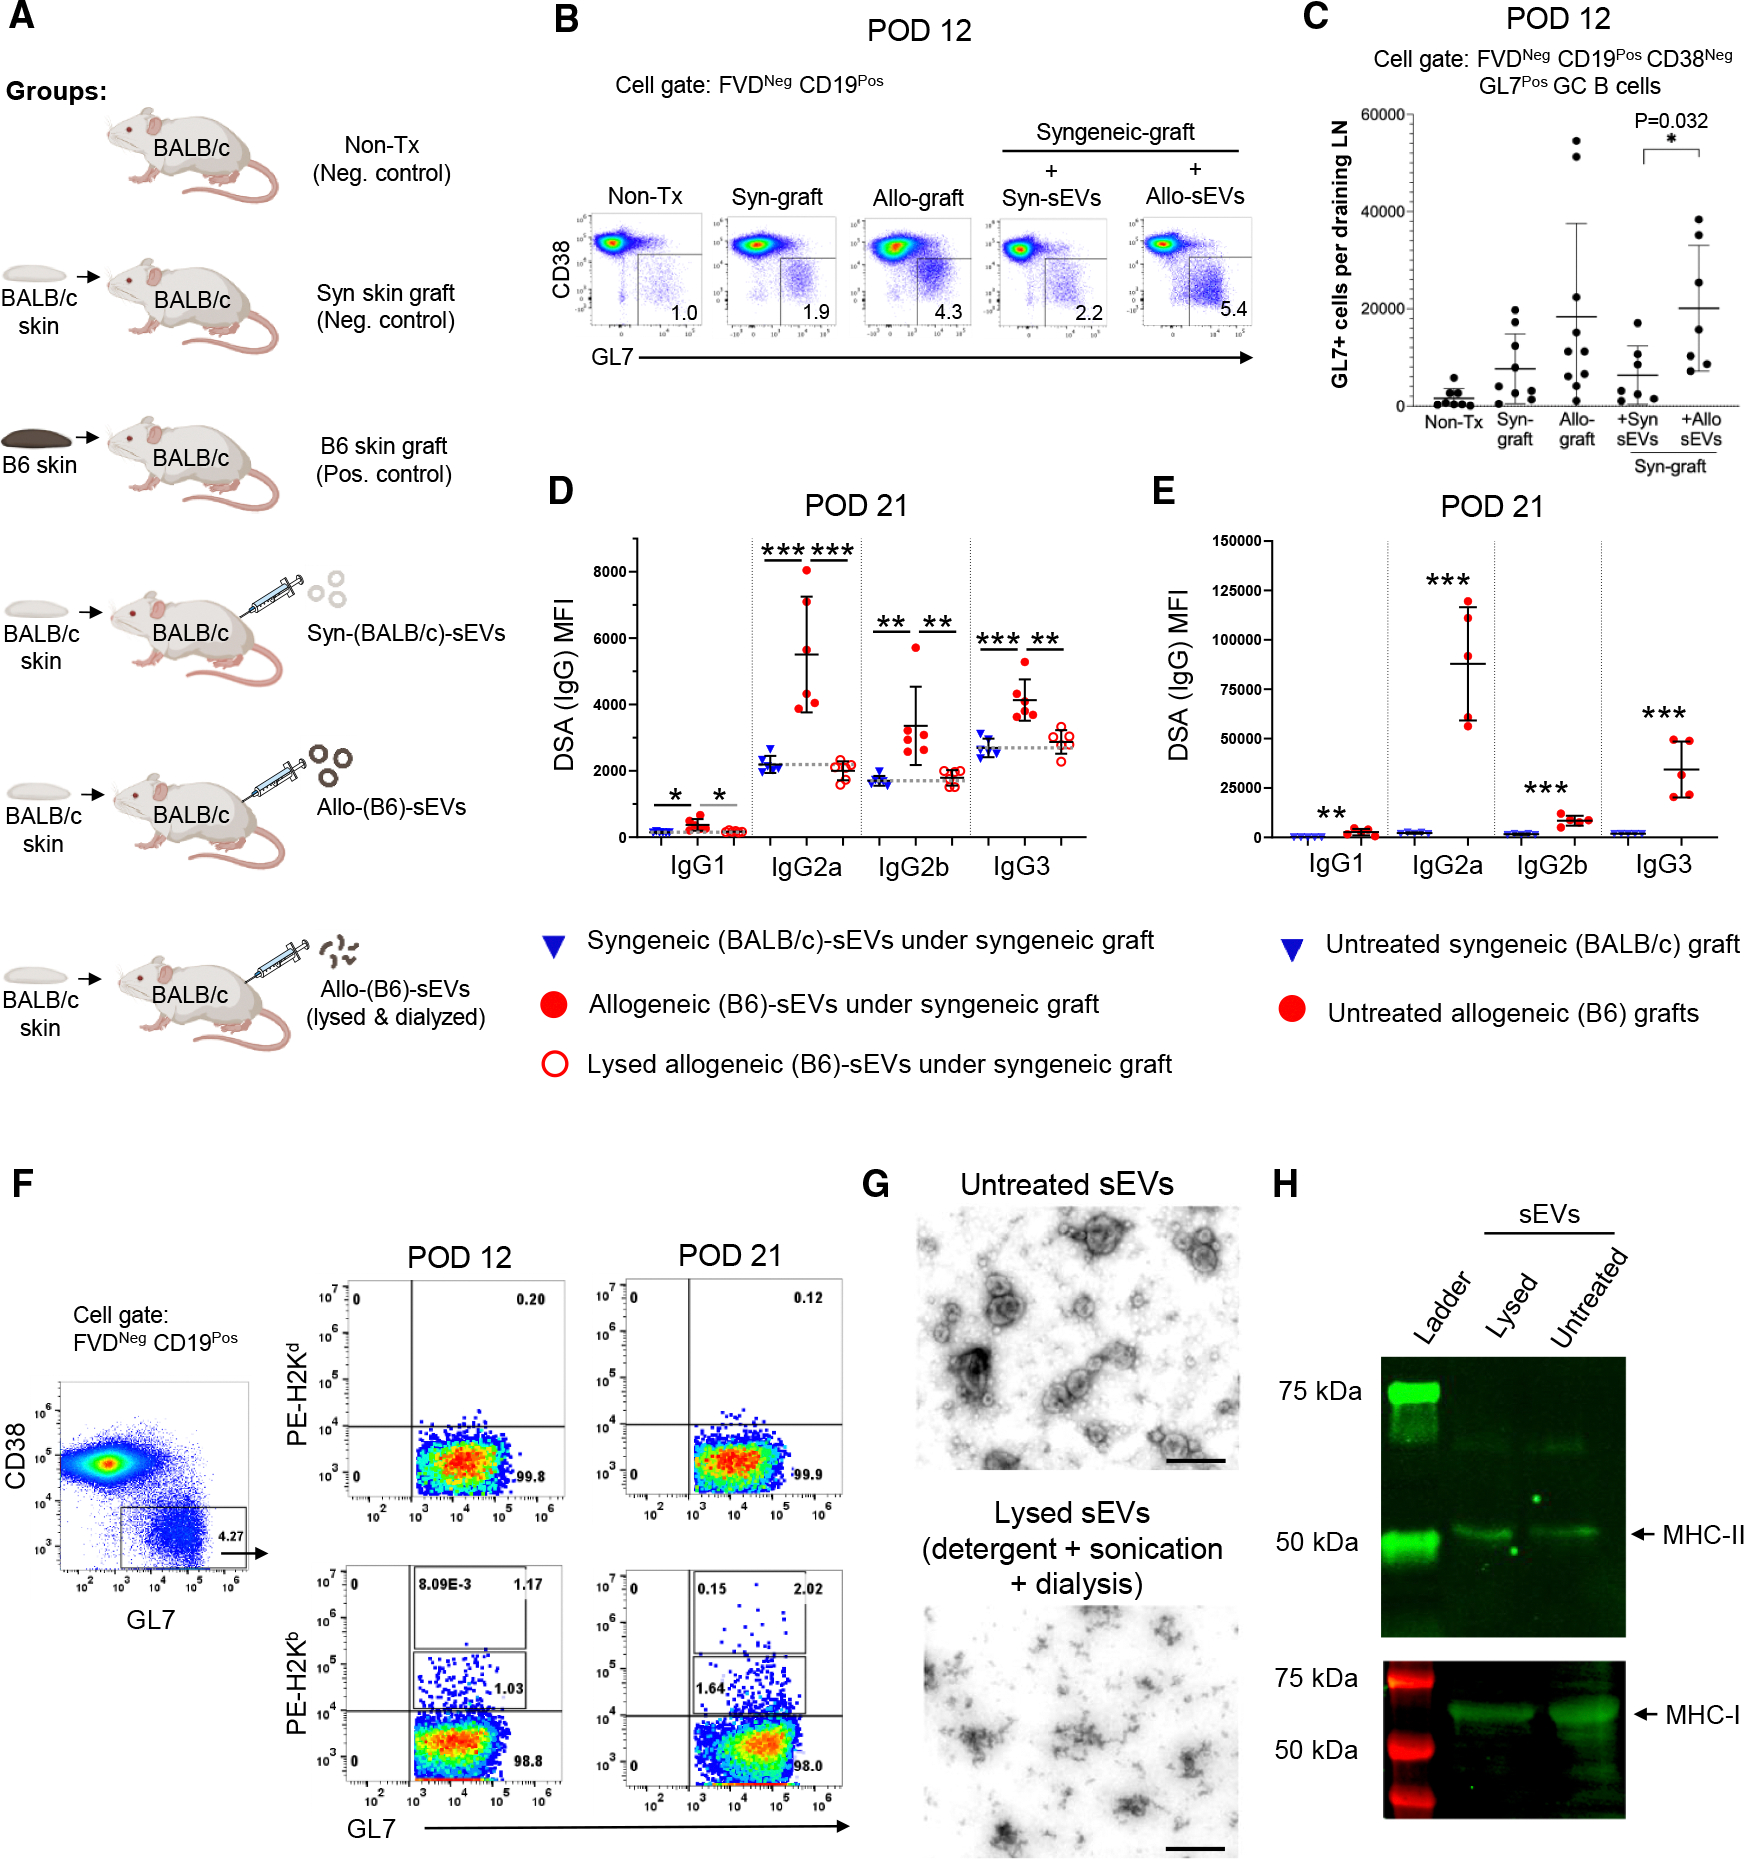
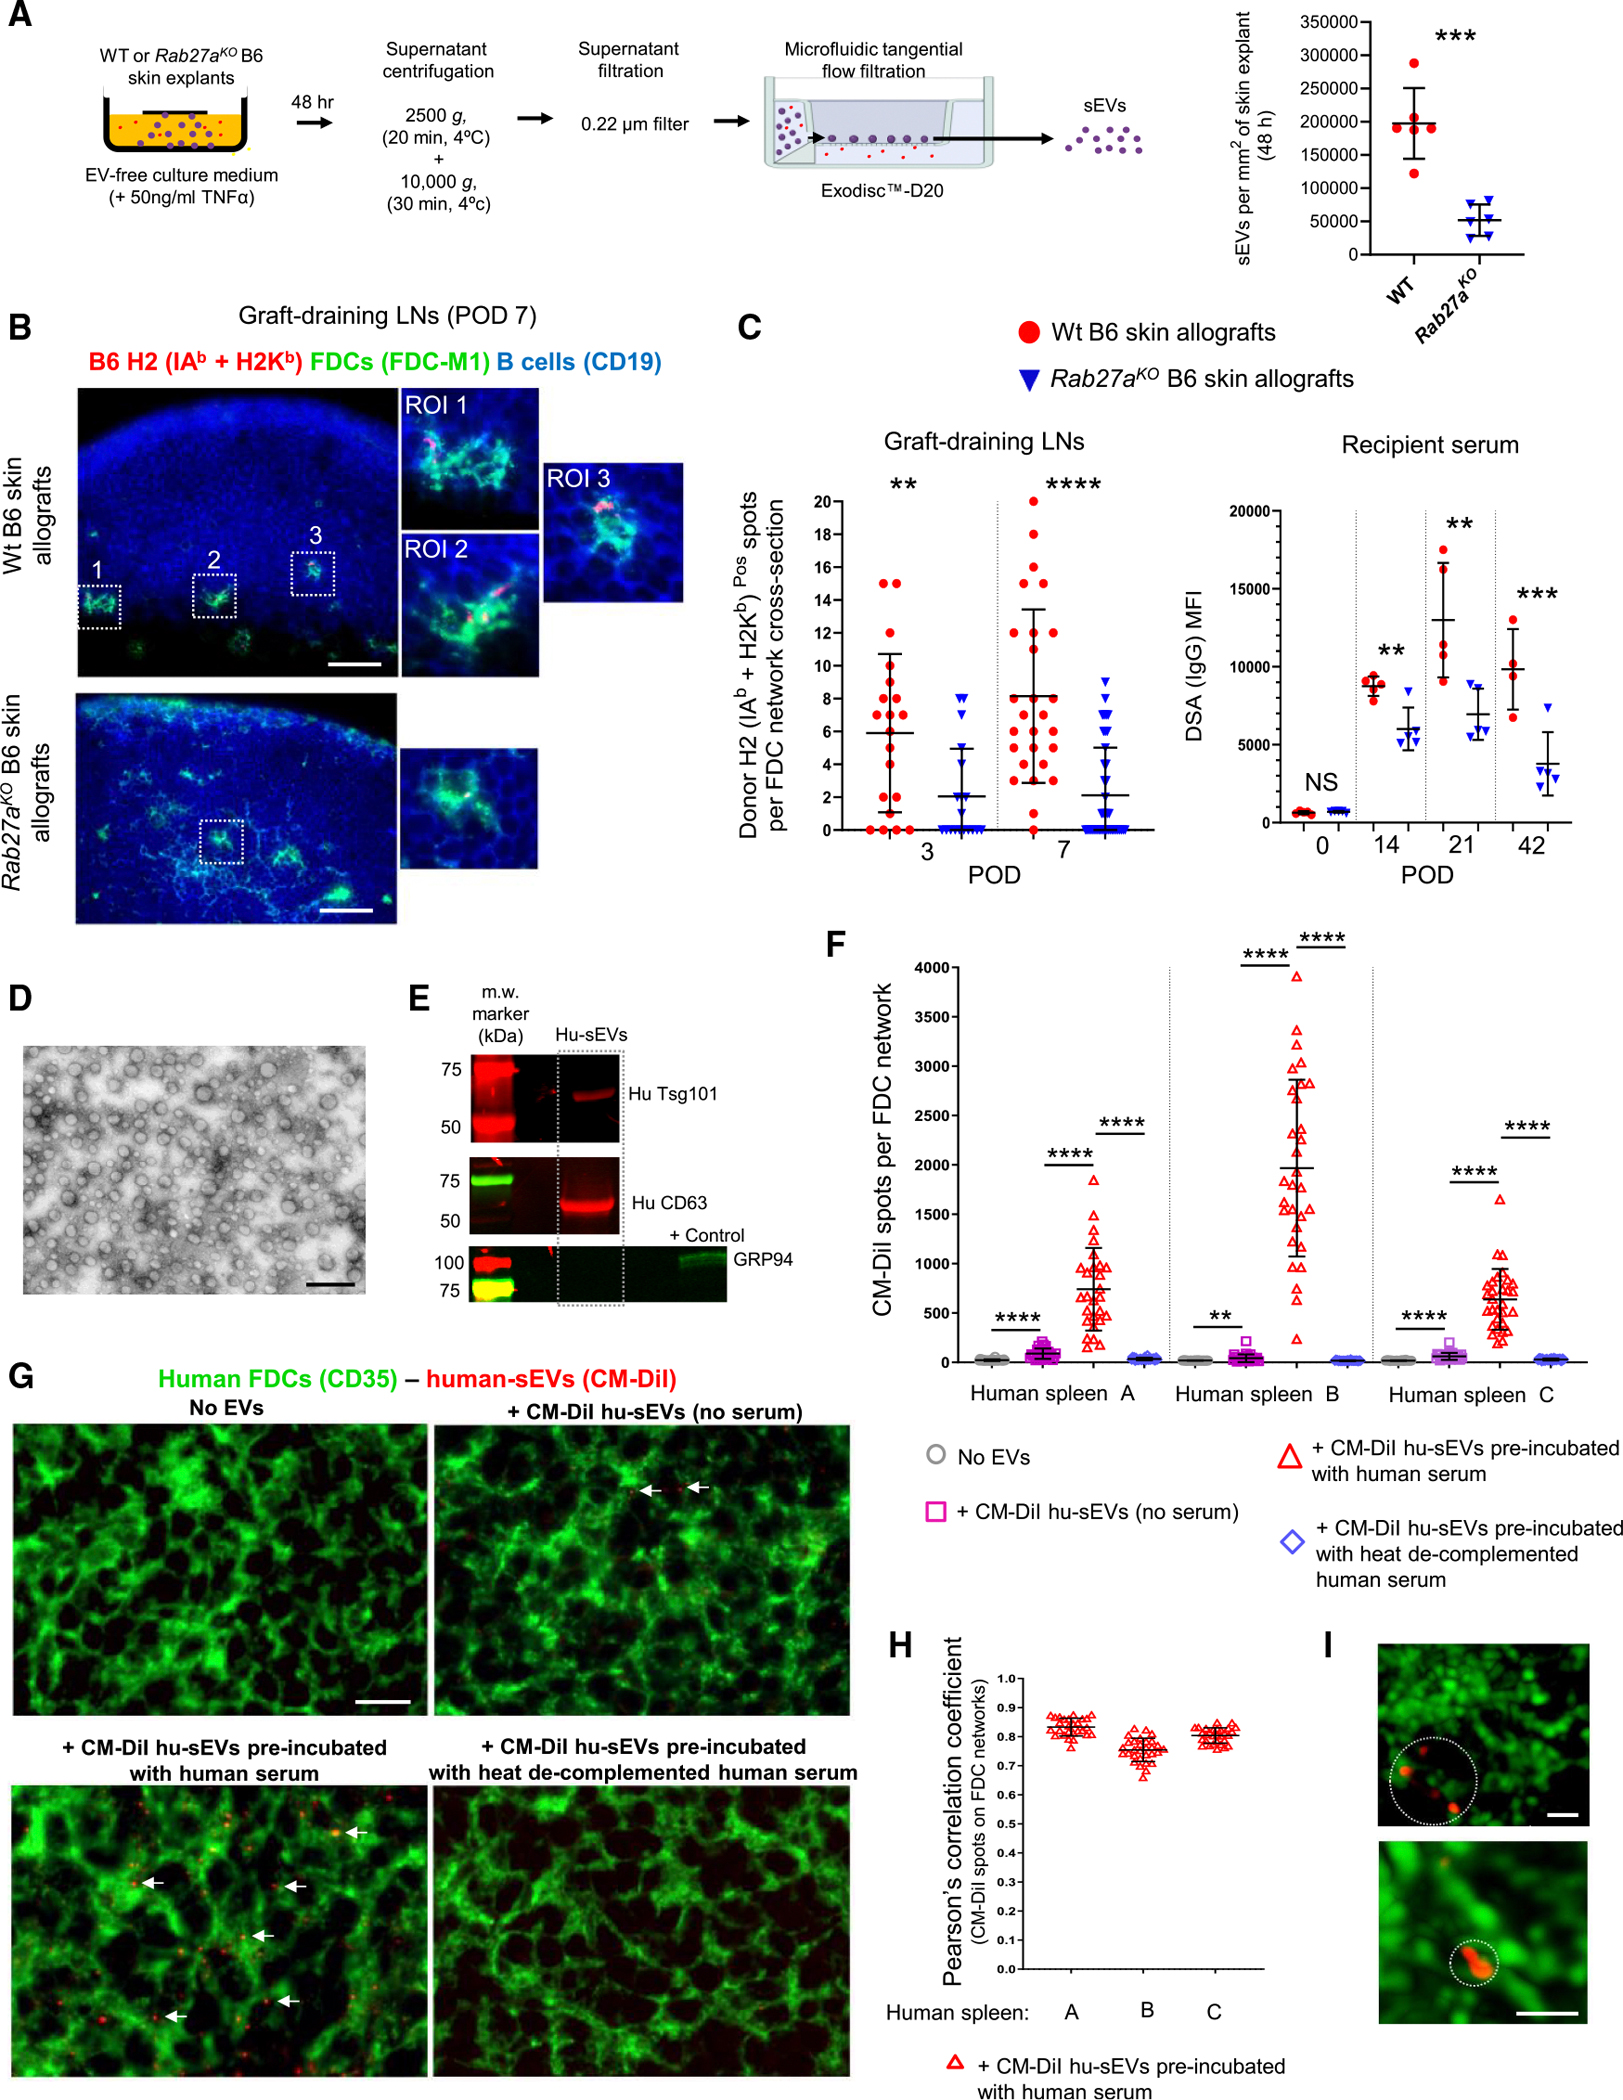
B cells play fundamental roles in transplant rejection. However, how allogeneic (allo)-antigens (Ags) are transported from allografts to follicular dendritic cells (FDCs) in lymphoid tissues for development of B cell responses remains unknown. We demonstrated that graft allo-Ags are relayed to FDCs via small extracellular vesicles (sEVs), which activate complement via immunoglobulin M (IgM) bound to vesicle phospholipids. Complement-opsonized allo-sEVs bind splenic marginal-zone B cells that shuttle the vesicles to FDCs, which retain and recycle the allo-sEVs so they are recognized by B cells. Accordingly, graft release of allo-sEVs promoted allo-major histocompatibility complex (MHC) accumulation in FDCs, germinal center formation, Ig switch and affinity maturation, and donor-specific antibodies, which decreased in allografts with impaired sEV secretion or when allo-Ags were delivered via disrupted sEVs. Importantly, human spleen FDCs bound allo-sEVs opsonized with human serum bearing active complement. Our findings provide insight into the mechanisms that lead to antibody-mediated rejection, for which there are no FDA-approved therapies.

Keywords: ABMR; CP: Immunology; allorecognition; antibody-mediated rejection; complement; donor-specific antibodies; exosomes; extracellular vesicles; follicular dendritic cells; natural antibodies; transplant rejection.


Conflict of interest statement

Declaration of interests The authors declare no competing interests.

Figures

Figure 1.
Figure 1.. Donor allo-Ags are relayed to FDCs in graft-dSLTs
(A) Donor H2 Ag in splenic FDCs (inset, arrows) after transplantation of B6 (H2b) hearts in BALB/c mice. Original magnification ×200. Scale bars, 20 μm. (B) Quantification with ImageJ of donor H2 Ag spots per FDC network on spleens of BALB/c mice transplanted with B6 hearts. (C) Donor H2 Ag spots per FDC network on BALB/c LNs draining B6 skin allografts assessed using ImageJ. (D) Deep SIM of donor H2 Ag spots in FDCs of a BALB/c LN draining a B6 skin graft. Scale bar, 2 μm. ROI, region of interest. (E and F) 2P-microscopy of FDCs in the spleen of a BALB/c mouse transplanted with a B6 heart releasing RFP-sEVs (E) and a BALB/c LN draining a B6 skin graft releasing RFP-sEVs (F). Arrows: graft-RFP-sEVs on the surface (red) or inside (yellow) of FDCs (green). CellTrace Violet-B cells indicate B cell follicles. FDCs were labeled with AF488-CD21/CD35 Ab. Original magnification ×25. Scale bars, 20 μm. (G) Colocalization by confocal microscopy of donor (B6, IAb + H2Kb) allo-Ags in FDCs of LNs draining CMVCre/+ LSL-RFP-CD63 B6 skin grafted in BALB/c mice. Scale bar, 10 μm. Mander’s colocalization coefficient of graft-sEVs and donor IAb + H2Kb Ab analyzed using Imaris. Each triangle represents one FDC network. In (E) and (F), RFP spots per FDC network z stacks were quantified within 90-μm-thick z stacks using Imaris. Experiments were done on 4 spleens per POD (A and B), 6 graft-dLNs per POD (C), 3 graft-dLNs (D), 4 spleens (E), 4 graft-dLNs (F), and 12 graft-dLNs (G). In (B), (C), (E), and (F), comparisons were made by multiple unpaired two-tailed Student’s test. Error bars, means ± SD; *p < 0.05, **p < 0.01, ***p < 0.001, and ****p < 0.0001; NS, not significant.
Figure 2.
Figure 2.. Splenic MZ B cells capture allo-sEVs
(A) Binding (FACS) in vivo of CM-DiI-labeled allo (BALB/c)-sEVs injected i.v. to splenic follicular (Fo) and MZ B6 B cells, 2 and 24 h after injection. Addition of bystander B6 splenocytes (CD45.1) before labeling indicates ex vivo binding to the sEVs. (B) Quantification of binding by splenic B6 B cells to CM-DiI-allo (BALB/c)-sEVs injected i.v. 2 and 24 h prior. Splenocytes from CD45.1 B6 mice were added before labeling to assess ex vivo uptake of sEVs. Each symbol represents one mouse. (C) Binding (FACS) in vitro of CM-DiI-allo (BALB/c)-sEVs to splenic B6 B cells. (D) Percentages (FACS) of splenic B6 B cells that bind CM-DiI-allo (BALB/c)-sEVs in vitro. Each symbol represents one sample. (E) Binding (FACS) of CM-DiI-allo (BALB/c)-sEVs to follicular and MZ B cells at the cell level. Each symbol represents one sample. (F) Binding (FACS) to B6 B cells of CM-DiI-labeled syngeneic (B6) versus allo (C3H)-sEVs; both sEVs were pre-incubated with B6 mouse serum. (G) IEM of allo (C3H)-sEVs attached to a B6 B cell. Original magnifications ×20,000–60,000. Scale bars, 200 nm (H) Binding (FACS) to B6 B cells of CM-DiI-allo (C3H)-sEVs treated with serum from B6 mice, naive or allosensitized with C3H skin allografts. (I) Binding (FACS) of CM-DiI-allo (C3H, H-2K)-sEVs to 3–83-Ig B cells specific for H2KK and control WT BALB/c B cells. (J) Binding (FACS) to WT or CD21/35-deficient (Cr2KO) B6 B cells of CM-DiI-labeled syngeneic sEVs incubated with WT or C3KO B6 serum. In (F) and (H)–(J), sEV concentrations were tested in triplicate, one representative experiment of three per variable. In (B), (D), (E), (F), and (H)–(J), comparisons were by multiple unpaired two-tailed Student’s test. Error bars, means ± SD; **p < 0.01, ***p < 0.001, and ****p < 0.0001; NS, not significant.
Figure 3.
Figure 3.. Complement opsonization of sEVs and their transport by MZ B cells to FDCs
(A and B) Detection (FACS) of C1q (A) and MBL (B) on B6 sEVs untreated or opsonized with serum of WT, μMT, C1qKO, or MBLKO B6 mice. Each symbol represents serum from a different mouse. (C and D) Binding (FACS) of serum IgM (C) and IgG (D) to B6 sEVs opsonized with serum from WT B6, C3H, and BALB/c mice; left untreated (no serum, control); or incubated with irrelevant IgM clone C48–6 (1), IgM clone G155–228 (2), IgG clone 27–35 (1), or IgG clone MOPC21 (2). (E) 2P-microscopy of transfer of CM-DiI-allo-(BALB/c)-sEVs (arrows) from a B6 B cell to a splenic FDC. Scale bar, 10 μm. (F) Percentages of MZ B cells of control WT and CXCR5KO B6 MZ B cell BM chimeras that bound CM-DiI-allo (BALB/c)-sEVs injected i.v. and analyzed by FACS 2 and 24 h later. Bystander CD45.1 B6 B cells were added before labeling to assess ex vivo binding of the injected sEVs. Each symbol represents one mouse. (G) Quantification on spleen sections of WT and CXCR5KO B6 MZ B cell BM chimeras of CM-DiIPos spots per FDC network. Five mice per group. (H) Spleen sections of control WT and CXCR5KO B6 MZ B cell BM chimeras for detection of CM-DiIPos spots (arrows, insets) on FDCs 24 h after i.v. injection of CM-DiI-allo (BALB/c)-sEVs. Representative of five or six mice per variable. Original magnification ×200. Scale bars, 50 μm. In (A)–(D), (F), and (G), comparisons were by multiple unpaired two-tailed Student’s test. Error bars indicate means ± SD; *p < 0.05, **p < 0.01, ***p < 0.001, and ****p < 0.0001; BKGD, background.
Figure 4.
Figure 4.. FDCs internalize and recycle allo-sEVs
(A) FACS analysis of B6 LN FDC-enriched suspensions incubated with CM-DiI-allo (BALB/c)-sEVs. FDCs with remnant B cells attached were excluded by gating CD19Neg FDCs. One of two experiments. (B) Three-dimensional reconstruction by STED microscopy of a B6 FDC following incubation with CM-DiI-allo (BALB/c)-sEVs from the experiment in (A). Top: sEVs bound to the FDC. Bottom: 180° rotation to visualize internalized sEVs at the FDC midsection. Scale bars, 5 μm. (C) IEM of an FDC (pseudo-colored) in the dLN of a BALB/c mouse injected in the footpad with 10-nm-gold CD21/35 Ab to label FDCs and allo (B6)-sEVs coated with 5-nm-gold H2Kb-IAb Abs. Insets: allo-sEVs next to an FDC. N, nucleus; ROI, region of interest. Scale bars, 200 nm (D) IEM of allo (B6)-sEVs in endocytic vesicles of a BALB/c LN FDC, 3 h after footpad injection of the sEVs. Scale bars, 100 nm (E) IEM of footpad-injected allo (B6)-sEVs (5 nm gold) internalized into the labyrinthine infoldings of FDCs heavily labeled with 10-nm-gold CD21/CD35 Ab. N, nucleus. Scale bar, 300 nm. (F) Diagram of pHluorin-CD63-mScarlet-tagged sEVs internalized by FDCs in dLNs and then recycled to the extracellular space, where the sEVs emit green flashes when exposed to neutral pH. Illustration created with BioRender. (G) IEM of pHluorin labeled with 6 nm gold (arrows) on the B6 sEV surface. Scale bar, 50 nm. (H) Time-lapse by 2P-microscopy on an explanted BALB/c LN of recycling of pHluorin-CD63-mScarlet-tagged B6 sEVs from intracellular compartments of FDCs (arrows at 0 and 45 seconds) to the surface of the FDC and extracellular milieu (arrow at 90 seconds), where the sEVs emitted green flashes. Scale bar, 50 μm. For (C)–(E) and (G), original magnifications were ×20,000 and ×80,000.
Figure 5.
Figure 5.. B cells recognize allo-sEVs on FDCs
(A) Cell tracks (2P-microscopy) of alloreactive (blue) and control (yellow) BALB/c B cells in BALB/c dLNs after skin injection of allo (C3H)-sEVs (red). Alloreactive B cells in contact with FDCs (green) with allo (C3H)-sEVs (arrows) showed convoluted tracks (insets, red arrowheads). Scale bar, 40 μm. (B) Mean velocities and arrest coefficients of B cells from (A). In (A) and (B), the results are representative of four dLNs. (C) Instant velocities of individual alloreactive B cell tracks during contact with FDCs presenting allo (C3H)-sEVs. (D) As a control, a comparison of mean velocities and arrest coefficients between alloreactive and control BALB/c B cells in dLNs after injection of syngeneic sEVs. Representative of three LNs. (E) Ca2+ flux in an alloreactive BALB/c B cell (white arrow) after contact with a BALB/c FDC with allo (C3H)-sEVs (red arrows). Representative of two LNs. Scale bar, 10 μm. (F) Cell tracks of alloreactive (blue) and control (magenta) BALB/c B cells in a BALB/c LN draining a skin B6 allograft releasing RFP-sEVs (top images) and in a control non-draining LN (bottom images). ROIs: donor-reactive B cells with short and intricate tracks (red arrowheads) upon contact with BALB/c FDCs with graft (B6)-sEVs (arrows). Scale bars, 40 μm. (G) Mean velocities and arrest coefficients of B cells from (F). In (F) and (G), results are representative of four graft-dLNs and four non-dLNs. In (B), (D), and (G), comparisons were by two-tailed Student’s test. Error bars, means ± SD; *p < 0.05, **p < 0.01, and ****p < 0.0001; NS, not significant.
Figure 6.
Figure 6.. Graft-sEVs promote B cell alloimmunity
(A) Surrogate allo-Ag skin transplant model in which allo-Ag is provided by allo (B6)-sEVs injected under syngeneic BALB/c grafts. Created with BioRender. (B) Generation of donor-specific GC B cells in graft-dLNs following delivery of allo (B6)-sEVs under skin syngeneic BALB/c grafts, assessed by FACS on POD 12. As controls, syngeneic (BALB/c) sEVs were injected under the BALB/c grafts. (C) Quantification of GC B cells per graft-dLN of the experiment in (B). Each dot represents one LN. (D) Analysis by FACS on POD 21 of DSA IgG isotypes in serum of BALB/c mice grafted with skin syngeneic grafts untreated or injected underneath with allo (B6)-sEVs (intact or lysed) or syngeneic sEVs. Each symbol represents one mouse. Dotted lines, background threshold for each IgG isotype. (E) DSA IgG isotypes analyzed on POD 21 by FACS in serum of BALB/c mice grafted with allogeneic (B6) or syngeneic skin. Each symbol represents a mouse. (F) Binding by GC (BALB/c) B cells to PE-H2Kb (or control PE-H2Kd) tetramer in graft-dLNs (FACS) on PODs 12 and 21 after administration of allo (B6, H2b)-sEVs under skin syngeneic grafts. Representative of five recipients per POD. (G) EM of allo (B6)-sEVs intact or after disruption. Original magnification ×80,000. Scale bars, 200 nm. (H) MHC-I and -II content (western blot) in B6 sEVs untreated or disrupted. In (C), (D), and (E), comparisons were by two-tailed Student’s test. Error bars indicate means ± SD; *p < 0.05, **p < 0.01, and ***p < 0.001.
Figure 7.
Figure 7.. Reduced graft-sEVs leads to fewer allo-Ags in FDCs and DSAs—binding of sEVs to human FDCs
(A) Isolation of sEVs from culture supernatants of WT or Rab27aKO B6 mouse skin explants under pro-inflammatory conditions. Diagram created with BioRender. (B) Microscopy of cryosections of BALB/c LNs draining WT or Rab27aKO B6 skin allografts. Donor H2 Ag was detected using a cocktail of biotin-IAb and -H2Kb Abs. Original magnification ×200. Representative of eight LNs per variable. Scale bars, 30 μm. (C) Quantification with ImageJ of donor (B6) H2 AgPos spots on FDCs in skin graft-dLNs pooled from eight BALB/c recipients per POD (left). DSAs (FACS) in sera of BALB/c mice transplanted with WT or Rab27aKO B6 skin (right). Each symbol represents one recipient. (D) EM of CM-DiI-labeled sEVs from supernatants of human DCs. Original magnification ×80,000. Scale bar, 200 nm. (E) Western blot with sEV markers Tsg101 and CD63, and lack of the endoplasmic reticulum marker GRP94, on the human sEVs used in the experiments in (F)–(I). (F) Quantification (Imaris) of CM-DilPos spots in FDCs on cryosections of human spleens incubated with CM-DiI-human allo-sEVs untreated or opsonized with normal human serum, unprocessed or heat de-complemented. (G) Representative cryosections of human spleen incubated (or not, control) with CM-DiI-human allo-sEVs (red) untreated or opsonized with normal or heat-decomplemented human serum. FDCs are labeled with CD35 Ab (green). Arrows indicate CM-DiI-human allo-sEVs retained on the tissue cryosections. Original magnification ×400. Scale bar, 10 μm. (H) Overlapping of CM-DiI-human allo-sEVs and human splenic FDCs. (I) STED microscopy revealed that the CM-DilPos spots (circles) by fluorescence microscopy in human FDCs are clusters of sEVs. Scale bars, 0.5 μm. In (C) and (F), comparisons were by two-tailed Student’s test. Error bars, means ± SD; **p < 0.01, ***p < 0.001, and ****p < 0.0001; NS, not significant.

Similar articles

References

    1. Mathieu M, Martin-Jaular L, Lavieu G, and Théry C (2019). Specificities of secretion and uptake of exosomes and other extracellular vesicles for cell-to-cell communication. Nat. Cell Biol. 21, 9–17. 10.1038/s41556-018-0250-9. - DOI - PubMed
    1. Robbins PD, and Morelli AE (2014). Regulation of immune responses by extracellular vesicles. Nat. Rev. Immunol. 14, 195–208. 10.1038/nri3622. - DOI - PMC - PubMed
    1. Zeng F, and Morelli AE (2018). Extracellular vesicle-mediated MHC cross-dressing in immune homeostasis, transplantation, infectious diseases, and cancer. Semin. Immunopathol. 40, 477–490. 10.1007/s00281-018-0679-8. - DOI - PMC - PubMed
    1. Buzas EI (2023). The roles of extracellular vesicles in the immune system. Nat. Rev. Immunol. 23, 236–250. 10.1038/s41577-022-00763-8. - DOI - PMC - PubMed
    1. Liu Q, Rojas-Canales DM, Divito SJ, Shufesky WJ, Stolz DB, Erdos G, Sullivan MLG, Gibson GA, Watkins SC, Larregina AT, and Morelli AE (2016). Donor dendritic cell-derived exosomes promote allograft-targeting immune response. J. Clin. Investig. 126, 2805–2820. - PMC - PubMed

Substances

LinkOut - more resources