. 2025 Aug;247(4):1763-1776.
doi: 10.1111/nph.70303. Epub 2025 Jun 14.

UV RESISTANCE LOCUS 8 signalling enhances photosynthetic resilience to herbicide-induced damage in Arabidopsis thaliana

Affiliations

UV RESISTANCE LOCUS 8 signalling enhances photosynthetic resilience to herbicide-induced damage in Arabidopsis thaliana

Christopher L Groves et al. New Phytol. 2025 Aug.

Abstract

Perception of low irradiance ultraviolet B (UV-B) light (280-315 nm) by the UV RESISTANCE LOCUS 8 (UVR8) photoreceptor initiates signalling pathways that enhance plant defences to UV-B damage, mitigating the effects of higher photon irradiances. We therefore questioned whether UVR8 signalling could also prime plants against herbicide-induced damage, promoting postspray survival. We assessed the effects of a 2 d, low irradiance UV-B pretreatment on the photosynthetic resilience and survival of Arabidopsis thaliana plants treated with herbicides promoting photosynthetic disruption and oxidative stress. UV-B acclimation increased leaf carotenoid production, antioxidant activity and nonphotochemical quenching (NPQ) and delayed herbicide-induced reductions in electron transport rate (ETR), facilitating postspray regrowth and enhancing plant survival. In the absence of UV-B, this protection declined within 4 d, suggesting that it is unlikely to result from structural modifications. UV-B-mediated enhancement of photosynthetic resilience was abolished in the uvr8-6 mutant and increased in the UV-B hyper-responsive repressor of UV-B photomorphogenesis1/2 (rup1rup2) mutant, highlighting the involvement of UVR8 signalling. UV-B filtering during daylight acclimation also increased herbicide efficacy in Chenopodium, suggesting similar responses in agricultural weeds. UV-B-induced photoprotection enhances the resilience of plant photosystems to herbicide damage, providing a key target for increasing product efficacy and reducing usage.

Keywords: Arabidopsis; Chenopodium; UVR8; UV‐B; herbicide; photosynthesis.


Conflict of interest statement

None declared.

Figures

Fig. 1
Fig. 1
Low‐dose ultraviolet B (UV‐B) treatment enhances Atrazine (ATZ) tolerance. (a) F v/F m of Arabidopsis plants following UV‐B supplementation and ATZ treatment at different rates. Plants were grown on soil for 21 d in white light (photosynthetically active radiation (PAR): 80 μmol m−2 s−1) at 20°C. Half the plants were then treated with supplementary narrowband UV‐B at 1 μmol m−2 s−1 for 2 d before ATZ treatment (PAR + UV‐B). Four rates of ATZ were sprayed (40, 60, 80 and 100 gai ha−1) in a 10% acetone + 0.1% Genapol X‐080 formulation at 2 h postdawn. Data points represent mean values, and bars represent SEM. n = 10. Differences between light treatments at each rate were calculated using a two‐way ANOVA and Tukey's post hoc test. ***, P < 0.001. (b) The effect of UV‐B acclimation on plant survival following ATZ treatment. Plants were grown and treated as in (a). Survival (represented as %) was determined by the presence of green tissue 14 d after spraying. n = 72 over eight experiments (PAR) and 42 over five experiments (PAR + UV‐B). Variation is shown as SEM between % survival values (c) The effect of 80 gai ha−1 ATZ treatment on leaf Chl content, with and without UV‐B‐acclimation. Plants were grown and treated as in (a). Total Chl was extracted from rosette leaf 2 at 0 and 7 d postspray. Data are presented as boxplots showing the median and interquartile range of each group. The upper and lower whiskers represent data within 1.5 × IQR. Dots represent outliers. Different letters represent significant differences (P < 0.05). n = 12.
Fig. 2
Fig. 2
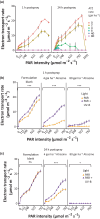
Low‐dose ultraviolet B (UV‐B) treatment delays Atrazine (ATZ)‐induced reductions in electron transport rate (ETR). (a) ETR of Arabidopsis plants following UV‐B supplementation and ATZ treatment at different rates. Plants were grown on soil for 21 d in white light (photosynthetically active radiation (PAR): 80 μmol m−2 s−1) at 20°C. ATZ was sprayed in a 10% acetone 0.1% Genapol X‐080 formulation at 0, 2, 4, 8, 40 and 80 gai ha−1 at 2 h postdawn. ETR was measured 1 and 24 h later using a rapid light curve (RLC), with saturating pulses every 30 s and actinic light applied in 0, 0, 50, 76, 111, 153, 248, 372, 522, 689, 792, 908, 1031 μmol m−2 s−1 steps. (b, c) Effect of UV‐B acclimation on ETR following ATZ application. Plants were grown as in (a) but half were treated with supplementary narrowband UV‐B at 1 μmol m−2 s−1 for 2 d before ATZ treatment (PAR + UV‐B). ATZ was sprayed at 4 and 80 gai ha−1. ETR was measured 1 h (b) and 24 h (c) later using a RLC, with saturating pulses every 20 s and actinic light applied in 0, 36, 76, 153, 248, 372, 445, 522, 605, 698 and 792 μmol m−2 s−1 steps. n = 3 (a) and 7–8 (b, c). Data points represent mean values, and bars represent SEM. Differences between light treatments at each rate were calculated using a two‐way ANOVA and Tukey's post hoc test. *, P < 0.05; **, P < 0.01; ***, P < 0.001.
Fig. 3
Fig. 3
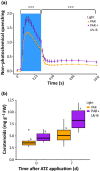
Low‐dose ultraviolet B (UV‐B) increases carotenoid production and enhances nonphotochemical quenching (NPQ). (a) The effect of UV‐B acclimation on NPQ. Arabidopsis plants were grown on soil for 21 d in white light (photosynthetically active radiation (PAR): 80 μmol m−2 s−1) at 20°C. Half the plants were then treated with supplementary narrowband UV‐B at 1 μmol m−2 s−1 for 2 d. NPQ was measured at 2 h postdawn using an induction curve followed by recovery. The induction curve was performed by making an initial F v/F m measurement and then Y(II) measurement in 76 μmol m−2 s−1 actinic light every 20 s for 5 min (blue background). Actinic light was then switched off, and Y(II) measured over the next 10 min at increasingly longer intervals to measure recovery. n = 5. Data points represent mean values, and bars represent SEM. Differences between light treatments were calculated using a two‐way ANOVA. ***, P < 0.001. (b) The effect of ATZ treatment on leaf carotenoid content, with and without UV‐B acclimation. Plants were grown and treated as in (a) before spraying with Atrazine (ATZ) at 80 gai ha−1 at 2 h postdawn. Total carotenoids were extracted from rosette leaf 2 at 0 and 7 d postspray. Data are presented as boxplots showing the median and interquartile range of each group. The upper and lower whiskers represent data within 1.5 × IQR. Dots represent outliers. Different letters represent significant differences (P < 0.05). n = 12.
Fig. 4
Fig. 4
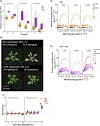
Ultraviolet B (UV‐B)‐mediated promotion of Atrazine (ATZ) tolerance involves UV RESISTANCE LOCUS 8 (UVR8) signalling. (a) The role of UVR8 signalling in UV‐B‐mediated F v/F m enhancement following ATZ application. Arabidopsis Columbia‐0 (Col‐0), uvr8‐6 and rup1/2 plants were grown on soil for 21 d in white light (PAR: 80 μmol m−2 s−1) at 20°C. Half the plants were then treated with supplementary narrowband UV‐B at 1 μmol m−2 s−1 for 2 d before ATZ spraying (PAR + UV‐B). ATZ was sprayed at 80 gai ha−1 in a 10% acetone + 0.1% Genapol X‐080 formulation at 2 h post‐dawn. Data points represent mean F v/F m values, and bars represent SEM. n = 10. Differences between light treatments in each genotype were calculated using a two‐way ANOVA and Tukey's post hoc test. ***, P < 0.001. (b) Chl fluorescence images from before and 72 h after ATZ application. Photosystem II (PSII) health is displayed as a false colour image, with purple representing a F v/F m value of 1, and black, 0 (complete breakdown of PSII). A healthy plant will have a F v/F m value of c. 0.8 (dark blue). (c) The role of UVR8 signalling in UV‐B‐mediated ATZ tolerance. Col‐0, uvr8‐6 and rup1/2 plants were grown and treated as in (a). Survival (represented as %) was determined by the presence of green tissue 14 d after spraying. For both PAR and +UV‐B, n = 24 across three experiments. Variation is shown as SE between % survival values. (d, e) The role of UVR8 signalling on UV‐B‐mediated ETR enhancement following ATZ application. Col‐0, uvr8‐6 and rup1/2 plants were grown and treated as in (a). ETR values were recorded before and after ATZ treatment for PAR (d) and PAR + UV‐B (e) treated plants. Plants were illuminated with 0, 20, 36, 50, 76, 111, 153, 198, 248, 308, 372, 445, 522, 698, 908 and 1194 μmol m−2 s−1 actinic light in 30 s steps, and Y(II) measured at the end of each step, which was then used to calculate ETR. n = 4 (nonacclimated) and 10 (UV‐B acclimated). Data points represent mean values, and bars represent SEM. (f) The role of UVR8 signalling in UV‐B‐mediated NPQ enhancement. Col‐0, uvr8‐6 and rup1/2 plants were grown and treated as in (a). Plants were illuminated with 0, 20, 36, 50, 76, 111, 153, 198, 248, 308, 372, 445, 522, 698, 908 and 1194 μmol m−2 s−1 actinic light in 30 s steps, and NPQ measured at the end of each step. n = 4 (nonacclimated plants) and 10 (UV‐B acclimated plants). Data points show mean values, and bars represent SEM. For each genotype, differences between light treatments were identified using two‐way ANOVA testing for the interaction between light treatment and PAR intensity; **, P < 0.01; ***, P < 0.001; ns, nonsignificant.
Fig. 5
Fig. 5
UV RESISTANCE LOCUS 8 (UVR8) signalling promotes Paraquat (PQT) tolerance. (a) F v/F m of Arabidopsis Columbia‐0 (Col‐0) and uvr8‐6 plants treated with and without ultraviolet B (UV‐B) acclimation, following PQT spraying. Plants were grown on soil for 14 d in white light (photosynthetically active radiation (PAR): 80 μmol m−2 s−1) at 20°C. Half the plants were then treated with supplementary narrowband UV‐B at 1 μmol m−2 s−1 for 2 d before PQT spraying (PAR + UV‐B). PQT was applied at 10 gai ha−1 in a 0.1% Genapol X‐080 formulation 2 h postdawn. F v/F m values were recorded at 6, 24 and 72 h postspray. A two‐way ANOVA comparing the interaction between light and genotype with a Tukey's post hoc test was used to identify differences between treatments. Data are presented as boxplots showing the median and interquartile range of each group. The upper and lower whiskers represent data within 1.5 × IQR. Dots represent outliers. Different letters represent significant differences (P < 0.05). n = 12. (b) The effect of UV‐B acclimation on plant survival following PQT treatment. Plants were grown and treated as in (a) before spraying with PQT at 20 gai ha−1. Survival (represented as %) was determined by the presence of green tissue 14 d after spraying. For both PAR and +UV‐B, n = 12 across three experiments. Variation is shown as SEM between % survival values. (c) The effect of UV‐B acclimation on reactive oxygen species (ROS) production following PQT treatment. Plants were grown for 21 d as in (a) and half treated with supplementary narrowband UV‐B at 1 μmol m−2 s−1 for 2 d before PQT spraying. ROS production was measured using the cell permeable fluorescent stain H2DCFDA. First rosette leaves were excised and submerged in 50 mM pH 7.4 phosphate buffer containing 25 μM H2DCFDA for 20 min to obtain a baseline fluorescence reading before herbicide treatment. Leaves were then submerged in either a blank formulation (0.1% DMSO in 50 mM pH 7.4 phosphate buffer) or 0.43 mM PQT, and fluorescence recorded after 1, 2, 4 and 24 h. A two‐way ANOVA with a Tukey's post hoc test was used to identify differences between treatments. Data are presented as boxplots showing the median and interquartile range of each group. The upper and lower whiskers represent data within 1.5 × IQR. Dots represent outliers. Different letters represent significant differences (*, P < 0.05). n = 7. (d, e) The role of UVR8 signalling in UV‐B‐mediated ETR enhancement following PQT application. Col‐0, uvr8‐6 and rup1/2 plants were grown for 21 d as in (a) and half treated with supplementary narrowband UV‐B at 1 μmol m−2 s−1 for 2 d before PQT spraying at 20 gai ha−1. ETR values were recorded before and after PQT treatment in PAR (d) and PAR + UV‐B (e) treated plants. Plants were illuminated with 0, 20, 36, 50, 76, 111, 153, 198, 248, 308, 372, 445, 522, 698, 908 and 1194 μmol m−2 s−1 actinic light in 30 s steps, and Y(II) measured at the end of each step, which was then used to calculate ETR. Data points represent mean values, and bars represent SEM. n = 6.
Fig. 6
Fig. 6
Hypothetical model of how UV RESISTANCE LOCUS 8 (UVR8) signalling promotes tolerance to herbicides with modes of action involving photosystem II (PSII) disruption and reactive oxygen species (ROS) generation. In the absence of ultraviolet B (UV‐B) acclimation, herbicide application stops photosynthetic electron transport within 1 h. ROS accumulate, regrowth is inhibited, and plant survival rates are very low. Absorption of low‐dose UV‐B by the UVR8 photoreceptor before herbicide application leads to UVR8 monomerisation and the initiation of signalling pathways promoting ROS defences. REPRESSOR OF UV‐B PHOTOMORPHOGENESIS (RUP) proteins are induced, which then facilitate UVR8 redimerisation, attenuating signalling. Active UVR8 promotes the accumulation of antioxidant defences through multiple mechanisms. Flavonoids are increased through transcriptional upregulation of the CHALCONE SYNTHASE (CHS) enzyme, CAT3 abundance is increased, carotenoid production is elevated, and increased quenching of excited Chl occurs via nonphotochemical quenching (NPQ). Following UV‐B acclimation, the inhibition of herbicide‐induced electron transport is slowed, facilitating regrowth and increasing plant survival.

Similar articles

References

    1. Allorent G, Lefebvre‐Legendre L, Chappuis R, Kuntz M, Truong TB, Niyogi KK, Ulm R, Goldschmidt‐Clermont M. 2016. UV‐B photoreceptor‐mediated protection of the photosynthetic machinery in Chlamydomonas reinhardtii . Proceedings of the National Academy of Sciences, USA 113: 14864–14869. - PMC - PubMed
    1. Badmus UO, Crestani G, Cunningham N, Havaux M, Urban O, Jansen MAK. 2022. UV radiation induces specific changes in the carotenoid profile of Arabidopsis thaliana . Biomolecules 12: 1879. - PMC - PubMed
    1. Baker NR. 2008. Chlorophyll fluorescence: a probe of photosynthesis in vivo . Annual Review of Plant Biology 59: 89–113. - PubMed
    1. Beketov MA, Kefford BJ, Schäfer RB, Liess M. 2013. Pesticides reduce regional biodiversity of stream invertebrates. Proceedings of the National Academy of Sciences, USA 110: 11039–11043. - PMC - PubMed
    1. Belbin FE, Hall GJ, Jackson AB, Schanscheiff FE, Archibald G, Formstone C, Dodd AN. 2019. Plant circadian rhythms regulate the effectiveness of a glyphosate‐based herbicide. Nature Communications 10: 3704. - PMC - PubMed

MeSH terms

Grants and funding

LinkOut - more resources